. 2020 Jul 10;369(6500):202-207.
doi: 10.1126/science.aay5663.

HEM1 deficiency disrupts mTORC2 and F-actin control in inherited immunodysregulatory disease

Affiliations

HEM1 deficiency disrupts mTORC2 and F-actin control in inherited immunodysregulatory disease

Sarah A Cook et al. Science. .

Abstract

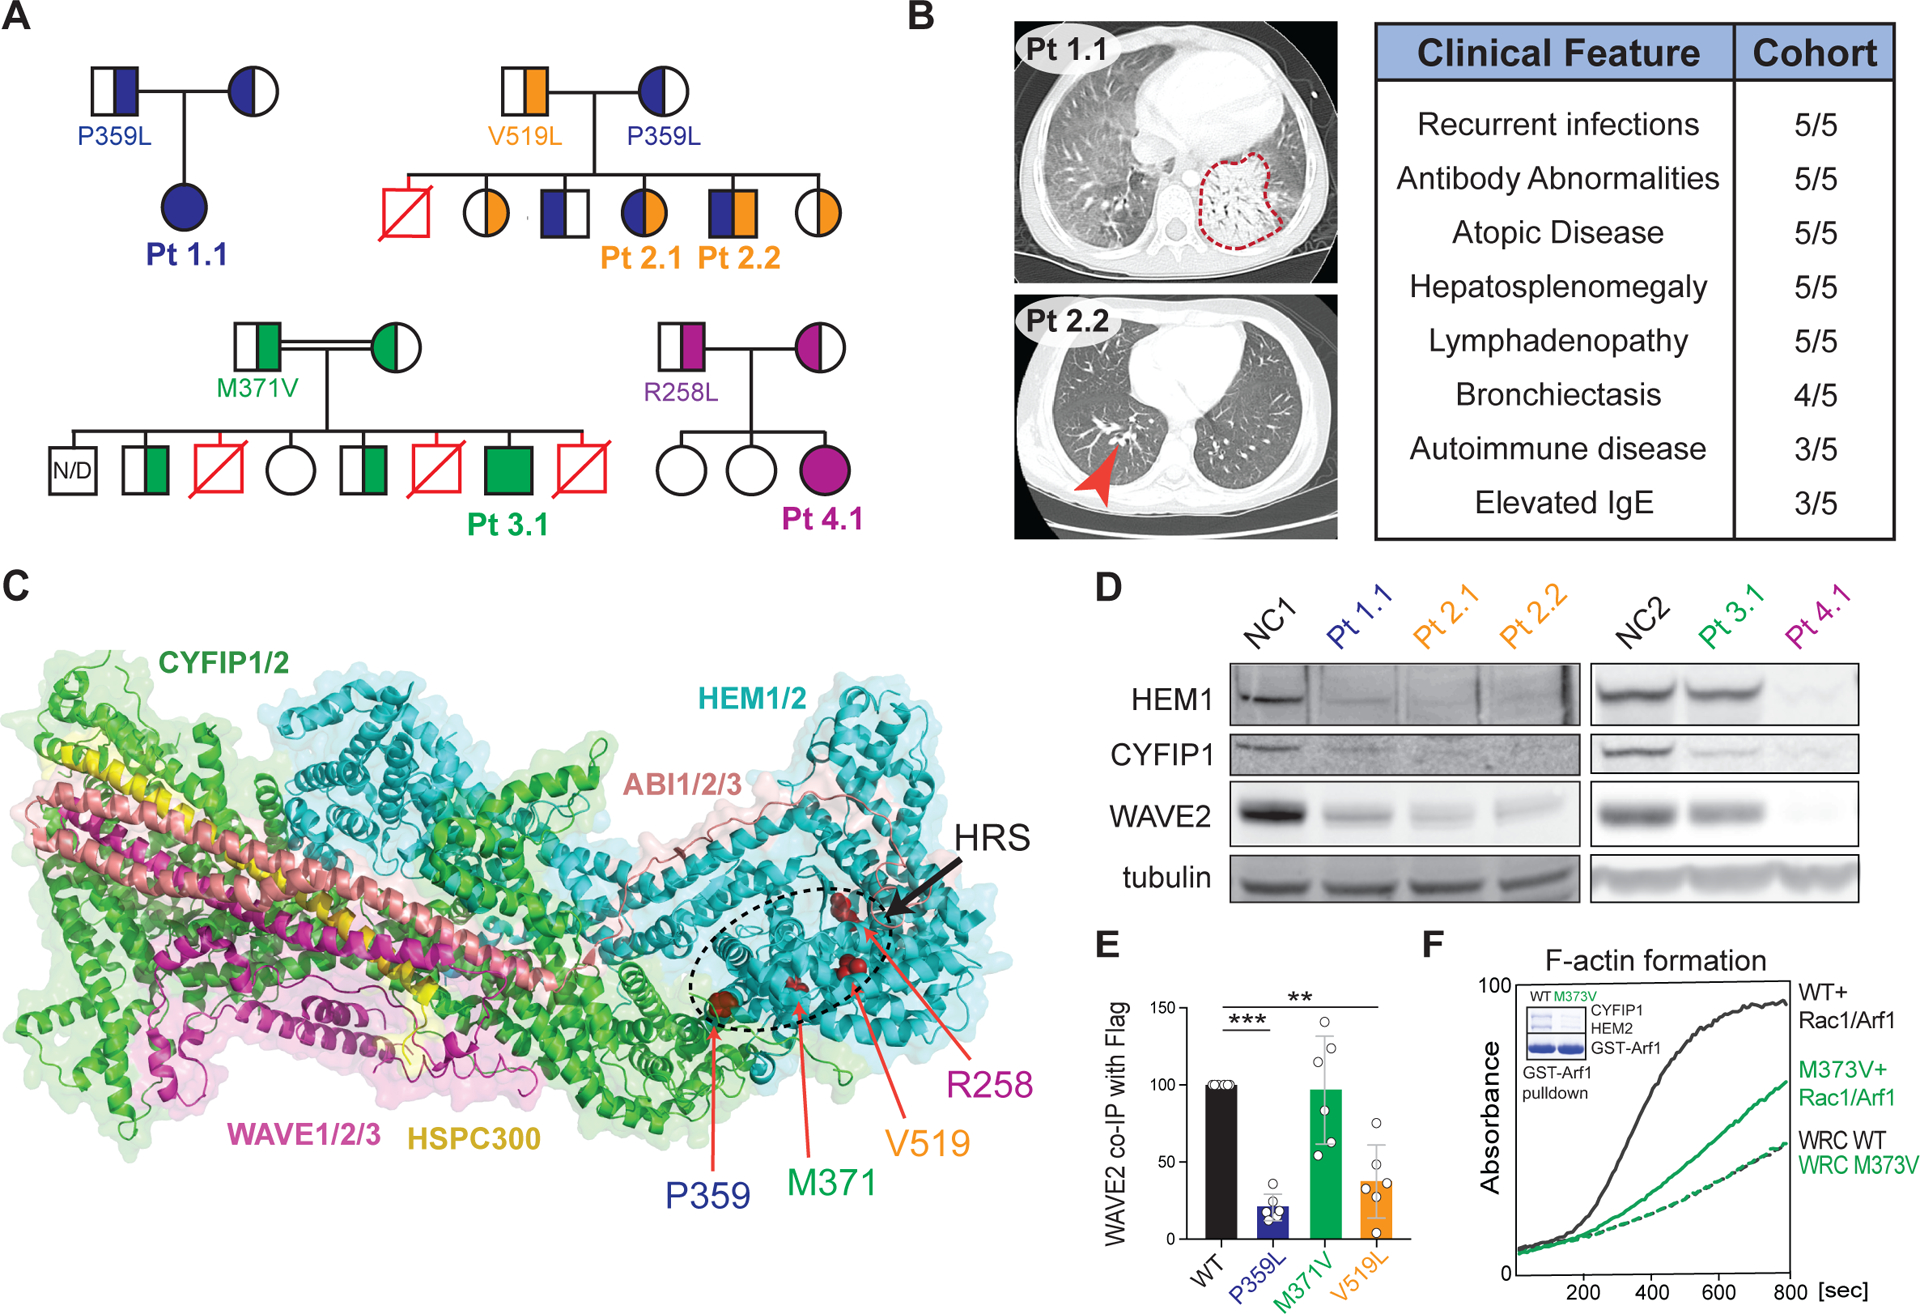
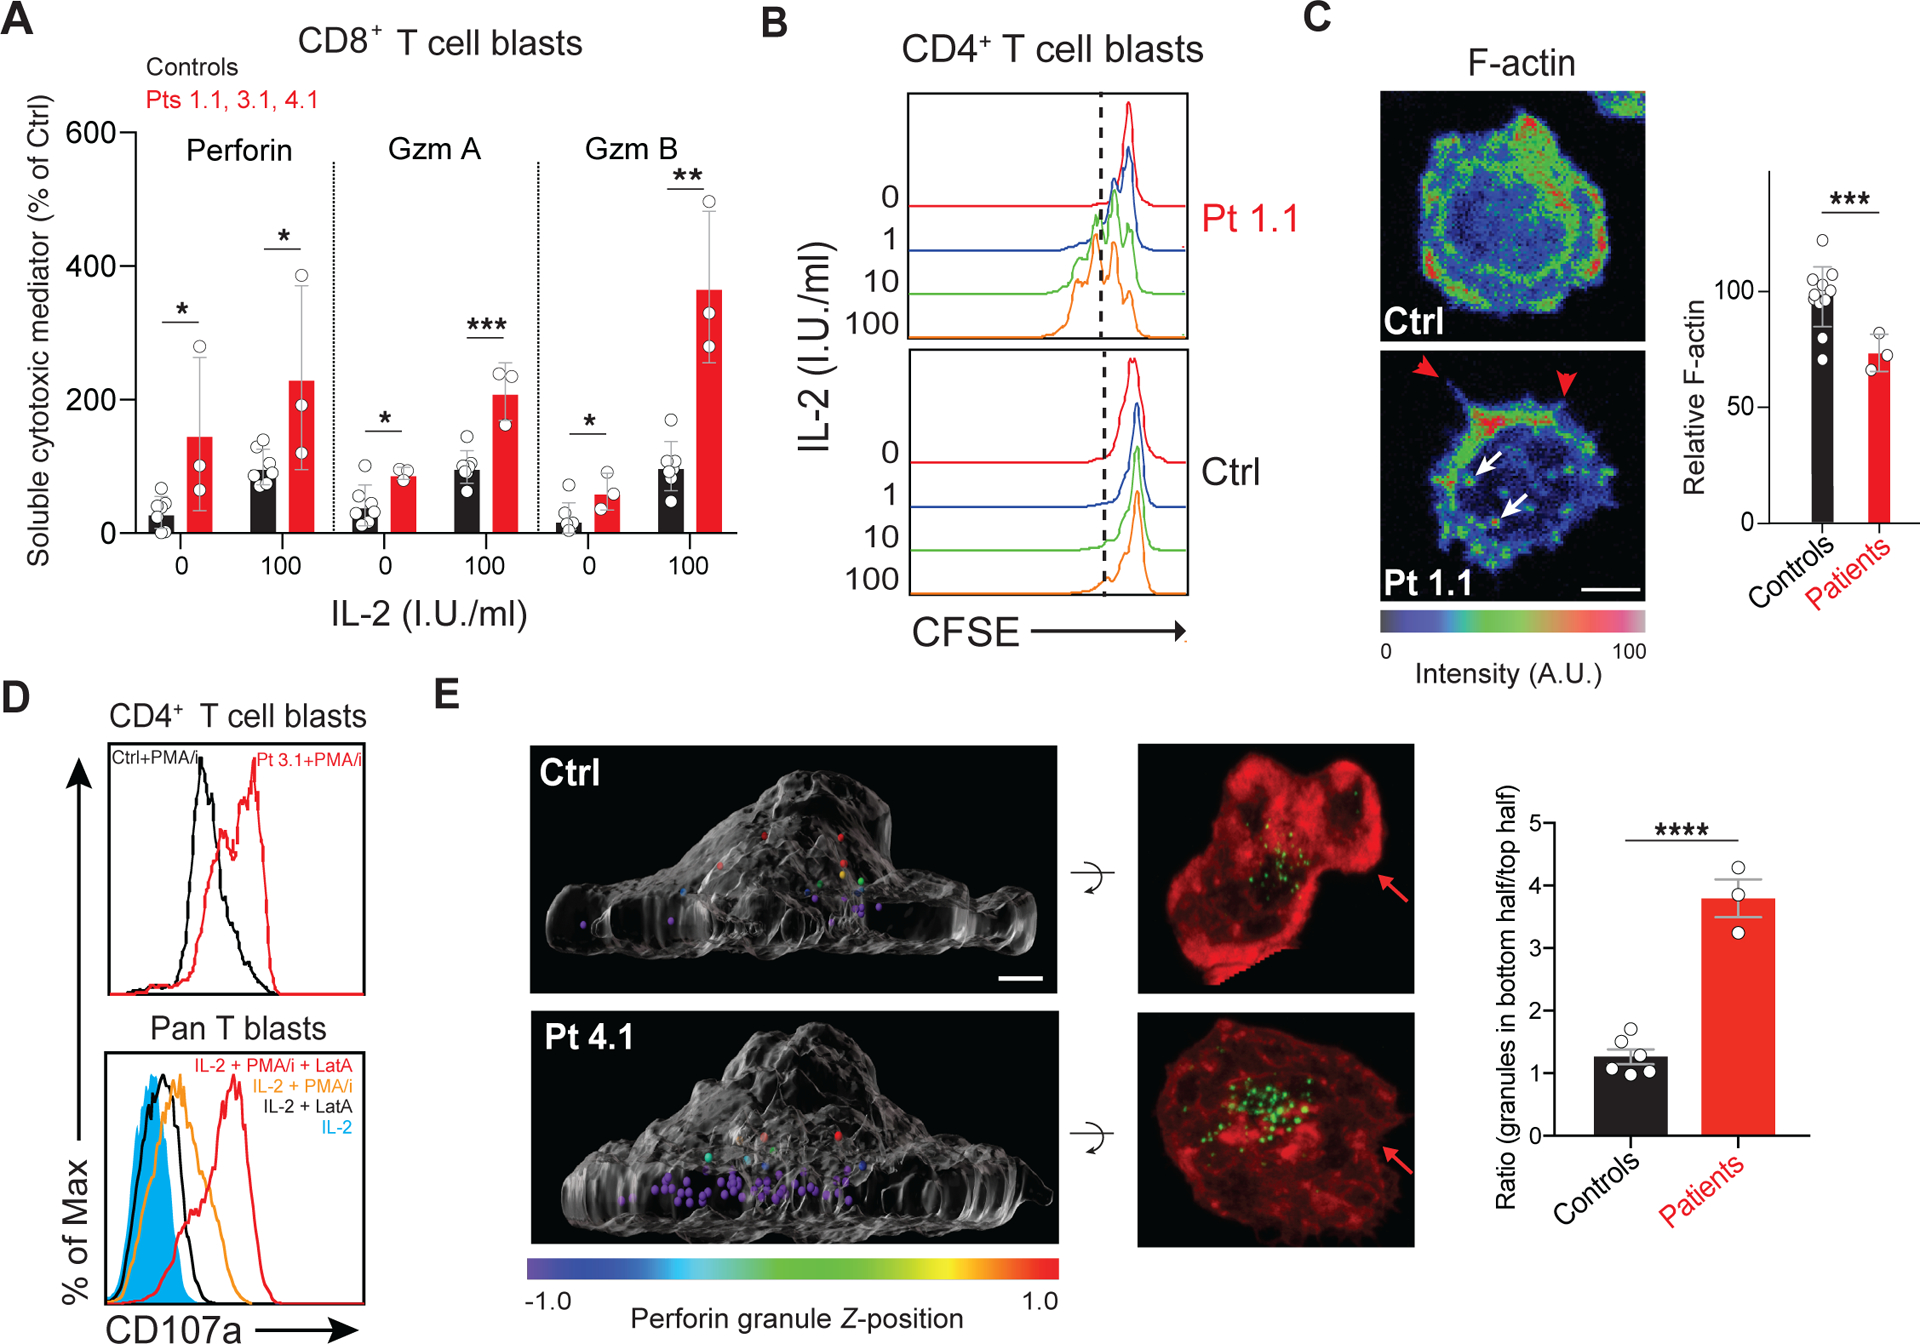
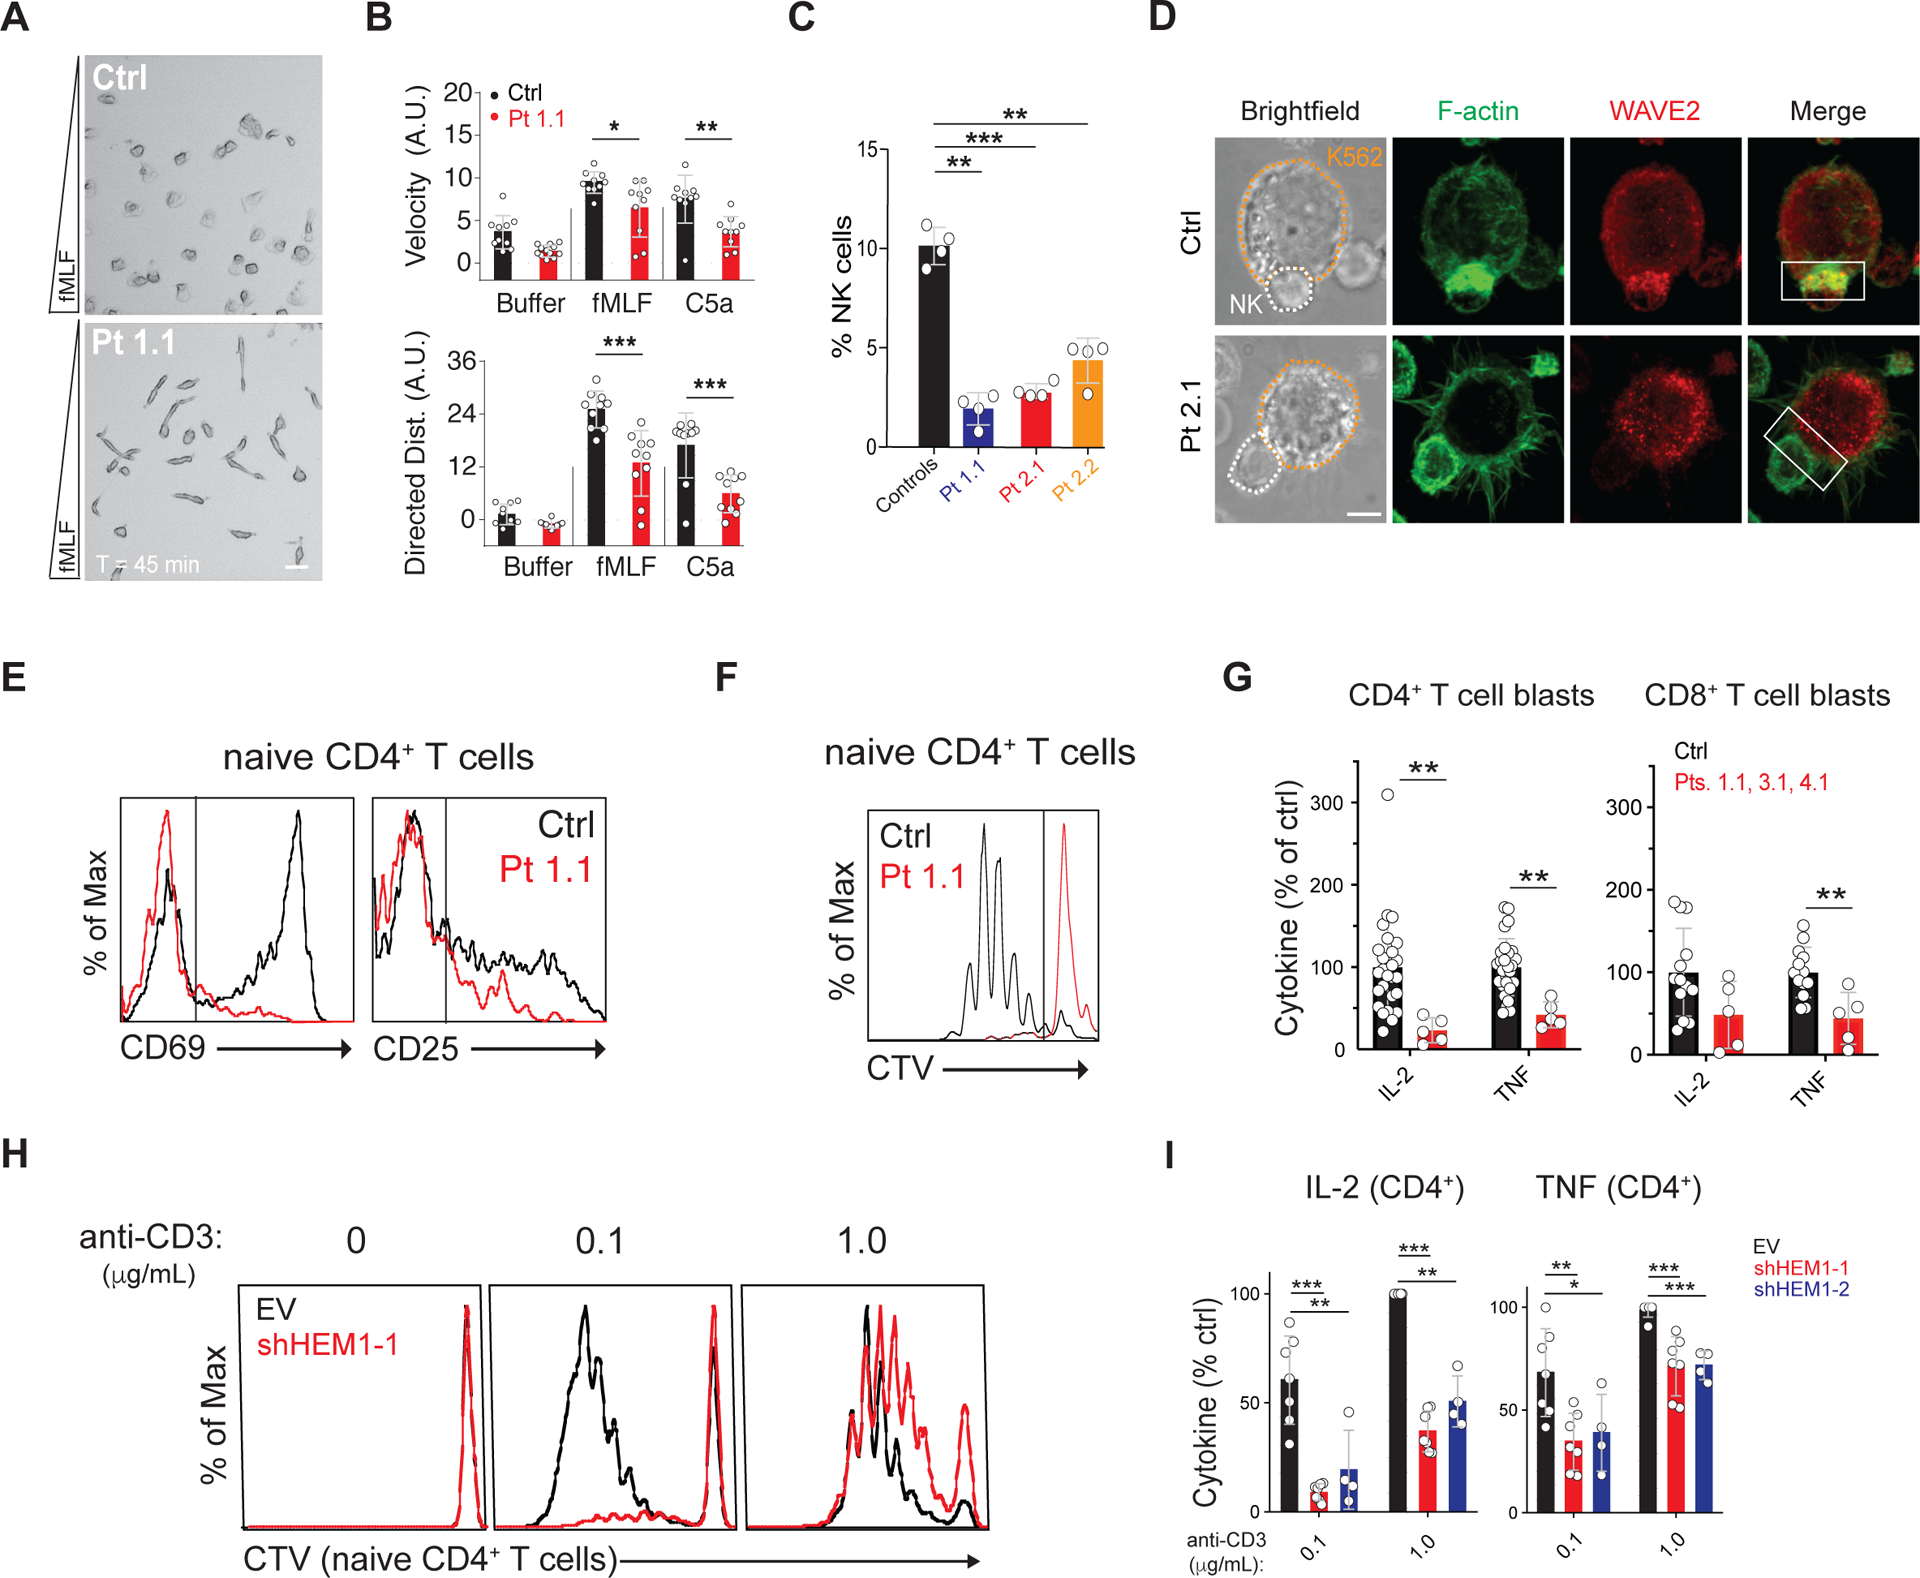
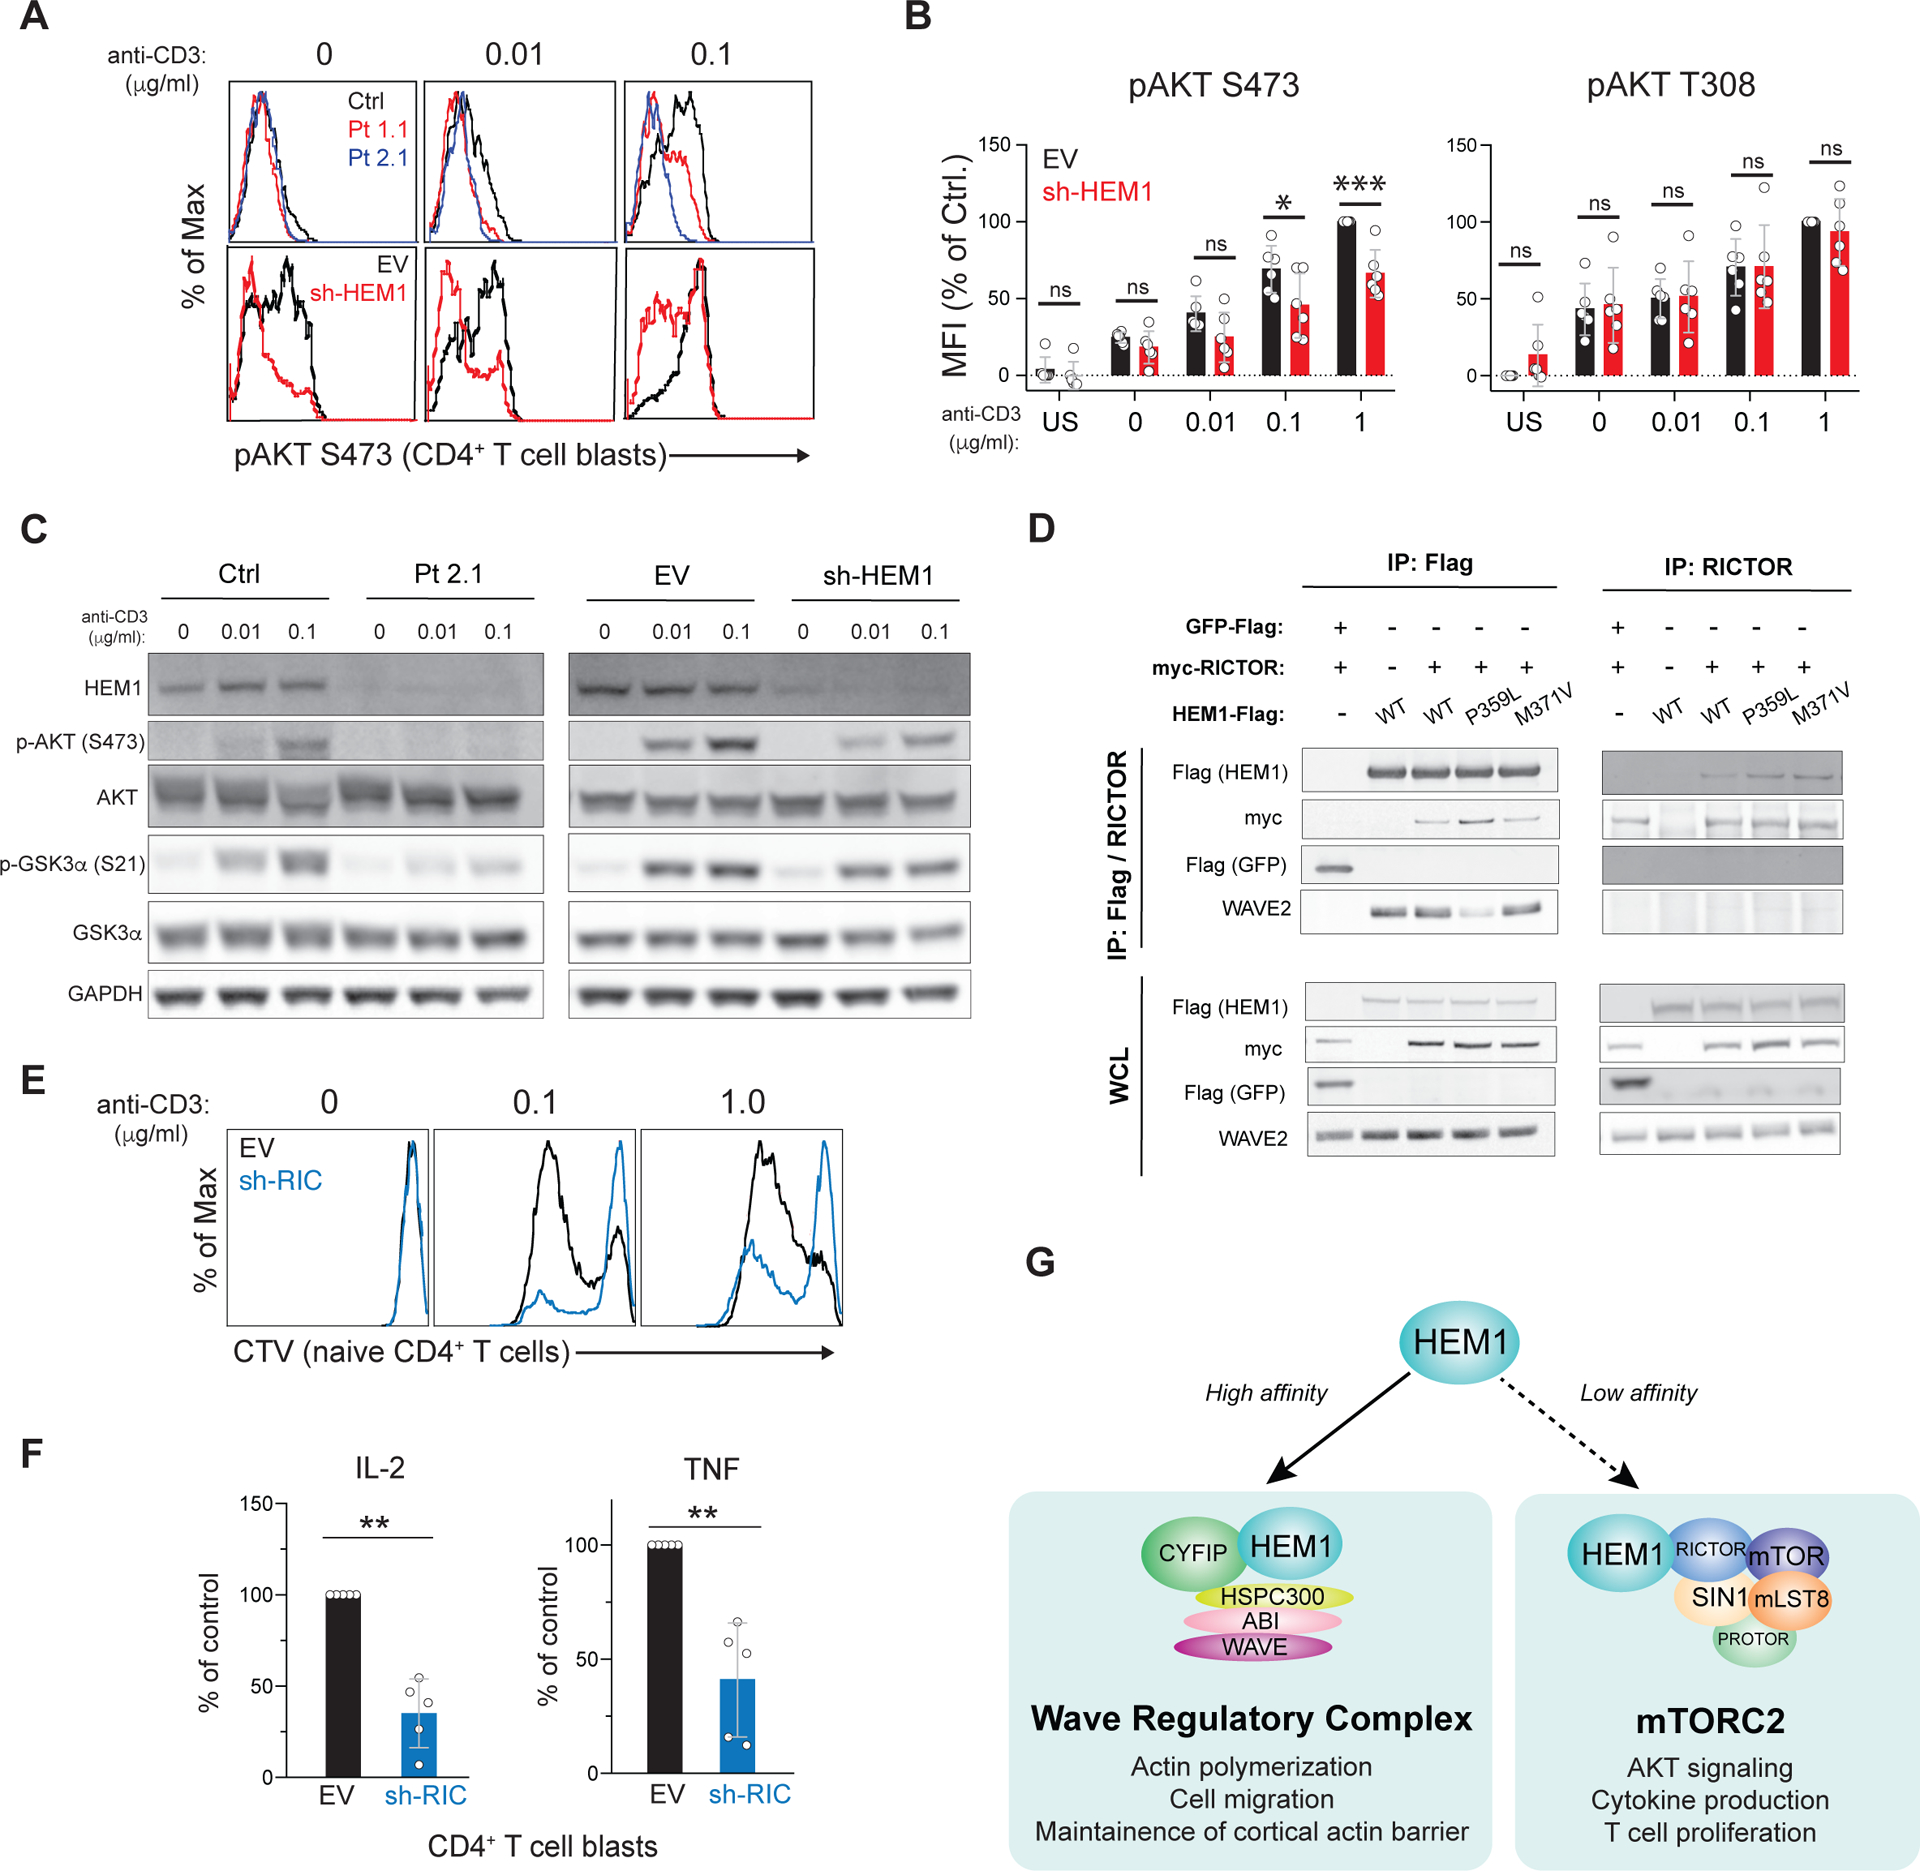
Immunodeficiency often coincides with hyperactive immune disorders such as autoimmunity, lymphoproliferation, or atopy, but this coincidence is rarely understood on a molecular level. We describe five patients from four families with immunodeficiency coupled with atopy, lymphoproliferation, and cytokine overproduction harboring mutations in NCKAP1L, which encodes the hematopoietic-specific HEM1 protein. These mutations cause the loss of the HEM1 protein and the WAVE regulatory complex (WRC) or disrupt binding to the WRC regulator, Arf1, thereby impairing actin polymerization, synapse formation, and immune cell migration. Diminished cortical actin networks caused by WRC loss led to uncontrolled cytokine release and immune hyperresponsiveness. HEM1 loss also blocked mechanistic target of rapamycin complex 2 (mTORC2)-dependent AKT phosphorylation, T cell proliferation, and selected effector functions, leading to immunodeficiency. Thus, the evolutionarily conserved HEM1 protein simultaneously regulates filamentous actin (F-actin) and mTORC2 signaling to achieve equipoise in immune responses.


Conflict of interest statement

Competing interests: The authors declare no competing financial interests.

Figures

Figure 1.
Figure 1.. Immunodysregulatory disorder due to genetic HEM1 deficiency.
(A) Patient (Pt) pedigrees showing recessive inheritance of disease and HEM1 amino acid substitutions. Red symbols: deceased affected siblings, unknown genotype; N/D: not determined. (B) Chest CT scans showing ground glass opacity and pneumonia (red outline) in Pt 1.1 (upper left), bronchiectasis (red arrow) in Pt. 2.2 (bottom left). Key shared clinical features (right). (C) Structural location of patient variants in HEM1 in the WRC (PDB 3P8C, PMID 21107423). HRS: HEM1 regulatory site. (D) Immunoblot of WRC components in lysates derived from Pt and normal control (NC) CD4+ (left) and CD8+ (right) T cell blasts. (E) Quantification of WAVE2 co-immunoprecipitated by WT or mutant HEM1-Flag constructs in six independent experiments. Statistical analysis was performed using a one-sample t-test. (F) Pyrene-actin polymerization assay with WRC230VCA containing HEM2 WT or M373V, with or without activation by a Rac1-Arf1 heterodimer pre-loaded with GMPPNP. Inset: Coomassie blue-stained gel showing GST-Arf1 pull-down of WRC230VCA containing HEM2 WT or M373V and Rac1 (Q61L/P29S). Data are representative of four independent experiments. [**P ≤ 0.01, ***P ≤ 0.001.]
Figure 2.
Figure 2.. HEM1 is essential for regulating cortical actin and granule release
(A) Release of granzymes (Gzm) A and B or perforin from Pt or control (Ctrl) CD8+ T cell blasts following 18-hours of IL-2 stimulation in international units (I.U.) in three independent experiments. (B) Flow cytometric histograms measuring proliferation of rested CD4+ T cell blasts from a normal control (Ctrl) or Patient 1.1 (Pt 1.1) measured by carboxyfluorescein succinimidyl ester (CFSE) dilution after IL-2 restimulation for 96 hours. (C) Ctrl or Pt 1.1 CD4+ T cell blasts spreading on coverslips coated with anti-CD3, anti-CD28, and ICAM-1 (1 μg/ml each), stained with phalloidin, and pseudo-colored for F-actin (left). F-actin was quantified in three experiments (right). Red arrows: formin-mediated spikes; white arrows: WASp-mediated actin puncta. Scale bar: 4 μm. (D) Surface CD107a on Ctrl and Pt 3.1 CD4 T cell blasts following 1-hour phorbol myristate acetate (PMA)/ionomycin (I) stimulation (top) or stimulated pan T cells with 1 μM latrunculin A (LatA) (bottom). (E) Side view of perforin granules pseudo-colored by Z-position relative to the cell center in Ctrl or Pt 1.1 CD8+ T cell blasts (left). Corresponding 90° forward rotation top views of F-actin (red) and perforin (green) (middle). Red arrows: lamellipodial F-actin density. Scale bar: 2 μm. Mean ratios of granules in the bottom half to top half of the cell, quantified in at least 30 cells per sample (right). Bars represent mean ± SEM (control n = 6, patient n = 3). Data represent at least three repeat experiments. Statistical analyses for (A), (C), and (E) were performed using a t-test without assuming equal variance. [P ≤ 0.05, **P ≤ 0.01, ***P ≤ 0.001.]
Figure 3.
Figure 3.. HEM1 loss causes immunodeficiency by abnormal immune cell behavior and activation.
(A) Single frame from movie S4 showing healthy control (Ctrl) or Pt 1.1 neutrophils migrating in a gradient (bottom = greatest concentration) of N-formyl-L-methionyl-L-leucyl-L-phenylalanine (fMLF). Scale bar: 20 μm. (B) Displacement velocity (top) and net directed distance (Dist.)(bottom) in arbitrary units (A.U.) of ten randomly selected Ctrl or Pt 1.1 neutrophils migrating in chemoattractant gradients. (C) Percentage of NK cells in four peripheral blood samples. (D) Photomicrographs of immunological synapses between K562 target cells (orange outline) and NK cells (white outline) stained with phalloidin for F-actin and WAVE2 antibody. White box: area of synapse. Scale bar: 5 μm. (E) CD69 and CD25 upregulation on Ctrl or Pt 1.1 naïve CD4+ T cells after stimulation with immobilized anti-CD3/28 (1 μg/ml each). (F) Cell Trace Violet (CTV) proliferation plots of cells as in (E) stimulated for 5 days. (G) IL-2 and TNF secretion by CD4+ or CD8+ T cell blasts after restimulation for 36 hours with immobilized anti-CD3/28 and ICAM-1 (1 μg/ml each) in three independent experiments. (H) CTV plots of naive CD4+ T cells transduced with empty vector (EV) or small hairpin RNA against HEM1 (sh-HEM1) stimulated on immobilized ICAM-1/anti-CD28 (1 μg/ml each) and the indicated dose of anti-CD3. (I) IL-2 and TNF secretion by CD4+ T cell blasts transduced with empty vector (EV) or shRNAs targeting HEM1 (sh-HEM1–1 and sh-HEM1–2) and stimulated as in (H). Neutrophil migration was analyzed for two independent donors, otherwise data represent at least four independent trials of each assay. Statistical analyses for (B), (C), and (G) was performed using a t-test without assuming equal variance. Statistical analysis for (I) was performed using a Wilcoxon matched-pairs signed-rank test. [*P ≤ 0.05, **P ≤ 0.01, ***P ≤ 0.001.]
Figure 4.
Figure 4.. HEM1 associates with RICTOR and governs mTORC2 activation
(A) Phospho-flow cytometry of purified CD4+ T cell blasts from control (ctrl) or patient (Pt) (top row) or empty vector (EV) transduced or sh-HEM1 knockdown cells (bottom row) for AKT phosphorylated on Ser473 (pAKT S473). Cells were stimulated for 10 min with anti-CD28/ICOS (1 μg/ml each) and the indicated dose of anti-CD3. (B) Mean fluorescence intensity (MFI) of pAKT S473 or AKT pAKT T308 in EV or sh-HEM1 CD4+ T cell blasts stimulated as in (A) in 6 independent experiments. US: unstimulated; ns: not significant. (C) Immunoblot of Ctrl or Pt CD4 T cell blasts, or healthy CD4 T cell blasts cells transduced with the empty vector (EV) or shRNA directed against HEM1 (sh-HEM1). Cells were rested and restimulated with ICAM-1/anti-CD28 (1 μg/ml each) and the indicated dose of anti-CD3. (D) Flag and RICTOR IP from 293T cells transduced with myc-RICTOR and either Flag-tagged GFP or Flag-tagged HEM1 (WT or mutant) and blotted. (E) Cell Trace Violet (CTV) proliferation plots of naïve CD4+ T cells transduced with empty vector (EV) or shRNA directed against RICTOR (sh-RIC). (F) Cytokine secretion by control and RICTOR knockdown (sh-RIC) CD4+ T cell blasts following 18-hour restimulation in five independent experiments. (G) Provisional model of HEM1 independently regulating WRC- and mTORC2-mediated functions. Statistical analyses for (B) and (F) were performed using a Wilcoxon matched-pairs signed-rank test. [*P ≤ 0.05, **P ≤ 0.01, ***P ≤ 0.001.]

References

    1. Cunningham-Rundles C, Ponda PP, Molecular defects in T- and B-cell primary immunodeficiency diseases. Nat Rev Immunol 5, 880–892 (2005). - PubMed
    1. Saxton RA, Sabatini DM, mTOR Signaling in Growth, Metabolism, and Disease. Cell 169, 361–371 (2017). - PubMed
    1. Guertin DA et al., Ablation in mice of the mTORC components raptor, rictor, or mLST8 reveals that mTORC2 is required for signaling to Akt-FOXO and PKCalpha, but not S6K1. Dev Cell 11, 859–871 (2006). - PubMed
    1. Lee K et al., Mammalian target of rapamycin protein complex 2 regulates differentiation of Th1 and Th2 cell subsets via distinct signaling pathways. Immunity 32, 743–753 (2010). - PMC - PubMed
    1. Van de Velde LA, Murray PJ, Proliferating Helper T Cells Require Rictor/mTORC2 Complex to Integrate Signals from Limiting Environmental Amino Acids. J Biol Chem 291, 25815–25822 (2016). - PMC - PubMed

Publication types

MeSH terms