. 2020 Jul 9;11(1):3427.
doi: 10.1038/s41467-020-17242-0.

LDHA-mediated ROS generation in chondrocytes is a potential therapeutic target for osteoarthritis

Affiliations

LDHA-mediated ROS generation in chondrocytes is a potential therapeutic target for osteoarthritis

Manoj Arra et al. Nat Commun. .

Abstract

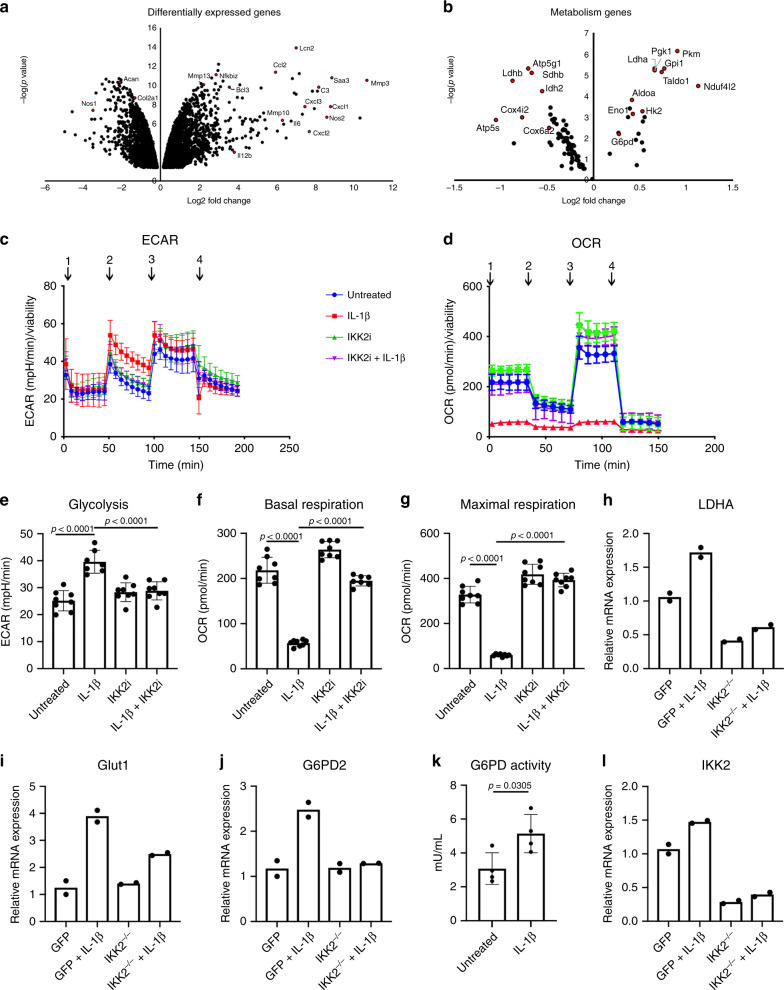
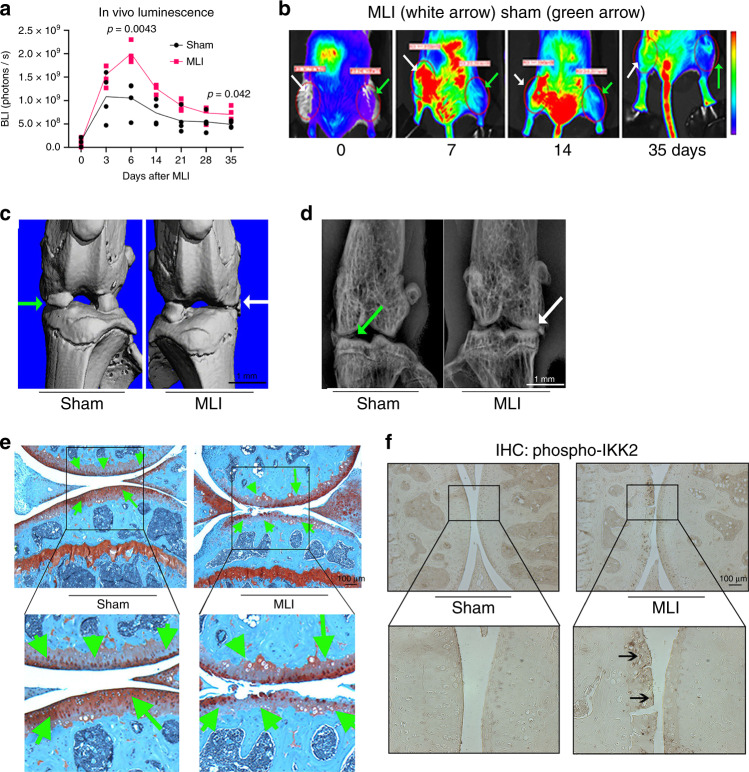
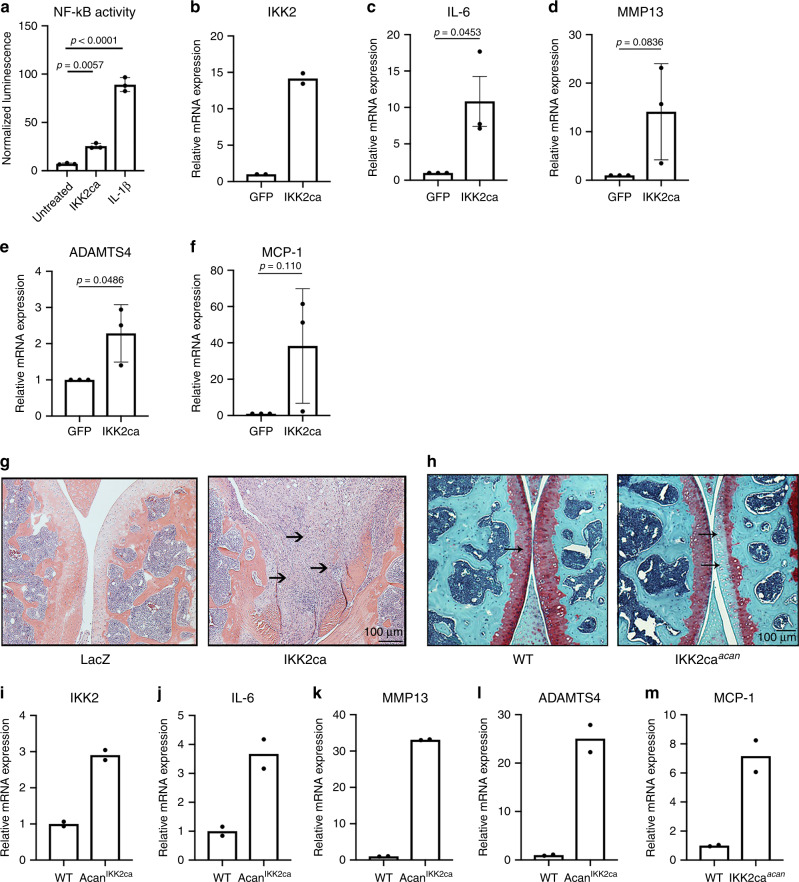
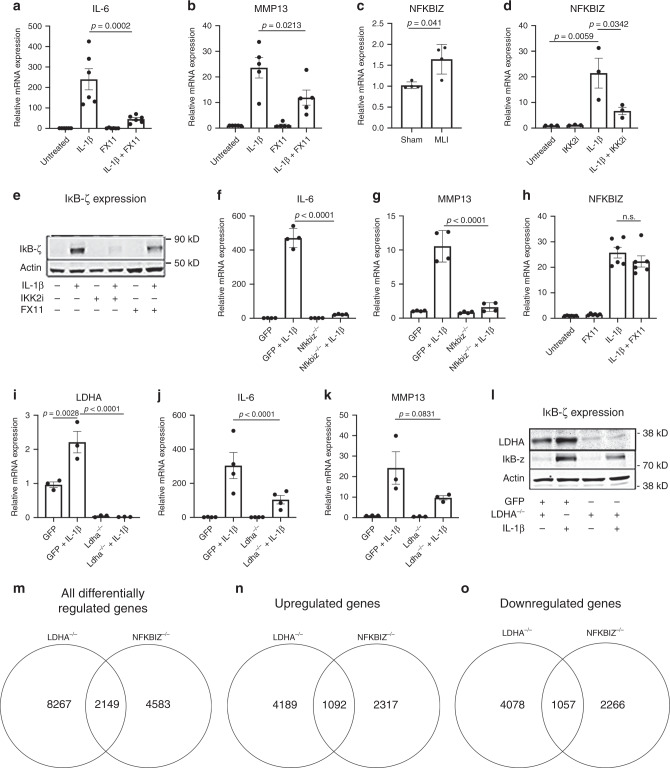
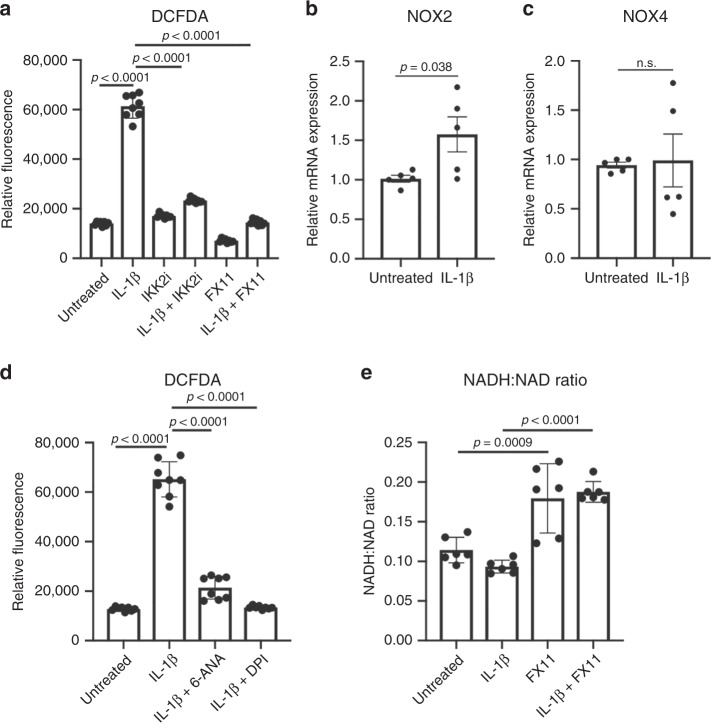
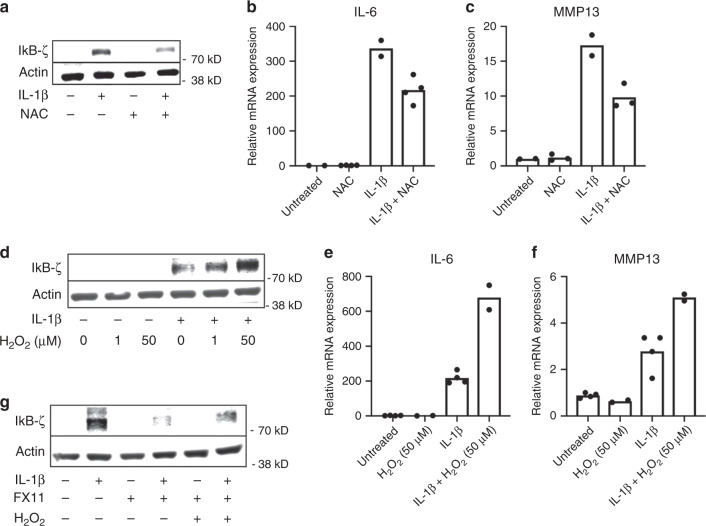
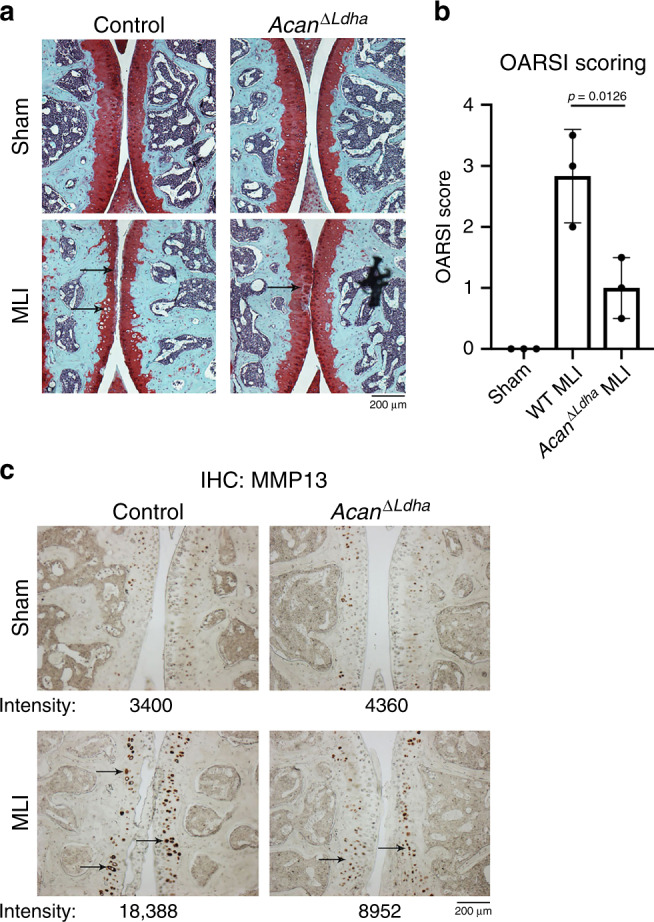
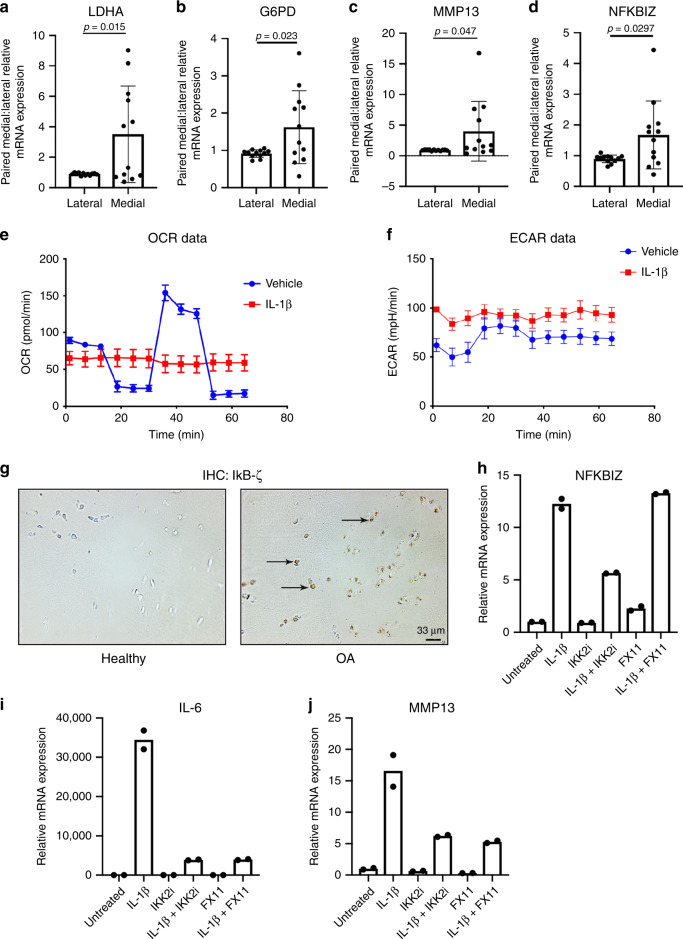
The contribution of inflammation to the chronic joint disease osteoarthritis (OA) is unclear, and this lack of clarity is detrimental to efforts to identify therapeutic targets. Here we show that chondrocytes under inflammatory conditions undergo a metabolic shift that is regulated by NF-κB activation, leading to reprogramming of cell metabolism towards glycolysis and lactate dehydrogenase A (LDHA). Inflammation and metabolism can reciprocally modulate each other to regulate cartilage degradation. LDHA binds to NADH and promotes reactive oxygen species (ROS) to induce catabolic changes through stabilization of IκB-ζ, a critical pro-inflammatory mediator in chondrocytes. IκB-ζ is regulated bi-modally at the stages of transcription and protein degradation. Overall, this work highlights the function of NF-κB activity in the OA joint as well as a ROS promoting function for LDHA and identifies LDHA as a potential therapeutic target for OA treatment.


Conflict of interest statement

The authors declare no competing interests.

Figures

Fig. 1
Fig. 1. Inflammation promotes aerobic glycolysis in chondrocytes.
RNA sequencing was performed on primary chondrocytes treated with IL-1β for 24 h and compared to untreated chondrocytes. Volcano plots were generated representing catabolic and anabolic genes (a) and metabolic genes (b). (c, d) Primary sternal chondrocytes were treated with IL-1β (10 ng/mL) in the presence or absence of IKK2i (10 μM) for 72 h prior to performing seahorse assay. All values were normalized to cell viability of treatments relative to untreated cells as measured by MTT assay. c ECAR measurement in glycolysis stress test (Injection 1: No treatment, Injection 2: Glucose, Injection 3: Oligomycin, Injection 4: 2-DG) or d OCR measurement in MitoStress test (Injection 1: No treatment, Injection 2: Oligomycin, Injection 3: FCCP, Injection 4: Antimycin A/Rotenone) was performed on Seahorse Instrument. Measurements were performed every 5 min with per timepoint for each condition. Graphs shown in c, d are mean ± S.D. for 8 wells, representative of one of three independent experiments. (Untreated = Blue, IL-1β = Red, IKK2i = Green, IKK2i + IL-1β = Purple). e Quantification of glycolysis from one timepoint in Glycolysis Stress Test or fg quantification of basal respiration and maximal respiration for one timepoint each from MitoStress test (mean ± S.D. for n = 8 wells). eg One-way ANOVA was performed followed by Tukey’s Multiple Comparison’s test, with p-values indicated in figure. hj IKK2f/f chondrocytes were infected with adenoviral-GFP, or adenoviral-cre (labeled IKK2−/−), then treated with IL-1β (10 ng/mL) for 24 h. qPCR as performed for LDHA, GLUT1, and G6PD2. Data shown is representative of one experiment out of three, with bars representing mean of duplicates. k G6PD activity was measured in primary chondrocytes treated with IL-1β (10 ng/mL) for 24 h compared to untreated cells. Bars are mean ± S.D. for n = 4 biological replicates. Two-tailed unpaired Student’s t-test was utilized for statistical analysis. l Deletion of IKK2 under the conditions described for panels hj was confirmed by performing qPCR for IKK2, with bars representing mean of duplicates.
Fig. 2
Fig. 2. NF-κB is activated in chondrocytes of PTOA knee joints.
MLI surgery was performed in 12-week-old NF-κB-luciferase reporter mice. Right knee joints were operated for MLI surgery and left knee joints were used for sham surgeries (n = 4 each group). a Bioluminescence imaging after MLI and sham surgery showed increased NF-κB activation in the MLI surgery joint (right leg) compared to sham-operated knee joint in the same animals over 5 weeks. Graphs display mean ± S.D for n = 4 mice per side. Two-tailed student’s t-tests were performed at each timepoint comparing the two groups with p-values indicated in figure. b Representative images of bioluminescence imaging from the same mouse at various times after surgery. c Representative μCT image and d X-ray image from one mouse showed joint damage, loss of synovial space and osteophyte formation in MLI surgery operated knee joint (white arrow). e Representative image of safranin-O staining of knee joints from same mouse shows loss of articular cartilage and proteoglycans after 8 weeks of MLI surgery compared to sham surgery. f Representative image from one mouse of IHC staining for p-IKK2 (arrows) in knee joints upon MLI surgery compared to sham surgery. ef Scale bar = 100 μm.
Fig. 3
Fig. 3. NF-κB activation in chondrocytes promotes catabolic changes.
a Primary chondrocytes isolated from RelA-Luc reporter mice were either treated with IL-1β (10 ng/mL) for 24 h or transduced with pMX-IKK2ca followed by luciferase assay, displaying NF-κB activation, normalized to protein levels. Bar graphs display mean ± S.D. of n = 3 wells. Data is representative of one of three independent experiments. bf Primary chondrocyte isolated from wild-type mice were transduced with pMX-GFP or pMX-IKK2ca and cultured for 24 h. qPCR was performed to measure gene expression. Bars represent mean ± S.E.M. for n = 3 independent experiments. Two-tailed Student’s t-test was utilized for statistical analysis, with p-values displayed in figure. g Six-week-old C57BL/6 mice were injected with Adeno-LacZ (left knee joint) and adeno-IKK2ca (right knee joint) (n = 5 males). Animals were sacrificed after 10 days of injection and knee joints were isolated for analysis. Representative image from one mouse of H&E staining of Ad-LacZ and Ad-IKK2ca injected joints reflects changes seen in all mice. h 12-week-old Agn1CreERT2, IKK2caki/ki (IKK2caacan) and littermate controls animals (n = 6) mice were fed with tamoxifen diet (0.4 g/kg diet) for 2 months. At the end of the experiment, animals were sacrificed and knee joint tissue were harvested for further analysis. Representative image of Safranin-O staining from one mouse shows loss of articular cartilage and proteoglycans in IKK2caacan mice compared to littermate controls. im Gene expression measurement from mRNA isolated from pooled articular cartilage of IKK2caacan mice (n = 3) compared to control mice (n = 3), due to small size of tissue sample. Representative data from one experiment out of two, with bars representing mean of technical duplicates.
Fig. 4
Fig. 4. LDHA regulates catabolic gene expression and IκB-ζ protein levels.
a, b Primary chondrocytes were treated with IL-1β (10 ng/mL) and/or FX11 (40 μM) for 24 h. Bar graphs represent qPCR data for IL-6 and MMP13 expression with error bars representing mean ± S.E.M. of n = 5 experiments. c Articular cartilage was isolated from knee joints of mice 4 weeks after undergoing sham or MLI surgery. Gene expression of Nfkbiz was measured by qPCR, with bars representing mean ± S.D. from n = 4 mice. Two-tailed student’s t-test was performed. d Primary chondrocytes were treated with IL-1β and/or IKK2i (10 μM) for 24 h. Gene expression of Nfkbiz was measured by qPCR. Bars represent mean ± S.E.M. from n = 3 independent experiments. e Representative immunoblot for IκB-ζ from chondrocytes treated with IL-1β and/or IKK2i (10 μM) or FX11 (40 μM) for 24 h. fg Primary Nfkbizf/f chondrocytes were infected with adeno-GFP or adeno-cre (labeled Nfkbiz−/−), then treated with IL-1β (10 ng/mL) for 24 h. Gene expression of IL-6 and MMP13 was measured, with bars representing mean ± S.D. for n = 4 replicates per group, representative of one of three independent experiments. h Primary chondrocytes were treated with IL-1β and/or FX11 (40 μM) for 24 h. Gene expression of Nfkbiz was measured. Bars represent mean ± S.E.M. for n = 6 independent experiments. ik Primary LDHAf/f chondrocytes were infected with adeno-GFP or adeno-cre (labeled LDHA−/−), then treated with IL-1β (10 ng/mL) for 24 h. Gene expression of LDHA, IL-6, and MMP13 was measured. Bars represent mean ± S.E.M. from n = 3 independent experiments for LDHA and MMP13, n = 4 for IL-6. l Representative image of immunoblotting performed for LDHA and IκB-ζ under the same conditions. mo WT, LDHA−/−, and NFKBIZ−/− chondrocytes were cultured with IL-1β treatment for 24 h and RNA sequencing was performed to compare gene expression to control chondrocytes. m The number of common, significantly regulated genes in both sets was counted. n The common genes significantly upregulated in both sets was counted. o The common genes significantly downregulated in both sets were counted. ab, d, fk One-way ANOVA followed by Tukey’s multiple comparison’s test was performed. p-values displayed in figure.
Fig. 5
Fig. 5. LDHA interaction with NADH propagates ROS.
a Primary chondrocytes were treated with IL-1β (10 ng/mL) in the presence or absence of IKK2i (10 μM) or FX11 (40 μM) for 24 h. DCFDA assay was performed and fluorescence was measured by microplate reader to determine intracellular ROS levels, displaying reduction in ROS levels. Results are representative of one experiment out of three, with bars representing mean ± S.D. for n = 8 wells. b, c Primary chondrocytes were treated with IL-1β (10 ng/mL) for 24 h. qPCR was performed to measure gene expression of NOX2 and NOX4. Bars represent mean ±  S.E.M. for n = 5 independent experiments. d Primary chondrocytes were treated with IL-1β (10 ng/mL) in the presence or absence of 6-ANA (100 μM) or DPI (1 μM) for 24 h. DCFDA assay was performed and fluorescence was measured by microplate reader to determine intracellular ROS levels, displaying reduction in ROS levels. Results are representative of one of three independent experiments, with bars representing mean ± S.D. for n = 8 wells. e Chondrocytes were treated with IL-1β (10 ng/mL) for 36 h in the presence of absence of FX11 (40 μM). NAD+ and NADH levels were measured in chondrocytes to calculate the NADH:NAD+ ratio in biological replicates. Data are pooled from three experiments for n = 6 biological replicates, with error bars representing mean ± S.D. a, d, e One-way ANOVA was performed followed by Tukey’s multiple comparison’s test. b, c Two-tailed student’s t-test was performed. p-values displayed in figure.
Fig. 6
Fig. 6. ROS regulates stability of IκB-ζ protein.
a Chondrocytes were co-treated with IL-1β (10 ng/mL) and N-acetylcysteine (3 mM) for 24 h. Western blotting was performed for IκB-ζ. b, c Gene expression analysis for IL-6 and MMP13 was performed by qPCR. Results are representative of two out of three independent experiments, due to large biological variation in third experiment with similar trends. Bars represent mean of n = 2 independent experiments. d Chondrocytes were treated with increasing concentrations of Hydrogen peroxide in the presence or absence of IL-1β for 24 h. Western blotting was performed for IκB-ζ. Image representative of one of three experiments. e, f Gene expression of IL-6 and MMP13 was measured by qPCR. Results are representative of one experiment out of three displaying similar trends but with large biological variations in gene expression. Bars represent mean of technical replicates from one experiment. g Chondrocytes were then treated with FX11 (40 μM) in the presence or absence of H2O2 (50 μM) and IL-1β (10 ng/mL) for 24 h. Western blotting was performed for IκB-ζ. Image representative of one of two experiments.
Fig. 7
Fig. 7. Deletion of LDHA in chondrocytes in vivo is protective against OA.
a MLI surgery was performed on 10-week-old AcanΔ/Ldha male mice placed on tamoxifen diet to induce recombination. Sham surgery was performed on contralateral leg and used as control. 10 weeks post surgery mice were sacrificed and joints were collected for histology. Safranin-O staining was performed of the MLI and sham joints. b OARSI scoring of two safranin-O stained sections per mouse were averaged (n = 3 mice for control, n = 3 mice for AcanΔ/Ldha). Bars represents mean ± S.D. from one experiment out of two comparing littermates. One-way ANOVA followed by Tukey’s test multiple comparisons test was utilized for statistical analysis. c IHC was performed for MMP13, with arrows pointing to examples of stained chondrocytes. Representative images are displayed with pixel intensity of stain quantified under each image. a, c Scale bar = 200 μm.
Fig. 8
Fig. 8. LDHA inhibition is efficacious in human articular chondrocytes.
Medial and lateral cartilage samples were obtained from knee articular cartilage of patients undergoing TKA (n = 12). Medial regions of articular cartilage were more severely damaged upon radiographic and visual analysis by surgeon, while lateral regions were healthier regions of cartilage with little signs of OA. ad LDHA, G6PD2, MMP13, and NFKBIZ gene expression was measured in OA cartilage by qPCR. Gene expression was normalized to actin. Gene expression is displayed as fold change in medial cartilage sample relative to paired lateral cartilage sample. Bars represent mean ± S.D. for n = 12 patient samples. e, f Primary human knee articular chondrocytes were treated with IL-1β (10 ng/mL) for 24 h. Seahorse was performed to measure ECAR and OCR as previously stated. Bars represent mean ± S.D. for five wells. Data is representative of one out of two experiments. g IHC was performed for IκB-ζ in healthy and OA human cartilage (arrows). Representative images of n = 3 samples are displayed. hj Chondrocytes were isolated from human knee articular cartilage. Cells were treated with IL-1β (10 ng/mL) for 24 h in the presence or absence of IKK2i (10 μM) or FX11 (40 μM). Gene expression of NFKBIZ, IL-6, and MMP13 was measured by qPCR, with bars representing mean of technical duplicates. Results are representative of one out of two independent experiments with similar trends. ad Two-tailed student’s t-test was performed. p-values indicated in figure.

References

    1. Neogi T. The epidemiology and impact of pain in osteoarthritis. Osteoarthr. Cartil. 2013;21:1145–−1153. - PMC - PubMed
    1. Vina ER, Kwoh CK. Epidemiology of osteoarthritis: literature update. Curr. Opin. Rheumatol. 2018;30:160–167. - PMC - PubMed
    1. Thomas AC, Hubbard-Turner T, Wikstrom EA, Palmieri-Smith RM. Epidemiology of posttraumatic osteoarthritis. J. Athl. Train. 2017;52:491–496. - PMC - PubMed
    1. Johnson VL, Hunter DJ. The epidemiology of osteoarthritis. Best. Pr. Res. Clin. Rheumatol. 2014;28:5–15. - PubMed
    1. Blasioli DJ, Kaplan DL. The roles of catabolic factors in the development of osteoarthritis. Tissue Eng. Part B Rev. 2014;20:355–−363. - PMC - PubMed

Publication types

MeSH terms

LinkOut - more resources