. 2020 Jul 9;10(1):11314.
doi: 10.1038/s41598-020-68191-z.

Visualization of cytoplasmic organelles via in-resin CLEM using an osmium-resistant far-red protein

Affiliations

Visualization of cytoplasmic organelles via in-resin CLEM using an osmium-resistant far-red protein

Isei Tanida et al. Sci Rep. .

Abstract

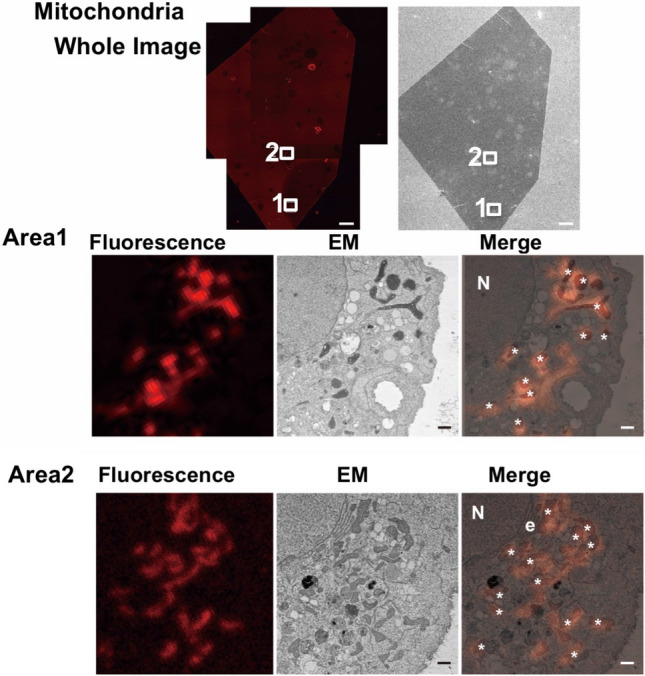
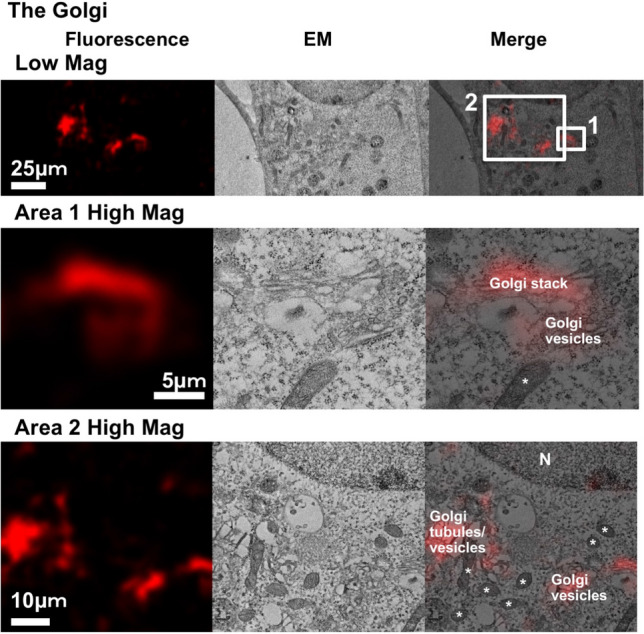
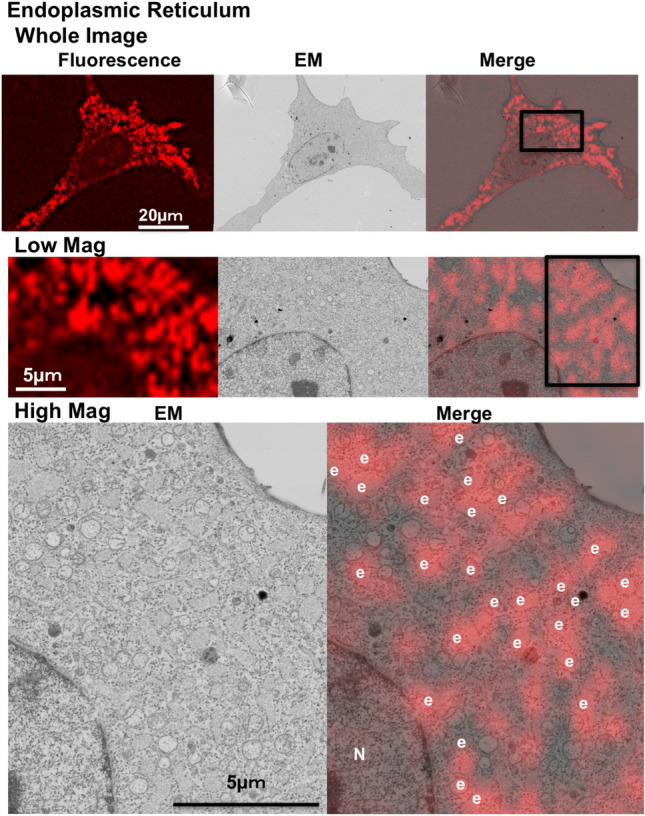
Post-fixation with osmium tetroxide staining and the embedding of Epon are robust and essential treatments that are used to preserve and visualize intracellular membranous structures during electron microscopic analyses. These treatments, however, can significantly diminish the fluorescent intensity of most fluorescent proteins in cells, which creates an obstacle for the in-resin correlative light-electron microscopy (CLEM) of Epon-embedded cells. In this study, we used a far-red fluorescent protein that retains fluorescence after osmium staining and Epon embedding to perform an in-resin CLEM of Epon-embedded samples. The fluorescence of this protein was detected in 100 nm thin sections of the cells in Epon-embedded samples after fixation with 2.5% glutaraldehyde and post-fixation with 1% osmium tetroxide. We performed in-resin CLEM of the mitochondria in Epon-embedded cells using a mitochondria-localized fluorescent protein. Using this protein, we achieved in-resin CLEM of the Golgi apparatus and the endoplasmic reticulum in thin sections of the cells in Epon-embedded samples. To our knowledge, this is the first reported use of a far-red fluorescent protein retains its fluorescence after osmium staining and Epon-embedding, and it represents the first achievement of in-resin CLEM of both the Golgi apparatus and the endoplasmic reticulum in Epon-embedded samples.


Conflict of interest statement

The authors declare no competing interests.

Figures

Figure 1
Figure 1
A far-red protein, mKate2, is suitable for in-resin CLEM of osmium-treated and Epon-embedded cells. (A) Fluorescence of mKate2 in HeLa cells after chemical fixations of glutaraldehyde and osmium tetroxide. HeLa cells expressing mKate2 (1, live image) (signal-to-noise ratio (mean ± SD) = 28.25 ± 3.18 dB; signal-to-background ratio = 8.14 ± 0.74) were pre-fixed with 2.5% glutaraldehyde (2, GA) (signal-to-noise ratio = 30.82 ± 1.96 dB; signal-to-background ratio = 8.07 ± 3.33), and post-fixed with osmium tetroxide (3, GA + OsO4) (signal-to-noise ratio = 28.81 ± 0.97 dB; signal-to-background ratio = 1.50 ± 0.17). The fluorescent images were obtained with a CKX530 cell culture microscope (Olympus) and a VisualixPro2 mertics CCD camera (KENIS) using a Texas Red filter. The fluorescent image in c was exposed about 20 times longer than those in 1 and 2. (B) Minimal levels of autofluorescence in HeLa cells after chemical fixations with glutaraldehyde and osmium tetroxide. The fluorescent images were obtained with a BZ-X710 fluorescence microscope (Keyence) using GFP, Texas Red, and DAPI filters (CCD monochrome camera, NIKON CFI60 series × 10 lens, gain + 2 dB). The signal-to-background ratios of the images from “GFP filter”, “Texas Red filter”, and “DAPI filter” are 1.29 ± 0.24, 1.12 ± 0.16, and 1.13 ± 0.18, respectively. (C) Fluorescent image of mKate2 in HeLa cells in a 100 nm thin section of Epon-embedded samples. The fluorescent image was obtained with a BZ-X710 fluorescence microscope (Keyence) using a Texas Red filter (CCD monochrome camera, NIKON CFI60 series × 10 lens, gain + 4 dB, 2 × 2 on chip binning). (D) High magnification of the area with a white square surrounding fluorescent image in C. The fluorescent image was obtained with a BZ-X710 fluorescence microscope (Keyence) using a Texas Red filter (CCD monochrome camera, NIKON CFI60 series × 40 lens, gain + 4 dB, 2 × 2 on chip binning). Scale bars, 50 µm.
Figure 2
Figure 2
In-resin CLEM of mitochondria. The “Whole Image” indicates the whole images obtained from a LSM880 confocal fluorescence microscope and from a Helios NanoLab 660 scanning electron microscope (a backscattered electron detector at a voltage of 2.0 kV with a current of 0.4 nA). Scale bars, 100 µm. The images in Areas 1 and 2 indicate a magnification of the areas (white squares 1 and 2). Scale bars, 1 µm. The “Merge” is a merged image of the fluorescence image with an electron microscopic image (EM). “N”, “e”, and asterisks in the images indicate respective nucleus, endoplasmic reticulum, and mitochondria. Settings of a LSM880 confocal fluorescence microscope are as follows; bit depth, 8 bit; scan zoom, 2 × 2; pixel time, 8.19 µs; averaging, 2; Plan-Apochromat 63x/1.4 Oil DIC M27; beam splitter, MBS:MBS 488/561/633; DBS1, mirror; lasers 561 nm: 10%; excitation 561 nm; emission, 602 nm; detection wavelength 562–642 nm; detector gain 884.0.
Figure 3
Figure 3
In-resin CLEM of the Golgi apparatus. The fluorescent image was obtained using a BZ-X710 fluorescence microscope (Teas Red filter, CCD monochrome camera, NIKON CFI60 series × 100 lens, gain + 4 dB, 2 × 2 on chip binning, haze reduction), and the electron microscopic image was obtained using a HT7700 transmission electron microscope. The “High Mag” in Areas 1 and 2 indicates a magnification of the areas surrounded by white squares 1 and 2 in the “Low Mag” areas. “N” and asterisks in the images indicate respective nucleus and mitochondria.
Figure 4
Figure 4
In-resin CLEM of the endoplasmic reticulum. The “Whole Image” indicates the whole images obtained from a BZ-X710 fluorescent microscopy and from a Helios NanoLab 660 scanning electron microscopy. The fluorescent image was obtained using a BZ-X710 fluorescence microscope (Teas Red filter, CCD monochrome camera, NIKON CFI60 series × 100 lens, gain + 4 dB, 2 × 2 on chip binning, haze reduction), and the electron microscopic image was obtained using a Helios NanoLab 660 scanning electron microscope (a backscattered electron detector at a voltage of 2.0 kV with a current of 0.4 nA). The “Low Mag” indicates a low-level magnification of the area surrounded by a white square in the “Whole Image”. “N” and “e” in the images indicate respective nucleus and endoplasmic reticulum.

References

    1. Grabenbauer M. Correlative light and electron microscopy of GFP. Methods Cell Biol. 2012;111:117–138. doi: 10.1016/b978-0-12-416026-2.00007-8. - DOI - PubMed
    1. Uchiyama Y, Koike M, Shibata M, Sasaki M. Autophagic neuron death. Methods Enzymol. 2009;453:33–51. doi: 10.1016/s0076-6879(08)04003-2. - DOI - PubMed
    1. Schermelleh L, et al. Super-resolution microscopy demystified. Nat. Cell Biol. 2019;21:72–84. doi: 10.1038/s41556-018-0251-8. - DOI - PubMed
    1. Johnson E, Kaufmann R. Correlative in-resin super-resolution fluorescence and electron microscopy of cultured cells. Methods Mol. Biol. 2017;1663:163–177. doi: 10.1007/978-1-4939-7265-4_14. - DOI - PubMed
    1. Johnson E, et al. Correlative in-resin super-resolution and electron microscopy using standard fluorescent proteins. Sci. Rep. 2015;5:9583. doi: 10.1038/srep09583. - DOI - PMC - PubMed

Publication types