. 2021 Oct;26(10):5766-5788.
doi: 10.1038/s41380-020-0806-5. Epub 2020 Jul 10.

Patient-specific Alzheimer-like pathology in trisomy 21 cerebral organoids reveals BACE2 as a gene dose-sensitive AD suppressor in human brain

Collaborators, Affiliations

Patient-specific Alzheimer-like pathology in trisomy 21 cerebral organoids reveals BACE2 as a gene dose-sensitive AD suppressor in human brain

Ivan Alić et al. Mol Psychiatry. 2021 Oct.

Erratum in

  • Correction: Patient-specific Alzheimer-like pathology in trisomy 21 cerebral organoids reveals BACE2 as a gene dose-sensitive AD suppressor in human brain.
    Alić I, Goh PA, Murray A, Portelius E, Gkanatsiou E, Gough G, Mok KY, Koschut D, Brunmeir R, Yeap YJ, O'Brien NL, Groet J, Shao X, Havlicek S, Dunn NR, Kvartsberg H, Brinkmalm G, Hithersay R, Startin C, Hamburg S, Phillips M, Pervushin K, Turmaine M, Wallon D, Rovelet-Lecrux A, Soininen H, Volpi E, Martin JE, Foo JN, Becker DL, Rostagno A, Ghiso J, Krsnik Ž, Šimić G, Kostović I, Mitrečić D; LonDownS Consortium; Francis PT, Blennow K, Strydom A, Hardy J, Zetterberg H, Nižetić D. Alić I, et al. Mol Psychiatry. 2021 Oct;26(10):5789. doi: 10.1038/s41380-021-01206-x. Mol Psychiatry. 2021. PMID: 34272490 Free PMC article. No abstract available.

Abstract

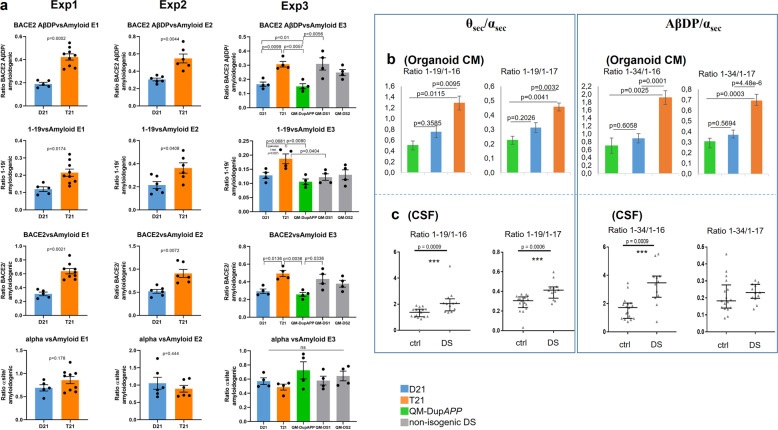
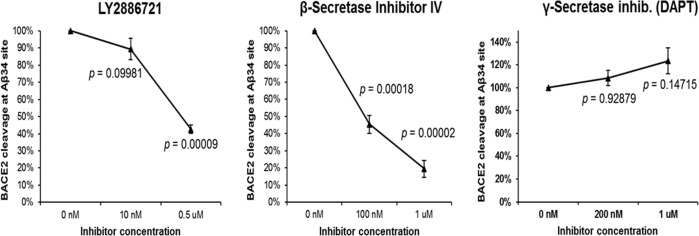
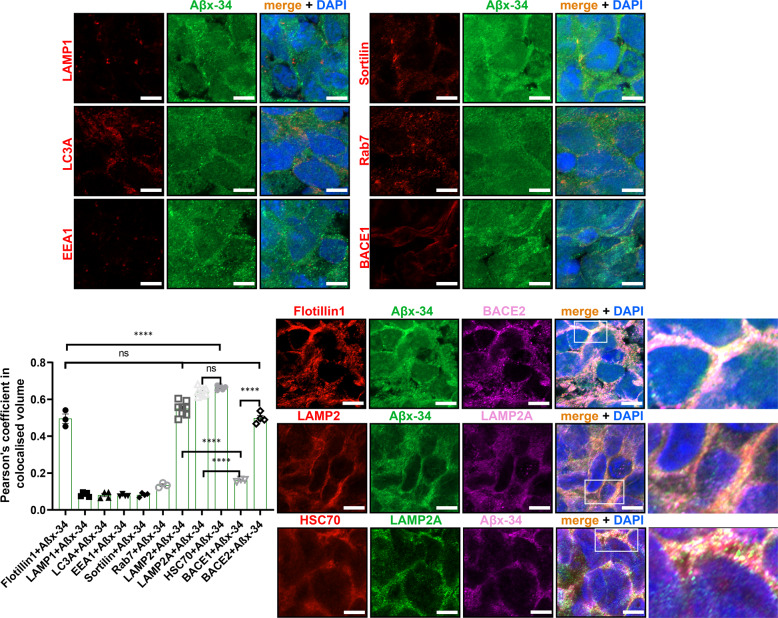
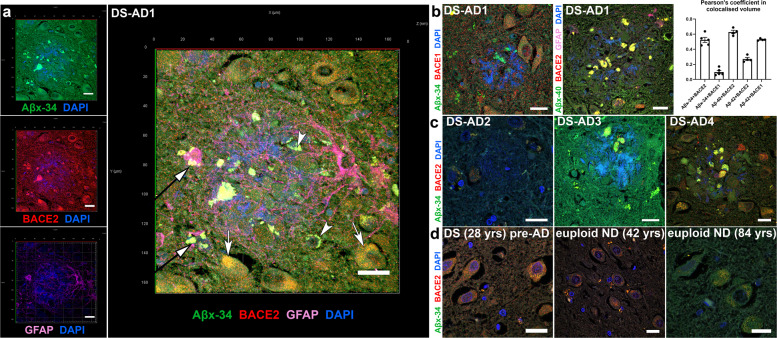
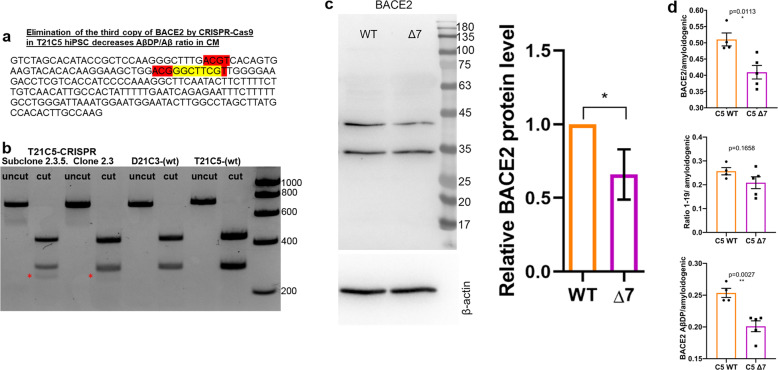
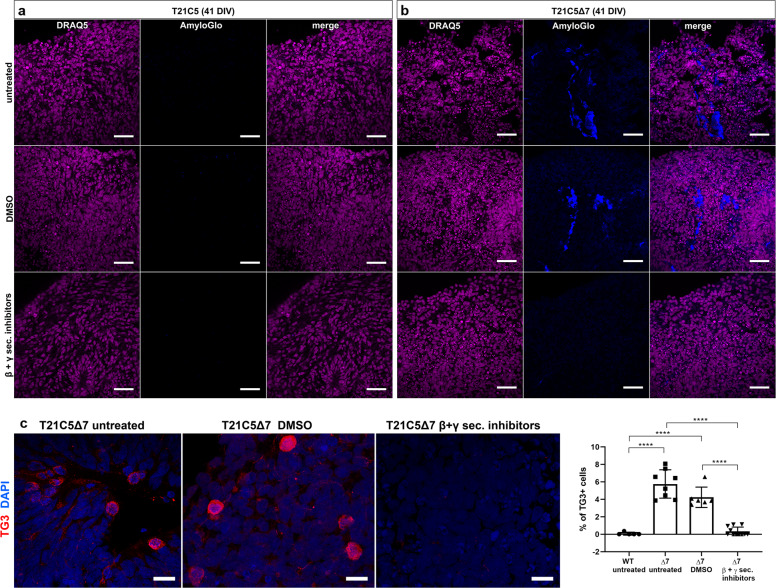
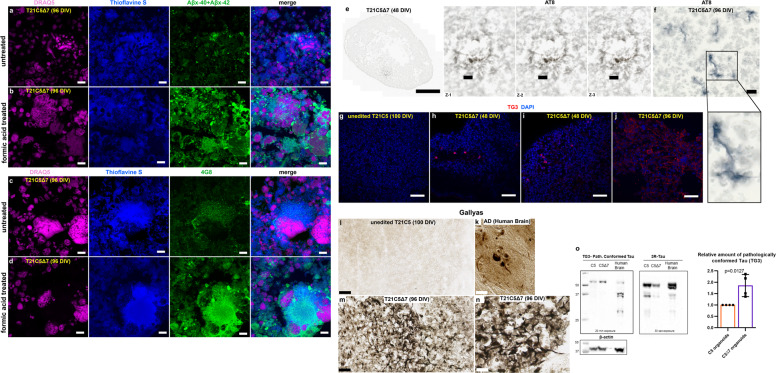
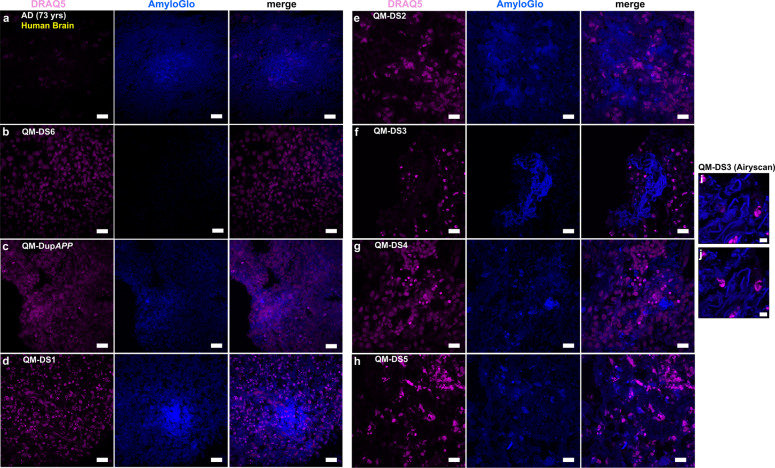
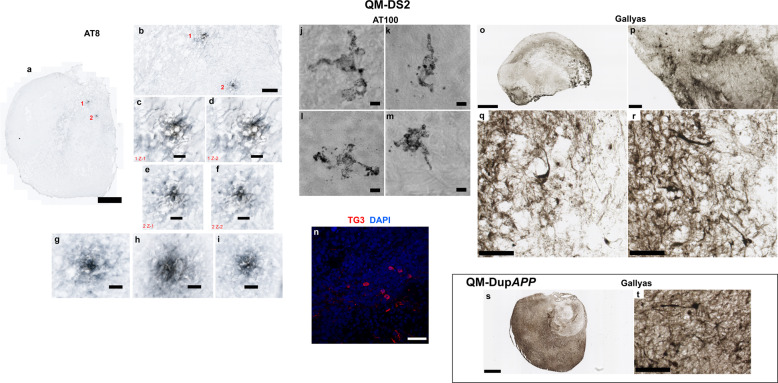
A population of more than six million people worldwide at high risk of Alzheimer's disease (AD) are those with Down Syndrome (DS, caused by trisomy 21 (T21)), 70% of whom develop dementia during lifetime, caused by an extra copy of β-amyloid-(Aβ)-precursor-protein gene. We report AD-like pathology in cerebral organoids grown in vitro from non-invasively sampled strands of hair from 71% of DS donors. The pathology consisted of extracellular diffuse and fibrillar Aβ deposits, hyperphosphorylated/pathologically conformed Tau, and premature neuronal loss. Presence/absence of AD-like pathology was donor-specific (reproducible between individual organoids/iPSC lines/experiments). Pathology could be triggered in pathology-negative T21 organoids by CRISPR/Cas9-mediated elimination of the third copy of chromosome 21 gene BACE2, but prevented by combined chemical β and γ-secretase inhibition. We found that T21 organoids secrete increased proportions of Aβ-preventing (Aβ1-19) and Aβ-degradation products (Aβ1-20 and Aβ1-34). We show these profiles mirror in cerebrospinal fluid of people with DS. We demonstrate that this protective mechanism is mediated by BACE2-trisomy and cross-inhibited by clinically trialled BACE1 inhibitors. Combined, our data prove the physiological role of BACE2 as a dose-sensitive AD-suppressor gene, potentially explaining the dementia delay in ~30% of people with DS. We also show that DS cerebral organoids could be explored as pre-morbid AD-risk population detector and a system for hypothesis-free drug screens as well as identification of natural suppressor genes for neurodegenerative diseases.


Conflict of interest statement

HZ has served at scientific advisory boards for CogRx, Roche Diagnostics, Samumed, and Wave and is a co-founder of Brain Biomarker Solutions in Gothenburg AB, a GU Ventures-based platform company at the University of Gothenburg (all unrelated to the submitted work). JEM chairs the MNDA Research Advisory Board and is a director of Biomoti, a cancer drug-delivery company.

Figures

Fig. 1
Fig. 1. Aβ peptide profiles secreted by trisomy 21 cerebral organoids.
a Using Aβ IP-MS spectra from organoid (see Supplementary Figs. 1, 2, 4) conditioned media (CM), ratios were calculated of areas under the peak between the non-amyloidogenic and amyloidogenic peptides within a single mass-spectrogram. IP-MS spectra were produced for three timepoints (four timepoints in exp3) for each iPSC-derived organoid line, in each of three independent experiments (each experiment starting at the point of undifferentiated iPSC). The team performing the IP-MS analysis was blinded to the genotypes in all experiments. BACE2-AβDP (clearance) products = [1–20 & 1–34], total BACE2 = [1–19 & 1–20 & 1–34], amyloidogenic peptides = [1–38 & 1–39 & 1–40 & 1–42], α-site products = [1–16 & 1–17]. Exp1 and Exp2 p values: Holm–Bonferroni sequential corrections (α = 0.05) of two-tailed student t test comparisons. Exp3: Holm-corrected p values after one-way ANOVA. Error bars: standard error. Combined data for the isogenic iPSC lines for all three experiments passed the Holm–Bonferroni correction (α = 0.05) of sequential two-tailed student t test comparisons of each peptide ratio shown in Fig. 1a (available on request). T21 and D21: isogenic iPCS derived from a single mosaic individual with DS published previously (Murray A et al. 2015), QM-DS1 and QM-DS2: unrelated DS iPSC, DupAPP: FEOAD iPSC. b All three experiments in Fig. 1a were combined to calculate the ratios of BACE2-related non-amyloidogenic peptides (1–19 or 1–34) to BACE2-unrelated non-amyloidogenic peptides (1–16 or 1–17) in organoid CM. Holm-corrected p values after one-way ANOVA are shown. Error bars: standard error. c Same ratios as in part ‘a’ were calculated on IP-MS spectra obtained from cerebrospinal fluid samples of people with DS (n = 17) and age-matched normal controls (n = 12). Data are presented as mean ±1SD.
Fig. 2
Fig. 2. FRET-based assay for BACE2 cleavage.
A newly custom designed FRET reagent (spanning the Aβ34 site) was digested at pH=3.5 by the human BACE2 in presence or absence of the stated inhibitors for 2 h. Enzyme activity was defined by measuring the fluorescence increase before and after the incubation. Blank-subtracted fluorescence units were normalized to the control digest and a one-way ANOVA was performed. P values were calculated with a post hoc Bonferroni multiple comparison (only pairs relative to the untreated control simultaneously compared). Error bars: standard error. n = 3 replicates per inhibitor per concentration.
Fig. 3
Fig. 3. Subcellular compartment localisation of Aβ degradation product Aβx-34 in hiPSC-derived cerebral organoid sections.
Pairwise Pearson’s coefficient of colocalisation for a pair of co-stained antibodies: Aβx-34, and a specific marker for the subcellular vesicle compartment: lipid rafts (Flotillin1), lysosomes (LAMP1), macro-autophagosomes (LC3A), early endosomes (EEA1), macro-autophagosome-lysosome fusion/exosomes (Sortilin), late endosomes (Rab7), specific sub-sets of lysosomes (LAMP2, LAMP2A) and CMA-chaperone (HSC70). In the final two columns of the histogram, the Pearson’s colocalisation level was shown between Aβx-34 and BACE1 or BACE2, respectively (repeated in more detail in Supplementary Fig. 7). Greater than 95% of cells in all of these images were MAP2+ neurons (not shown). Representative images of the organoid stainings from which the coefficients were calculated are shown in the panels. Last column in the bottom right panel is the zoomed-in inset from the previous column. Images were captured using AiryScan Zeiss confocal microscopy, and single 0.16 μm slices are shown (from 20 μm full z-stack analysed). Error bars: standard error, p values: after standard one-way ANOVA using post hoc Bonferroni multiple comparison calculation. Scale bar: 5 μm.
Fig. 4
Fig. 4. Localisation of AβDP degradation products and Aβ peptides with BACE2 in hippocampal sections of the human post-mortem brain.
a Immunofluorescence analysis of the brain of DS-AD-1 co-stained for Aβx-34, BACE2, and GFAP. A typical near-circular neuritic plaque is shown (in which DAPI faintly stains the fibrillar amyloid deposits). Arrows indicate three categories of objects in which the colocalisation of BACE2 and the AβDP product Aβx-34 is observed. White arrows: intraneuronal fine-vesicular pattern; white arrowheads: large intraneuronal spherical granules (lipofuscin); black arrows with white arrowheads: amorphous extracellular aggregates. See Methods and Supplementary Fig. 8 for experiments controlling the extent of lipofuscin autofluorescence effects. b DS-AD1 brain co-stained for Aβx-34 and BACE1, or Aβx-40, BACE2 and GFAP, and Pearson’s coefficient of colocalisation for proteins stained in parts ‘a’ and ‘b’, with the addition of the staining for Aβx-42 neo-epitope (not shown). Error bars: SEM. c Same IF staining combinations as in part ‘a’ (except for GFAP) were used in three additional brain samples: DS-AD-2, 3, and 4. d Brain sample co-stained for BACE2 and Aβx-34 of a 28 yrs old person with Down syndrome without dementia, and euploid non-demented (ND) controls aged 42 and 84. Scale bar: 20 μm.
Fig. 5
Fig. 5. CRISPR/SpCas9-HF1-mediated reduction of BACE2 copy number from three to two in the T21C5 hiPSC line.
a BACE2 exon3 sequence with 7 bp deletion (yellow) provoked by the CRISPR/SpCas9-HF1 is shown. Red: restriction endonuclease HpyCH4IV sites (a de novo HpyCH4IV site is generated by the 7 bp deletion). b agarose gel electrophoresis of the 733 bp PCR product containing the targeted site before (uncut) and after digestion with HpyCH4IV (cut), for the initial clone 2.5, and its colony-purified sub-clone 2.3.5 (renamed further below as “Δ7”). The 294 bp fragment in 2.3.5 is reduced to 65% of the wt value (normalized to the 439 bp band), and a de novo 255 bp fragment appears in CRISPR-targeted line (red asterisk). c Western blot stained with anti-BACE2 antibody of the lysates of the iPSC line Δ7 compared with the wt T21C5 iPSC line. Quantification of the total actin-normalised BACE2 signal showed a significant reduction in Δ7 compared with T21 unedited line. Error bars: standard error, p value: student’s t test. d BACE2-AβDP/amyloidogenic peptides ratio after IP-MS analysis of CM produced by the 48DIV organoids derived from the iPSC line Δ7 compared with the T21C5wt control were significantly decreased. Error bars: standard error, p values: two-tailed t test comparison.
Fig. 6
Fig. 6. CRISPR/SpCas9-HF1-mediated reduction of BACE2 copy number from three to two in the T21C5 hiPSC line provoked early AD-like pathology in organoids.
a–c Early AD-like pathology was provoked in 41DIV T21C5Δ7 organoids, but was not detected in T21C5 parental organoids. a–b Treatment of the T21C5Δ7 with combined βI-IV (β-sectretase inhibitor) and compound E (γ-secretase inhibitor) from 20 to 41DIV completely prevented the formation of extracellular amyloid deposits. Staining with amyloid specific dye (AmyloGlo) and nuclear dye (DRAQ5). Scale bar 50 μm. c β- and γ-secretase inhibitor treatment highly significantly reduced the presence of TG3+ (pathologically conformed Tau) cells in T21C5Δ7 organoids compared with untreated T21C5Δ7 organoids. Scale bar: 20 μm. Error bars: SD, ****p < 0.0001. Only statistically significant differences are shown.
Fig. 7
Fig. 7. Amyloid and Tau pathology are shown with six different methods in T21C5Δ7 organoids that have BACE2 copy number reduced from three to two by CRISPR/Cas9.
a–d The signal of amyloid specific antibodies Aβx-40 + Aβx-42 (a, b), or 4G8 (c, d) colocalising with Thioflavine S in T21C5Δ7 (96DIV) organoids was drastically increased upon treatment with 87% Formic acid for 10 minutes at RT, proving it contains the insoluble extracellular β-amyloid deposits. Scale bar: 10 μm. e AT8 (hyperphosphorylated Tau) positive neurites within plaque-like structure in 48DIV organoids. Left: the whole organoid slice, scale bar: 500 μm. Right: zoom in on the plaque-like structure from ‘e’, in the three individual z-slices (interval between slices, 1 μm; scale bar: 20 μm). f AT8 (hyperphosphorylated Tau) positive neurites in 96DIV organoids. Scale bar: 10 μm. gj TG3 (conformationally altered Tau) staining of unedited control T21C5 (100DIV) g, CRISPR-edited T21C5Δ7 (48DIV) with TG3-positive neurons in 48DIV organoids h, i, and CRISPR-edited T21C5Δ7 (96DIV) showing many TG3+ neurons with diffuse staining of extracellularized mal-conformed Tau aggregates j. Scale bar: 50 μm. kn Gallyas staining of human AD brain k, unedited control T21C5 (100DIV) l, CRISPR-edited T21C5Δ7 (96DIV) m, n shows negative staining in parental unedited organoid l and very strong signal in neurons and plaque-like associated neurites within T21C5Δ7 organoid m, n. Scale bars: 50 μm l, m and 20 μm n and 5 μm k. o Representative western blot of T21C5 and T21C5Δ7 organoid lysates stained using antibodies against pathologically conformationally altered Tau (TG3) or general 3 repeat (3 R) Tau. β-actin was used as a loading control. Human brain tissue of a 75 year old is shown for comparison. Comparison of the average values (n = 4) for CRISPR-edited T21C5Δ7 showed a highly significant relative increase in TG3 compared with unedited (n = 4) T21C5 organoids, as indicated in the graph, p = 0.0127.
Fig. 8
Fig. 8. Amyloid-like pathology, staining with AmyloGlo, is shown in different lines of organoids and Human AD Brain served as positive control.
a Human AD Brain (73 yrs) shows amyloid plaques in the Entorhinal cortex. b QM-DS6 (DIV100) shows no AD pathology. ch QM-DupAPP and QM-DS1, 2, 3, 4, 5 show AmyloGlo-positive aggregates, similar to human brain. Scale bar: 20 μm. i, j Airyscan analysis of QM-DS3 showing super-resolution images of AmyloGlo-positive material with fibrillar-like appearance. Scale bar: 5 μm.
Fig. 9
Fig. 9. Tau pathology, staining with Gallyas, and with three different antibodies (hyperphosphorylated, conformationally altered, and filamentous Tau) in QM-DupAPP (100DIV) and QM-DS2 (100DIV) organoids.
a Scan of whole QM-DS2 organoid section shows two hyperphosphorylated Tau foci (neuritic plaque-like structures). Scale bar: 500 μm. b Zoom in on the same foci. Scale bar: 100 μm. c, d AT8-positive neurites in the pathological structure number 1 in two individual z-slices. Scale bar: 20 μm. e, f AT8-positive neurites in the pathological structure number 2 in two individual z-slices. Scale bar: 20 μm. gi AT8-positive neurites in further three pathological foci found at a different depth, from the same organoid (not shown at lower magnification). Scale bar: 20 μm. jm AT100 (filamentous Tau) positive neurons in the cortical layer of QM-DS2 organoid, partly showing “ballooned neuron” pathology. Scale bar: 5 μm. n TG3 (conformationally altered Tau) positive cells in the cortical layer of QM-DS2 organoid. Scale bar: 50 μm. o Scan of whole QM-DS2 organoid section stained with Gallyas. Scale bar: 500 μm. pr zoom in on the parts of the same organoid shows strongly Gallyas-positive individual neurons. Scale bar: 50 μm p 20 μm q, r. s Scan of whole QM-DupAPP organoid section stained with Gallyas. Scale bar: 500 μm. t Zoom in on the same organoid shows equally strong individual neurons as in QM-DS2 organoid. Scale bar: 50 μm.

References

    1. De Strooper B, Vassar R, Golde T. The secretases: enzymes with therapeutic potential in Alzheimer disease. Nat Rev Neurol. 2010;6:99–107. - PMC - PubMed
    1. Hardy J, Selkoe DJ. The amyloid hypothesis of Alzheimer’s disease: progress and problems on the road to therapeutics. Science. 2002;297:353–6. - PubMed
    1. Masters CL, Simms G, Weinman NA, Multhaup G, McDonald BL, Beyreuther K. Amyloid plaque core protein in Alzheimer disease and Down syndrome. Proc Natl Acad Sci USA. 1985;4245–9. - PMC - PubMed
    1. Mawuenyega KG, Sigurdson W, Ovod V, Munsell L, Kasten T, Morris JC, et al. Decreased clearance of CNS beta-amyloid in Alzheimer’s disease. Science. 2010;330:1774. - PMC - PubMed
    1. Scheltens P, Blennow K, Breteler MM, de Strooper B, Frisoni GB, Salloway S, et al. Alzheimer’s disease. Lancet. 2016;388:505–17. - PubMed

Publication types

MeSH terms

Substances