. 2020 Jul 9;10(1):11389.
doi: 10.1038/s41598-020-68379-3.

Impaired iloprost-induced platelet inhibition and phosphoproteome changes in patients with confirmed pseudohypoparathyroidism type Ia, linked to genetic mutations in GNAS

Affiliations

Impaired iloprost-induced platelet inhibition and phosphoproteome changes in patients with confirmed pseudohypoparathyroidism type Ia, linked to genetic mutations in GNAS

Frauke Swieringa et al. Sci Rep. .

Abstract

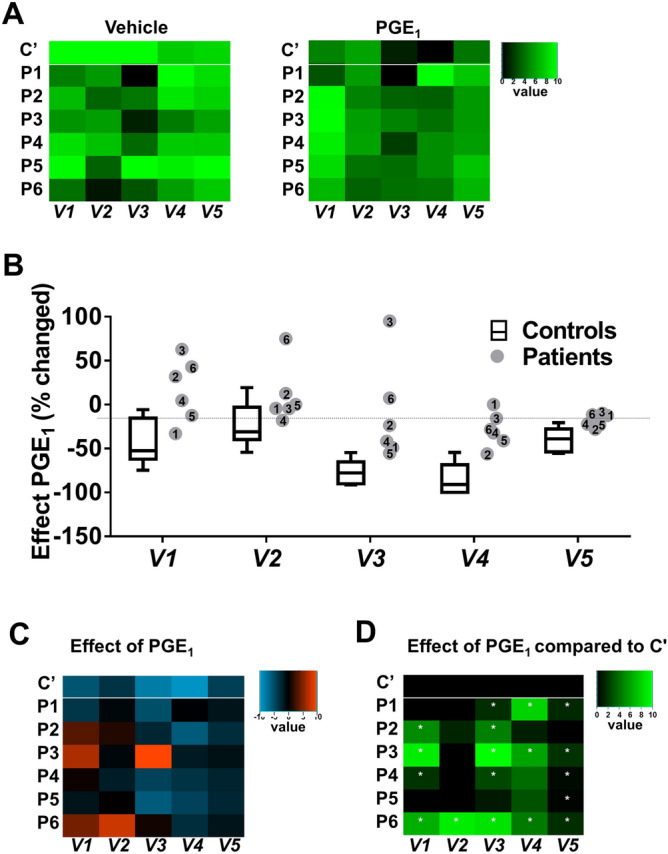
Patients diagnosed with pseudohypoparathyroidism type Ia (PHP Ia) suffer from hormonal resistance and abnormal postural features, in a condition classified as Albright hereditary osteodystrophy (AHO) syndrome. This syndrome is linked to a maternally inherited mutation in the GNAS complex locus, encoding for the GTPase subunit Gsα. Here, we investigated how platelet phenotype and omics analysis can assist in the often difficult diagnosis. By coupling to the IP receptor, Gsα induces platelet inhibition via adenylyl cyclase and cAMP-dependent protein kinase A (PKA). In platelets from seven patients with suspected AHO, one of the largest cohorts examined, we studied the PKA-induced phenotypic changes. Five patients with a confirmed GNAS mutation, displayed impairments in Gsα-dependent VASP phosphorylation, aggregation, and microfluidic thrombus formation. Analysis of the platelet phosphoproteome revealed 2,516 phosphorylation sites, of which 453 were regulated by Gsα-PKA. Common changes in the patients were: (1) a joint panel of upregulated and downregulated phosphopeptides; (2) overall PKA dependency of the upregulated phosphopeptides; (3) links to key platelet function pathways. In one patient with GNAS mutation, diagnosed as non-AHO, the changes in platelet phosphoproteome were reversed. This combined approach thus revealed multiple phenotypic and molecular biomarkers to assist in the diagnosis of suspected PHP Ia.


Conflict of interest statement

JWMH is co-founder and shareholder of FlowChamber. Other authors declare no conflicts of interest.

Figures

Figure 1
Figure 1
Changes in Gsα-mediated VASP phosphorylation in platelets from patients with suspected PHP Ia. Isolated, washed platelets were preincubated with iloprost (0–10 nM), fixed, permeabilised and stained with FITC anti-P-VASP mAb. (A) Representative flow cytometric histograms of VASP phosphorylation after iloprost treatment of platelets from control subject C1 and patient P1. (B) Quantified VASP phosphorylation results from control subjects (C1–12) and patients (P1–7). Box plots indicate medians ± interquartile ranges (whiskers represent 2.5–97.5th percentiles, n = 12).
Figure 2
Figure 2
Changes in Gsα-mediated inhibition of thrombus formation in blood from patients with suspected PHP Ia. Whole blood from control subjects (C1–8) and patients (P1–6) was perfused over collagen at wall shear rate of 1,000 s−1 for 4 min. Thrombi formed were evaluated from brightfield microscopic images and fluorescence images (staining with FITC anti-P-selectin mAb). Blood samples were preincubated with vehicle or PGE1 (100 nM), as indicated. (A) Unit variance normalised parameters of thrombus formation (0–10): platelet adhesion (V1); P-selectin expression (V2); aggregate integrated feature size (V3); thrombus multilayer score (V4); and thrombus morphological score (V5). Heatmaps show median values for all control subjects (C1–8, C’) and values for individual patients (P1–6) of blood flow runs in the presence of vehicle (left) or PGE1 (right). (B) Quantified effect of PGE1 on thrombus parameters; data for control subjects indicated as medians ± interquartile ranges (whiskers represent 2.5–97.5th percentiles, n = 8). (C) Heatmap of normalised effects of PGE1 per parameter and patient. (D) Subtraction heatmap of PGE1 effects in comparison to means of control platelets, *p < 0.05 (one-way ANOVA).
Figure 3
Figure 3
Minor alterations in global platelet proteome in patients with suspected PHP Ia. Global proteomics analysis of platelets from day control subjects (C1–4) and patients P1–4,6,7, providing quantitative information on 1,651–3,917 unique proteins. (A) Averaged normalised abundance ratios over all identified proteins per control subject, presented as medians ± interquartile ranges (whiskers indicate 2.5–97.5th percentiles). (B) Percentage factions of altered proteins per subject in comparison to mean of controls, C’); defined as values outside range of log2 − 0.322 to + 0.322.
Figure 4
Figure 4
Iloprost-induced and PKA-mediated changes in phosphoproteome of control platelets. (A) Heatmap of 453 phosphopeptides assigned as upregulated (blue) or downregulated (orange) by 10 or 2 nM iloprost in control platelets (C1–4). Left lanes: mean effects in platelets from the control subjects (C’). Phosphopeptides were ordered according to mean effect size by 10 nM iloprost. Next lanes: iloprost effects for the control subjects. Relevant regulated changes were arbitrarily thresholded for outside range of log2 − 0.322 to + 0.322. (B) Numbers of phosphopeptides identified as up- or downregulated by iloprost in ≥ 3 control subjects. (C) Fractions of phosphopeptides identified as up- or downregulated with a PKA consensus site; percentages refer to overlap with previous identification. (D) Venn diagrams presenting relevant up- and downregulated proteins by 2 or 10 nM iloprost. Left circles: previously identified, right circles: positive PKA consensus site.
Figure 5
Figure 5
Iloprost-induced changed in phosphoproteome of platelets from patients with suspected PHP Ia. (A) Heatmap of 453 platelet phosphopeptides identified as increased (green) or decreased (red) at indicated iloprost concentration per patient in comparison to mean effect in 3 or 4 control subjects (C1–4, C’). Left lane: mean effect of 10 nM iloprost in control platelets (see Fig. 4A). (B) Heatmap as in panel A, but restricted to relevant differences, filtered for outside control range of log2 2× (− 0.322 to + 0.322). (C) Average ratios of iloprost effects in platelets from selected patients (P1–4,6) versus control subjects (C1–4) regarding top-100 up-, non-, and downregulated phosphopeptides.*p < 0.05 vs. controls (2-sided t test).

References

    1. Mantovani G. Pseudohypoparathyroidism: diagnosis and treatment. J. Clin. Endocrinol. Metab. 2011;96:3020–3030. - PubMed
    1. Mantovani G, et al. Diagnosis and management of pseudohypoparathyroidism and related disorders: first international Consensus Statement. Nat. Rev. Endocrinol. 2018;14:476–500. - PMC - PubMed
    1. Kozasa T, Itoh H, Tsukamoto T, Kaziro Y. Isolation and characterization of the human Gs alpha gene. Proc. Natl. Acad. Sci. USA. 1988;85:2081–2085. - PMC - PubMed
    1. Peters J, Williamson CM. Control of imprinting at the Gnas cluster. Epigenetics. 2007;4:207–213. - PubMed
    1. International Consortium for Blood Pressure Genome-Wide Association Studies et al. Genetic variants in novel pathways influence blood pressure and cardiovascular disease risk. Nature478, 103–109 (2011). - PMC - PubMed

Publication types

MeSH terms

LinkOut - more resources