. 2020 Jul 9;10(1):11387.
doi: 10.1038/s41598-020-68394-4.

Analysis of tumor mutational burden: correlation of five large gene panels with whole exome sequencing

Affiliations

Analysis of tumor mutational burden: correlation of five large gene panels with whole exome sequencing

Carina Heydt et al. Sci Rep. .

Abstract

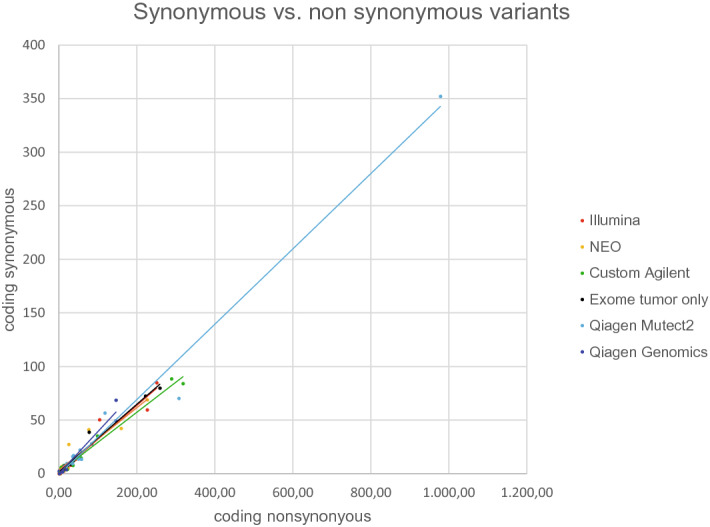
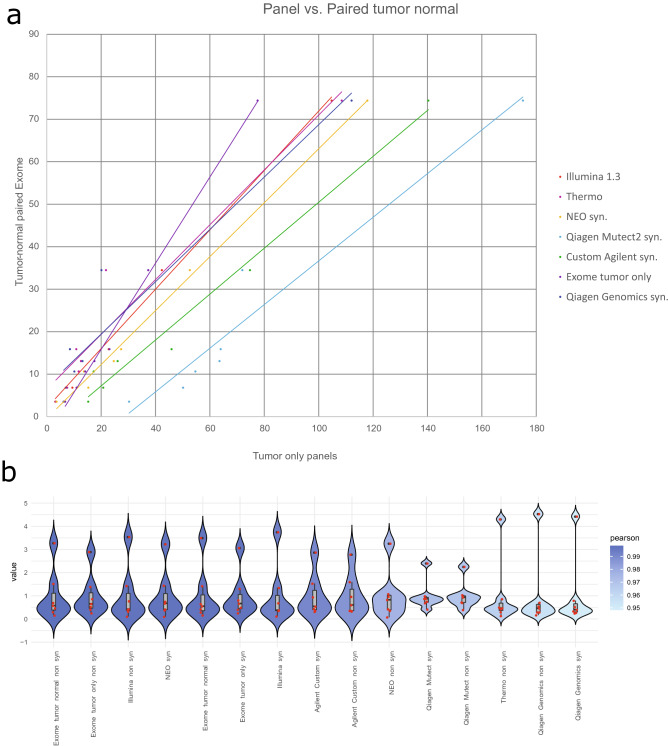
Outcome of immune checkpoint inhibition in cancer can be predicted by measuring PDL1 expression of tumor cells. Search for additional biomarkers led to tumor mutational burden (TMB) as surrogate marker for neoantigens presented. While TMB was previously determined via whole exome sequencing (WES), there have been approaches with comprehensive gene panels as well. We sequenced samples derived from formalin-fixed tumors, a POLE mutated cell line and standard DNA by WES and five different panels. If available, normal tissue was also exome sequenced. Sequencing data was analyzed by commercial software solutions and an in-house pipeline. A robust Pearson correlation (R = 0.9801 ± 0.0167; mean ± sd; N = 7) was determined for the different panels in a tumor paired normal setting for WES. Expanded analysis on tumor only exome sequenced samples yielded similar correlation (R = 0.9439 ± 0.0632; mean ± sd; N = 14). Remaining germline variants increased TMB in WES by 5.761 ± 1.953 (mean ± sd.; N = 7) variants per megabase (v/mb) for samples including synonymous variants and 3.883 ± 1.38 v/mb for samples without synonymous variants compared to tumor-normal paired calling results. Due to limited sample numbers in this study, additional replication is suggested for a clinical setting. Remaining germline variants in a tumor-only setting and artifacts caused by different library chemistries construction might affect the results.


Conflict of interest statement

The authors declare that they have no competing interests. Part of the reagents used were made available free of charge by Illumina, Qiagen and NEO New Oncology.

Figures

Figure 1
Figure 1
TMB values in mutations per MB of only coding non-synonymous (x-axis) and synonymous (y-axis) for bioinformatic pipelines that allowed for this differentiation. Panels: Illumina—TSO500; NEO—NEOplus v2 RUO TMB (NEO New Oncology); Custom Agilent custom—custom panel Agilent SureSelect XT HS; Exome tumor only—WES Agilent SureSelect XT HS Human All Exon v6 panel; Qiagen Mutect2—Qiagen TMB v3.0 (Qiagen) analyzed with Mutect2 in-house pipeline; Qiagen Genomics—Qiagen TMB v3.0 (Qiagen) analyzed with Qiagen Genomics Workbench 12.0.2.; Oncomine Tumor Mutation Load assay (Thermo Fisher Scientific) did not allow for differentiation of synonymous and non-synonymous variants.
Figure 2
Figure 2
(a) TMB values of the panels (x-axis) compared to results from paired tumor-normal WES of non synonymous variants (y-axis). If bioinformatic pipelines delivered results including coding synonymous variants as well as excluding them, the ones with the highest correlation to the tumor-normal paired analysis are shown. Panels: Illumina—TSO500; NEO—NEOplus v2 RUO TMB (NEO New Oncology); Agilent custom—custom panel Agilent SureSelect XT HS; Exome tumor only—WES Agilent SureSelect XT HS Human All Exon v6 panel; Qiagen Mutect2—Qiagen TMB v3.0 (Qiagen) analyzed with Mutect2 in-house pipeline; Qiagen Genomics—Qiagen TMB v3.0 (Qiagen) analyzed with Qiagen Genomics Workbench 12.0.2.; Thermo—Oncomine Tumor Mutation Load assay (Thermo Fisher Scientific); syn.—Analysis includes synonymous variants. (b) Average normalized TMB values (y-axis) for all panels (x-axis) shown as violin plots. The red dots are the samples for the panels. The outer shape represents the density distribution and filling heat map corresponds to the Pearson correlation to exome t-n. The lower and upper hinges correspond to the first and third quartiles (the 25th and 75th percentiles) with 95% confidence interval.

References

    1. Borghaei H, et al. Nivolumab versus docetaxel in advanced nonsquamous non–small-cell lung cancer. N. Engl. J. Med. 2015;373:1627–1639. - PMC - PubMed
    1. Hodi FS, et al. Improved survival with ipilimumab in patients with metastatic melanoma. N. Engl. J. Med. 2010;363:711–723. - PMC - PubMed
    1. Gibney GT, Weiner LM, Atkins MB. Predictive biomarkers for checkpoint inhibitor-based immunotherapy. Lancet Oncol. 2016;17:e542–e551. - PMC - PubMed
    1. Hugo W, et al. Genomic and transcriptomic features of response to anti-PD-1 therapy in metastatic melanoma. Cell. 2016;165:35–44. - PMC - PubMed
    1. Mehnert JM, et al. The challenge for development of valuable immuno-oncology biomarkers. Clin. Cancer Res. 2017;23:4970–4979. - PMC - PubMed

MeSH terms

Substances