Review
. 2020 Jun;8(12):795.
doi: 10.21037/atm.2020.04.10.

Understanding ventriculo-arterial coupling

Affiliations
Review

Understanding ventriculo-arterial coupling

Manuel Ignacio Monge García et al. Ann Transl Med. 2020 Jun.

Abstract

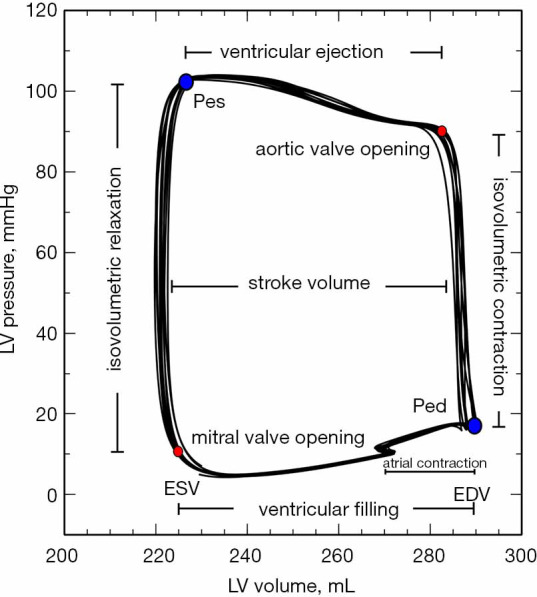
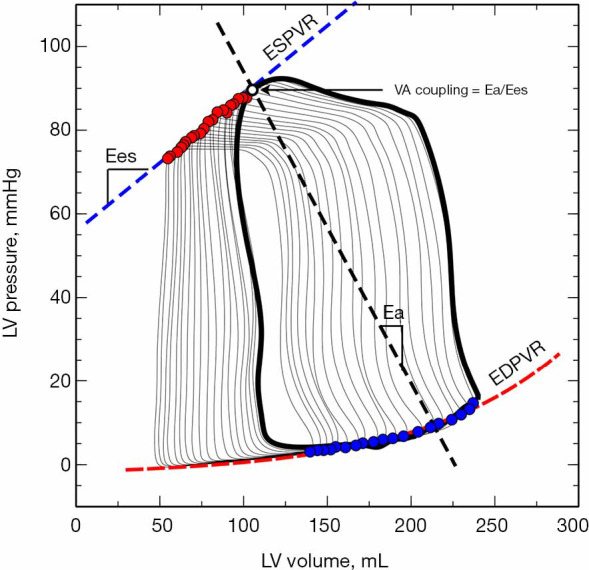
In the late 19th century, Otto Frank published the first description of a ventricular pressure-volume diagram, thus laid the foundation for modern cardiovascular physiology. Since then, the analysis of the pressure-volume loops became a reference tool for the study of the ventricular pump properties. However, understanding cardiovascular performance requires both the evaluation of ventricular properties and the modulating effects of the arterial system, since the heart and the arterial tree are anatomically and functionally related structures. The study of the coupling between the cardiac function and the properties of the arterial system, or ventriculo-arterial (VA) coupling, provides then a comprehensive characterization of the performance of the cardiovascular system in both health and disease. The assessment of cardiovascular function is an essential element of the hemodynamic evaluation of critically ill patients. Both left and right ventricular dysfunction and arterial system disturbances are frequent in these patients. Since VA coupling ultimately defines de performance and efficiency of the cardiovascular system, the analysis of the interaction between the heart and the arterial system could offer a broader perspective of the hemodynamic disorders associated with common conditions, such as septic shock, heart failure, or right ventricular dysfunction. Moreover, this analysis could also provide valuable information about their pathophysiological mechanisms and may help to determine the best therapeutic strategy to correct them. In this review, we will describe the basic principles of the VA coupling assessment, its limitations, and the most common methods for its estimation at the bedside. Then, we will summarize the current knowledge of the application of VA coupling in critically ill patients and suggest some recommendations for further research.

Keywords: Ventricular-arterial coupling; arterial effective elastance; critical care; pressure-volume loop; ventricular elastance.


Conflict of interest statement

Conflicts of Interest: Both authors have completed the ICMJE uniform disclosure form (available at http://dx.doi.org/10.21037/atm.2020.04.10). The series “Hemodynamic Monitoring in Critically Ill Patients” was commissioned by the editorial office without any funding or sponsorship. MIMG reports personal fees from Edwards Lifesciencies, outside the submitted work. AS has no other conflicts to disclose.

Figures

Figure 1
Figure 1
Left ventricular pressure-volume diagram. Pressure-volume loops obtained during an end-expiratory pause. At the lower-left corner (red circle), the mitral valve opens, and the ventricle starts rapidly to fill up during diastole. This stage concludes with the atrial contraction at the end-diastolic pressure (Ped) and volume (EDV) (lower-right corner, blue circle). Then, the mitral valve closes, and the isovolumetric contraction phase starts. When the intraventricular pressure exceeds the aortic pressure, the aortic valve opens (upper-right corner, red circle), and the ventricle ejects decreasing intraventricular volume until end-systolic volume (ESV) and end-systolic pressure (Pes) (upper-left corner, blue circle). When the aortic valve closes, there is an intraventricular pressure decrease without any change in volume (the isovolumetric relaxation phase). When the intraventricular pressure drops below the atrial pressure, the mitral valve opens, and the cardiac cycle starts again.
Figure 2
Figure 2
Simultaneous right and left ventricular pressure-volume (PV) loops during an inferior vena cava occlusion. Simultaneous recording of right and left ventricular volumes (blue line) and pressures (red line), from which pressure-volume loops were constructed (top, black lines). The dashed green lines represent the end-systolic and end-diastolic pressure-volume relationships (ESPVR and EDPVR), respectively.
Figure 3
Figure 3
Example of the left ventricular pressure-volume loops during and inferior vena cava occlusion. Left ventricular PV loops during a transient inferior vena cava occlusion (IVC). Red points represent the maximal elastance for each cardiac cycle and the straight line connecting them the end-systolic pressure-volume relationship (ESPVR, blue dashed line). The slope of ESPVR defines the LV end-systolic elastance (Ees), a marker of LV contractility. The exponential curve represented by a dashed red line depicts the end-diastolic pressure-volume relationship (EDVPR), which characterizes the diastolic properties of the ventricle. The dashed black line connecting the end-systolic pressure with the stroke volume (defined by the width of the PV loop: end-diastolic volume minus end-systolic volume) represents the effective arterial elastance (Ea), a net measure of arterial load. The crossing point where the slope of ESPVR (Ees) intersects with the Ea defines the ventriculo-arterial (VA) coupling.
Figure 4
Figure 4
Left ventricular pressure-volume (PV) loops showing the effects of contractility changes on Ees and afterload variations in Ea. (A) Cardiac contractility was increased with dobutamine and decreased with esmolol. The slope of the end-systolic PV relation (ESPVR) defines the end-systolic elastance (Ees, dashed colored lines) and the contractility performance at each stage. (B) Afterload was increased with phenylephrine and decreased with sodium nitroprusside. The lines connecting the end-diastolic volume and end-systolic pressure describes the effective arterial elastance at each stage (Ea, dotted colored lines).
Figure 5
Figure 5
Time-varying elastance model. Time-varying elastance or E(t) curves obtained from the simultaneous measurements of left ventricular pressure and volume in an experimental animal submitted to changes in contractility with dobutamine (blue curve) and esmolol (red curve). Elastance increases during systole until reaching a maximal value (Emax) at the end of the systole. Changes in contractility affect not only the amplitude but also the time to reach Emax: the better the contractility, the higher the magnitude and the sooner the Emax.
Figure 6
Figure 6
Cardiac energetics analysis from the pressure-volume analysis. The external or stroke work performed by the ventricle is represented by the area within the PV loop (light blue area). The potential energy (PE) represents the elastic energy stored in the ventricle at the end of the systole (dark blue area). The total pressure-volume area (PVA) is defined as the sum of SW and PE. ESPVR and EDPVR indicate the end-systolic and end-diastolic pressure-volume relationships, respectively. Pes and Ped are the end-systolic and end-diastolic pressures.
Figure 7
Figure 7
Load-dependency of single-beat Ees estimation. Comparison of end-systolic elastance (Ees) obtained as the slope of end-systolic pressure-volume relation (red dashed line, ESPVR) and single-beat estimation (solid black lines, Eessb1 and Eessb2). When V0 =0 was assumed, the evaluation of Ees by the single-beat method (Eessb = end-systolic pressure or Pes/end-systolic volume) at different levels of afterload results in different slopes, while the actual Ees remains unchanged.

References

    1. Guarracino F, Baldassarri R, Pinsky MR. Ventriculo-arterial decoupling in acutely altered hemodynamic states. Crit Care 2013;17:213. 10.1186/cc12522 - DOI - PMC - PubMed
    1. Sunagawa K, Sagawa K, Maughan WL. Ventricular interaction with the loading system. Ann Biomed Eng 1984;12:163-89. 10.1007/BF02584229 - DOI - PubMed
    1. Yin FCP, Avolio AP. Ventricular/vascular coupling: clinical, physiological, and engineering aspects. New York: Springer-Verlag; 1987.
    1. Kass DA, Kelly RP. Ventriculo-arterial coupling: concepts, assumptions, and applications. Ann Biomed Eng 1992;20:41-62. 10.1007/BF02368505 - DOI - PubMed
    1. Starling MR. Left ventricular-arterial coupling relations in the normal human heart. Am Heart J 1993;125:1659-66. 10.1016/0002-8703(93)90756-Y - DOI - PubMed