

Effects of Ertugliflozin on Liver Enzymes in Patients with Type 2 Diabetes: A Post-Hoc Pooled Analysis of Phase 3 Trials
- PMID: 32648108
- PMCID: PMC7376773
- DOI: 10.1007/s13300-020-00867-1
Effects of Ertugliflozin on Liver Enzymes in Patients with Type 2 Diabetes: A Post-Hoc Pooled Analysis of Phase 3 Trials
Abstract
Introduction: This post hoc exploratory analysis examined the effects of ertugliflozin on liver enzymes in patients with type 2 diabetes mellitus (T2DM).
Methods: Data were pooled from seven randomized, double-blind VERTIS phase 3 trials that evaluated ertugliflozin (5 mg and 15 mg) versus non-ertugliflozin (placebo, glimepiride, or sitagliptin) treatment in patients with T2DM. Change from baseline at week 52 of treatment in alanine and aspartate aminotransferase (ALT and AST, respectively) serum levels (overall and categorized into tertiles by baseline ALT and AST), Fibrosis-4 Index (FIB-4), glycated hemoglobin (HbA1c), and body weight were evaluated, along with the association between changes in ALT and AST and changes in HbA1c and body weight by treatment.
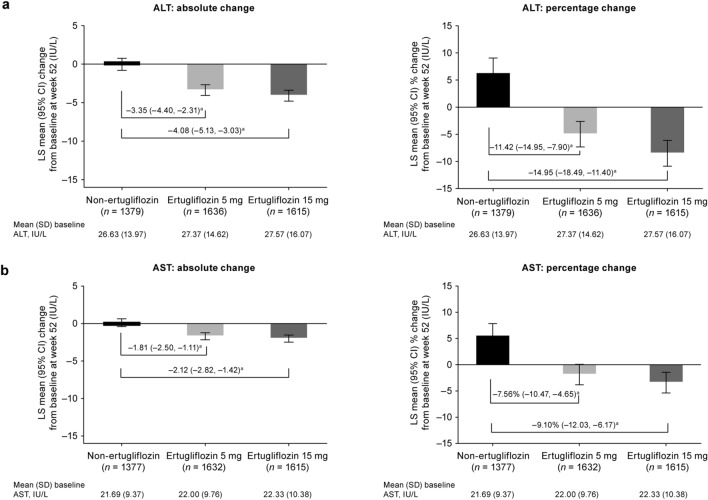
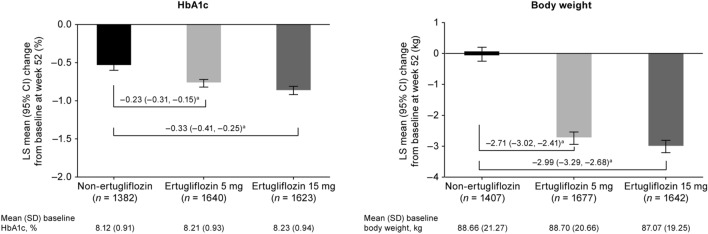
Results: Baseline characteristics were balanced across treatment groups (ertugliflozin 5 mg, n = 1716; ertugliflozin 15 mg, n = 1693; non-ertugliflozin, n = 1450). At week 52 of treatment, serum levels of ALT and AST were reduced in patients in the ertugliflozin treatment groups (5 and 15 mg, respectively) compared with those in the non-ertugliflozin group. The comparator-adjusted mean (95% confidence interval [CI]) difference in change from baseline at week 52 for ALT was - 3.35 (- 4.40, - 2.31) IU/L for ertugliflozin 5 mg and - 4.08 (- 5.13, - 3.03) IU/L for ertugliflozin 15 mg; for AST, the respective values were - 1.81 (- 2.50, - 1.11) IU/L and - 2.12 (- 2.82, - 1.42) IU/L. The effects of ertugliflozin were detected across all baseline ALT and AST tertiles, with the highest tertile showing the greatest treatment differences. No meaningful differences were observed between treatment groups for FIB-4. Changes in ALT and AST showed a weak but statistically significant association with changes in HbA1c and body weight in all treatment groups.
Conclusions: Treatment with ertugliflozin resulted in a reduction in the levels of hepatic transaminases compared with the non-ertugliflozin group after 52 weeks of treatment. Changes in body weight and HbA1c contributed at least in part to the effects of ertugliflozin on liver enzymes.
Trial registration: Clinicaltrials.gov registry numbers: NCT02033889, NCT01958671, NCT02036515, NCT01986855, NCT02099110, NCT02226003, NCT01999218.
Keywords: Alanine aminotransferase; Aspartate aminotransferase; Body weight; Ertugliflozin; Fibrosis-4 index; HbA1c; Liver enzymes; SGLT2 inhibitor; Type 2 diabetes mellitus.
Figures

References
Associated data
LinkOut - more resources
Full Text Sources
Medical
