

Nanomolar ATP binding to single myosin cross-bridges in rigor: a molecular approach to studying myosin ATP kinetics using single human cardiomyocytes
- PMID: 32648209
- PMCID: PMC7429591
- DOI: 10.1007/s12551-020-00716-2
Nanomolar ATP binding to single myosin cross-bridges in rigor: a molecular approach to studying myosin ATP kinetics using single human cardiomyocytes
Abstract
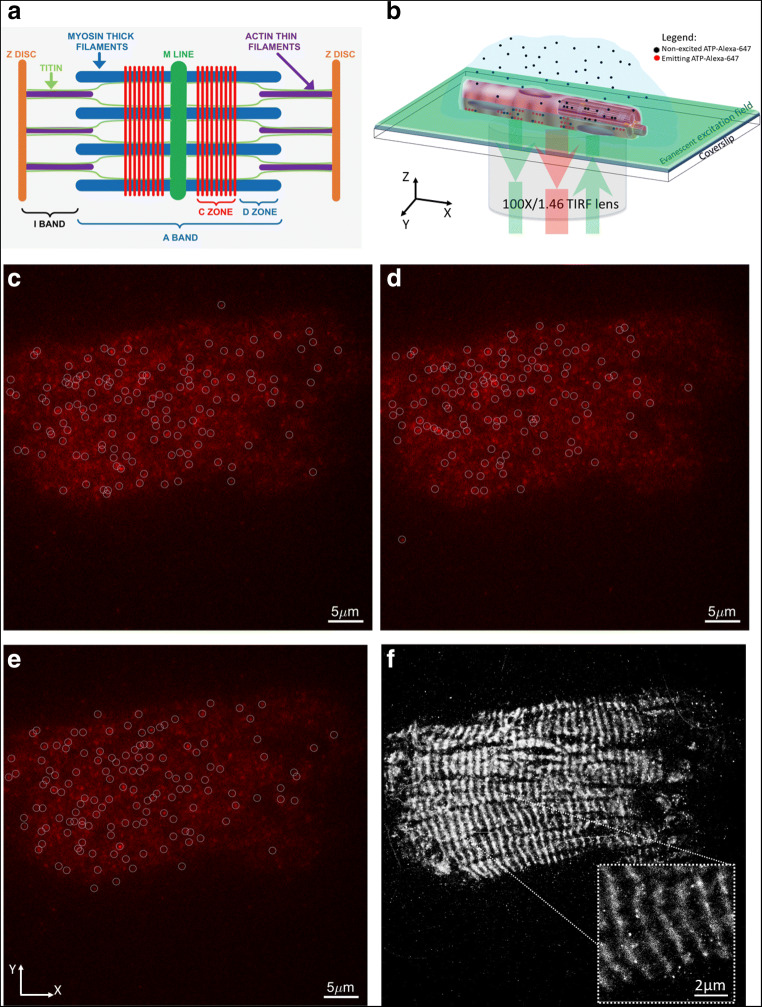
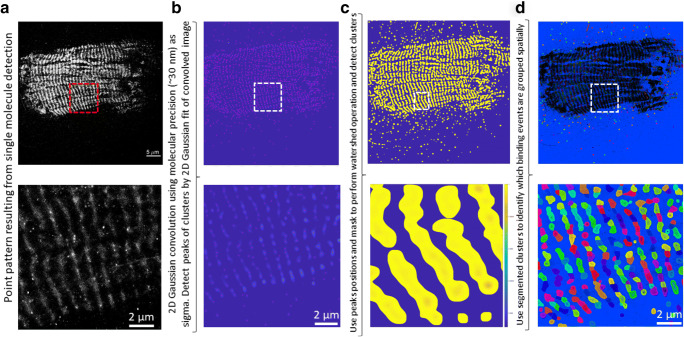
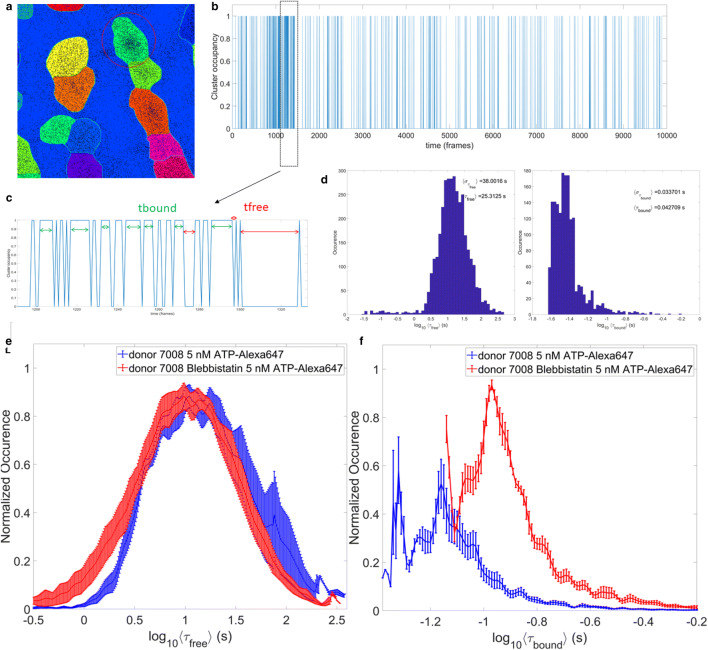
Our knowledge in the field of cardiac muscle and associated cardiomyopathies has been evolving incrementally over the past 60 years and all was possible due to the parallel progress in techniques and methods allowing to take a fresh glimpse at an old problem. Here, we describe an exciting tool used to examine the various states of the human cardiac myosin at the single molecule level. By imaging single Alexa647-ATP binding to permeabilised cardiomyocytes using total internal reflection fluorescence (TIRF) microscopy, we are able to acquire large populations of events in a short timeframe (~ 5000 sites in ~ 10 min) and measure each binding event with high spatio-temporal resolution. The applied algorithm decomposes the point pattern of single molecule binding events into individually distinct binding sites that enables us to recover kinetic parameters, such as bound or free time per site. This single molecule binding approach is a useful tool used to examine muscle contractility. Of particular importance is its application to probing the dynamic lifetimes and proportion of myosins in the super-relaxed state in human cardiomyopathies.
Keywords: ATP analogues; ATP-binding kinetics; Human heart cardiomyocytes; SMLM; Single molecule imaging of ATP; TIRF microscopy.
Figures
Similar articles
-
ATP turnover by individual myosin molecules hints at two conformers of the myosin active site.Proc Natl Acad Sci U S A. 2014 Feb 18;111(7):2536-41. doi: 10.1073/pnas.1316390111. Epub 2014 Feb 3. Proc Natl Acad Sci U S A. 2014. PMID: 24550279 Free PMC article.
-
Imaging ATP Consumption in Resting Skeletal Muscle: One Molecule at a Time.Biophys J. 2020 Sep 15;119(6):1050-1055. doi: 10.1016/j.bpj.2020.07.036. Epub 2020 Aug 15. Biophys J. 2020. PMID: 32857963 Free PMC article.
-
Allosteric modulation of cardiac myosin mechanics and kinetics by the conjugated omega-7,9 trans-fat rumenic acid.J Physiol. 2021 Aug;599(15):3639-3661. doi: 10.1113/JP281563. Epub 2021 Jun 1. J Physiol. 2021. PMID: 33942907
-
Measuring rotations of a few cross-bridges in skeletal muscle.Exp Biol Med (Maywood). 2006 Jan;231(1):28-38. doi: 10.1177/153537020623100104. Exp Biol Med (Maywood). 2006. PMID: 16380642 Review.
-
Regulation of contraction in striated muscle.Physiol Rev. 2000 Apr;80(2):853-924. doi: 10.1152/physrev.2000.80.2.853. Physiol Rev. 2000. PMID: 10747208 Review.
Cited by
-
To lie or not to lie: Super-relaxing with myosins.Elife. 2021 Feb 10;10:e63703. doi: 10.7554/eLife.63703. Elife. 2021. PMID: 33565963 Free PMC article.
-
Biophysics of human anatomy and physiology-a Special Issue in honor of Prof. Cristobal dos Remedios on the occasion of his 80th birthday.Biophys Rev. 2020 Aug;12(4):731-739. doi: 10.1007/s12551-020-00745-x. Epub 2020 Jul 29. Biophys Rev. 2020. PMID: 32729063 Free PMC article.
-
A novel kinetic model to demonstrate the independent effects of ATP and ADP/Pi concentrations on sarcomere function.PLoS Comput Biol. 2024 Aug 5;20(8):e1012321. doi: 10.1371/journal.pcbi.1012321. eCollection 2024 Aug. PLoS Comput Biol. 2024. PMID: 39102392 Free PMC article.
-
Biophysical Reviews: 2020-looking back, going forward.Biophys Rev. 2020 Dec 2;12(6):1269-1276. doi: 10.1007/s12551-020-00777-3. eCollection 2020 Dec. Biophys Rev. 2020. PMID: 33288985 Free PMC article.
References
-
- Carrier L, Hengstenberg C, Beckmann JS et al (1993) Mapping of a novel gene for familial hypertrophic cardiomyopathy to chromosome 11. Nature Genetics. 4:311–313 - PubMed
Publication types
LinkOut - more resources
Full Text Sources
Miscellaneous
