

Statistical Properties of Stepped Wedge Cluster-Randomized Trials in Infectious Disease Outbreaks
- PMID: 32648891
- PMCID: PMC7604531
- DOI: 10.1093/aje/kwaa141
Statistical Properties of Stepped Wedge Cluster-Randomized Trials in Infectious Disease Outbreaks
Abstract
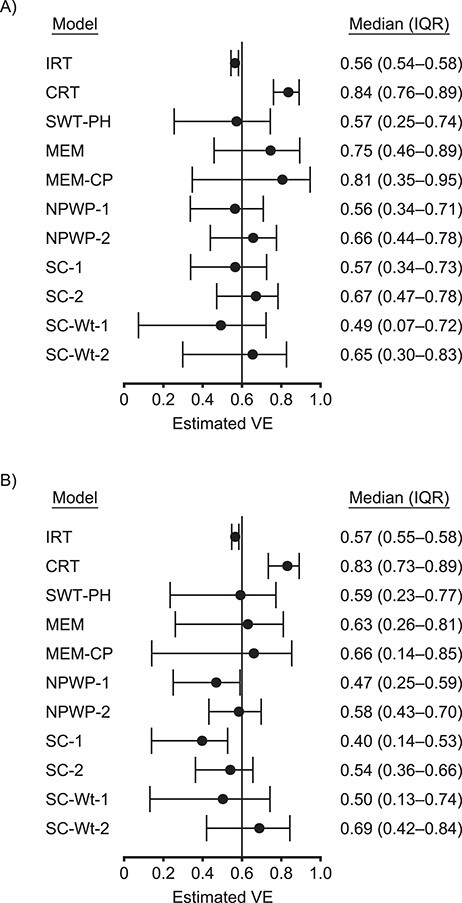
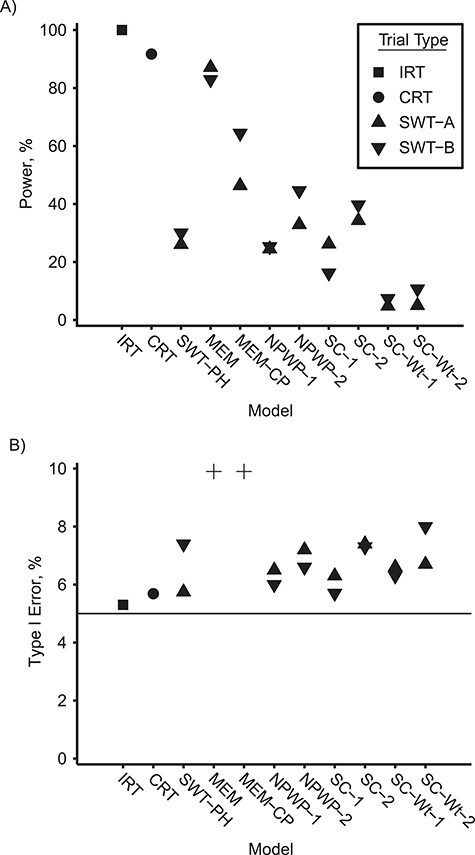
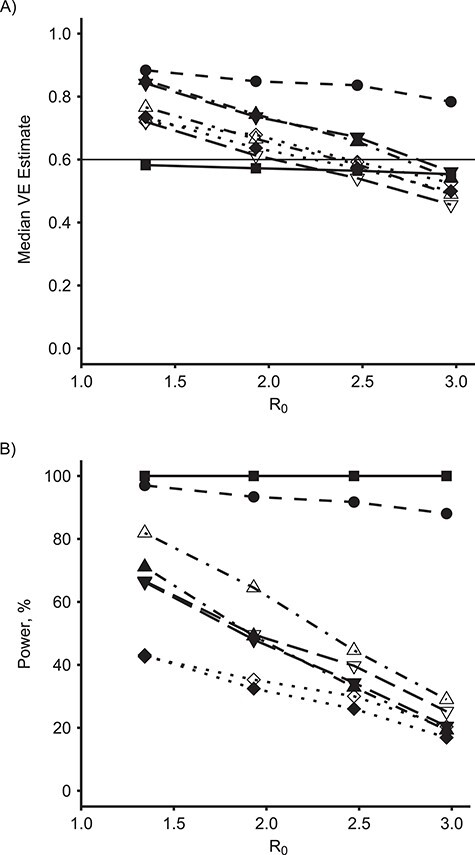
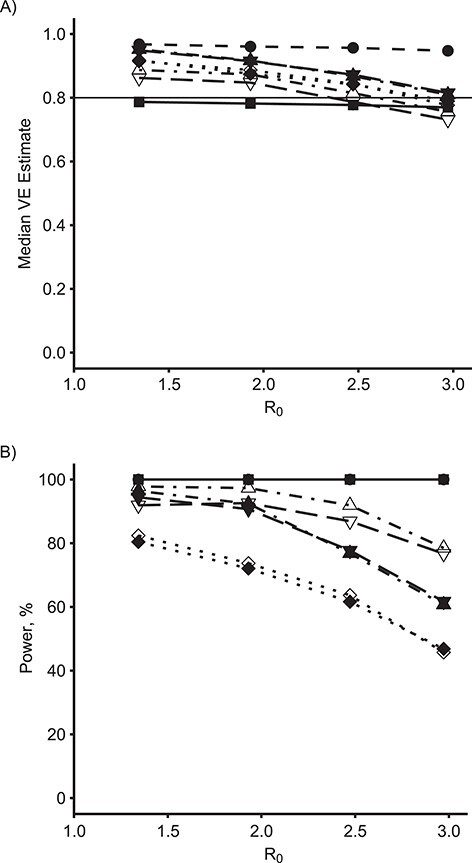
Randomized controlled trials are crucial for the evaluation of interventions such as vaccinations, but the design and analysis of these studies during infectious disease outbreaks is complicated by statistical, ethical, and logistical factors. Attempts to resolve these complexities have led to the proposal of a variety of trial designs, including individual randomization and several types of cluster randomization designs: parallel-arm, ring vaccination, and stepped wedge designs. Because of the strong time trends present in infectious disease incidence, however, methods generally used to analyze stepped wedge trials might not perform well in these settings. Using simulated outbreaks, we evaluated various designs and analysis methods, including recently proposed methods for analyzing stepped wedge trials, to determine the statistical properties of these methods. While new methods for analyzing stepped wedge trials can provide some improvement over previous methods, we find that they still lag behind parallel-arm cluster-randomized trials and individually randomized trials in achieving adequate power to detect intervention effects. We also find that these methods are highly sensitive to the weighting of effect estimates across time periods. Despite the value of new methods, stepped wedge trials still have statistical disadvantages compared with other trial designs in epidemic settings.
Keywords: cluster-randomized trials; epidemics; permutation tests; simulation; stepped wedge trials; synthetic control; vaccine trials.
© The Author(s) 2020. Published by Oxford University Press on behalf of the Johns Hopkins Bloomberg School of Public Health. All rights reserved. For permissions, please e-mail: journals.permissions@oup.com.
Figures
Update of
-
Statistical Properties of Stepped Wedge Cluster-Randomized Trials in Infectious Disease Outbreaks.medRxiv [Preprint]. 2020 May 6:2020.05.01.20087429. doi: 10.1101/2020.05.01.20087429. medRxiv. 2020. Update in: Am J Epidemiol. 2020 Nov 2;189(11):1324-1332. doi: 10.1093/aje/kwaa141. PMID: 32511544 Free PMC article. Updated. Preprint.
Similar articles
-
Statistical Properties of Stepped Wedge Cluster-Randomized Trials in Infectious Disease Outbreaks.medRxiv [Preprint]. 2020 May 6:2020.05.01.20087429. doi: 10.1101/2020.05.01.20087429. medRxiv. 2020. Update in: Am J Epidemiol. 2020 Nov 2;189(11):1324-1332. doi: 10.1093/aje/kwaa141. PMID: 32511544 Free PMC article. Updated. Preprint.
-
A review of current practice in the design and analysis of extremely small stepped-wedge cluster randomized trials.Clin Trials. 2025 Feb;22(1):45-56. doi: 10.1177/17407745241276137. Epub 2024 Oct 8. Clin Trials. 2025. PMID: 39377196 Free PMC article. Review.
-
Reconsidering stepped wedge cluster randomized trial designs with implementation periods: Fewer sequences or the parallel-group design with baseline and implementation periods are potentially more efficient.Clin Trials. 2024 Dec;21(6):710-722. doi: 10.1177/17407745241244790. Epub 2024 Apr 22. Clin Trials. 2024. PMID: 38650332 Free PMC article.
-
Five questions to consider before conducting a stepped wedge trial.Trials. 2015 Aug 17;16:350. doi: 10.1186/s13063-015-0841-8. Trials. 2015. PMID: 26279013 Free PMC article.
-
Developing Statistical Methods to Improve Stepped-Wedge Cluster Randomized Trials [Internet].Washington (DC): Patient-Centered Outcomes Research Institute (PCORI); 2021 Aug. Washington (DC): Patient-Centered Outcomes Research Institute (PCORI); 2021 Aug. PMID: 38913814 Free Books & Documents. Review.
Cited by
-
The required size of cluster randomized trials of nonpharmaceutical interventions in epidemic settings.Stat Med. 2022 Jun 15;41(13):2466-2482. doi: 10.1002/sim.9365. Epub 2022 Mar 7. Stat Med. 2022. PMID: 35257398 Free PMC article.
-
Quasi-experimental methods for pharmacoepidemiology: difference-in-differences and synthetic control methods with case studies for vaccine evaluation.Am J Epidemiol. 2024 Jul 8;193(7):1050-1058. doi: 10.1093/aje/kwae019. Am J Epidemiol. 2024. PMID: 38456774 Free PMC article.
-
Public Health Impacts of Vaccines for COVID-19 and Beyond: Opportunities to Overcome Technical and Regulatory Barriers for Randomized Trials.Am J Public Health. 2023 Jul;113(7):778-785. doi: 10.2105/AJPH.2023.307302. Epub 2023 Apr 27. Am J Public Health. 2023. PMID: 37104734 Free PMC article.
-
Masks and distancing during COVID-19: a causal framework for imputing value to public-health interventions.Sci Rep. 2021 Mar 4;11(1):5183. doi: 10.1038/s41598-021-84679-8. Sci Rep. 2021. PMID: 33664380 Free PMC article.
-
Much ado about something: a response to "COVID-19: underpowered randomised trials, or no randomised trials?".Trials. 2021 Nov 7;22(1):780. doi: 10.1186/s13063-021-05755-y. Trials. 2021. PMID: 34743755 Free PMC article.
References
-
- Halloran ME, Longini IM, Struchiner CJ. Design and Analysis of Vaccine Studies. New York, NY: Springer; 2010.
-
- Halloran ME, Haber M, Longini IM, et al. . Direct and indirect effects in vaccine efficacy and effectiveness. Am J Epidemiol. 1991;133(4):323–331. - PubMed
