

Global Overview of Response Rates in Patient and Health Care Professional Surveys in Surgery: A Systematic Review
- PMID: 32649458
- PMCID: PMC8683255
- DOI: 10.1097/SLA.0000000000004078
Global Overview of Response Rates in Patient and Health Care Professional Surveys in Surgery: A Systematic Review
Abstract
Objective: Identify key demographic factors and modes of follow-up in surgical survey response.
Summary background data: Surveys are widely used in surgery to assess patient and procedural outcomes, but response rates vary widely which compromises study quality. Currently there is no consensus as to what the average response rate is and which factors are associated with higher response rates.
Methods: The National Library of Medicine (MEDLINE/PubMed) was systematically searched from Januray 1, 2007 until February 1, 2020 using the following strategy: (((questionnaire) OR survey) AND "response rate") AND (surgery OR surgical). Original survey studies from surgical(-related) fields reporting on response rate were included. Through one-way analysis of variance we present mean response rate per survey mode over time, number of additional contacts, country of origin, and type of interviewee.
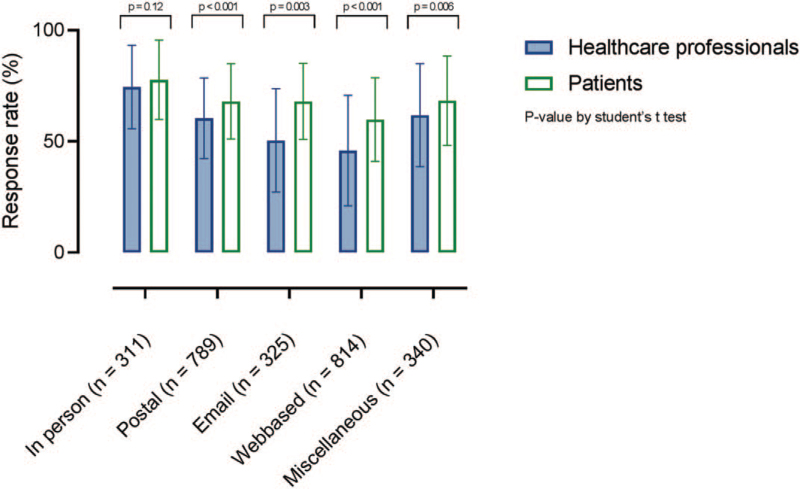
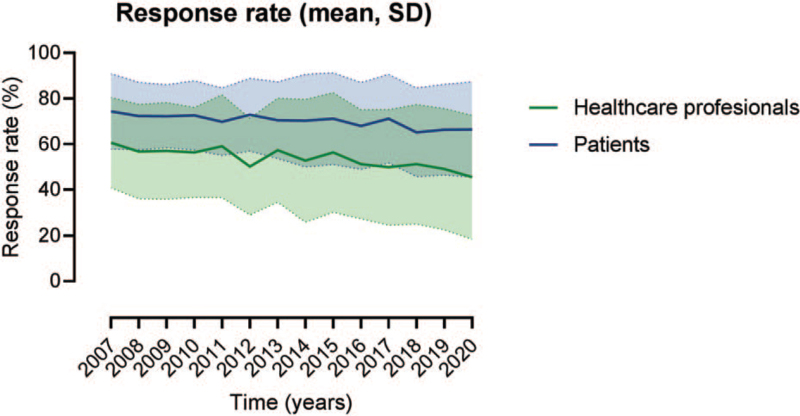
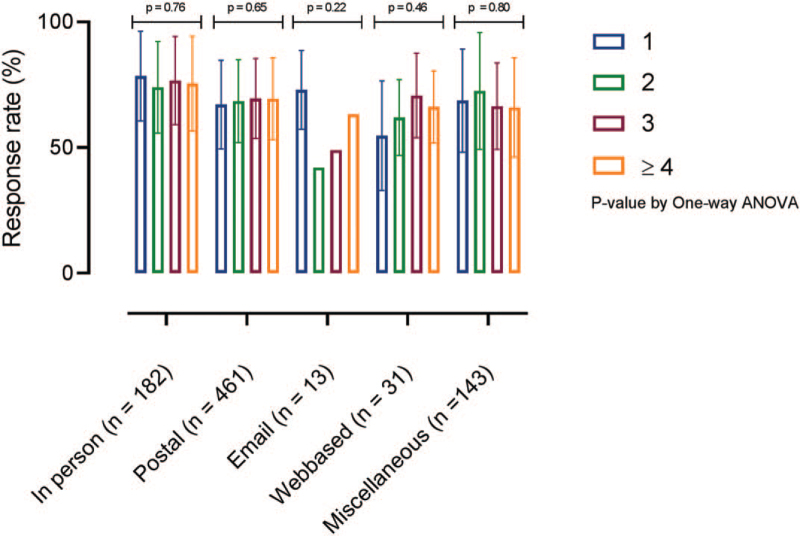
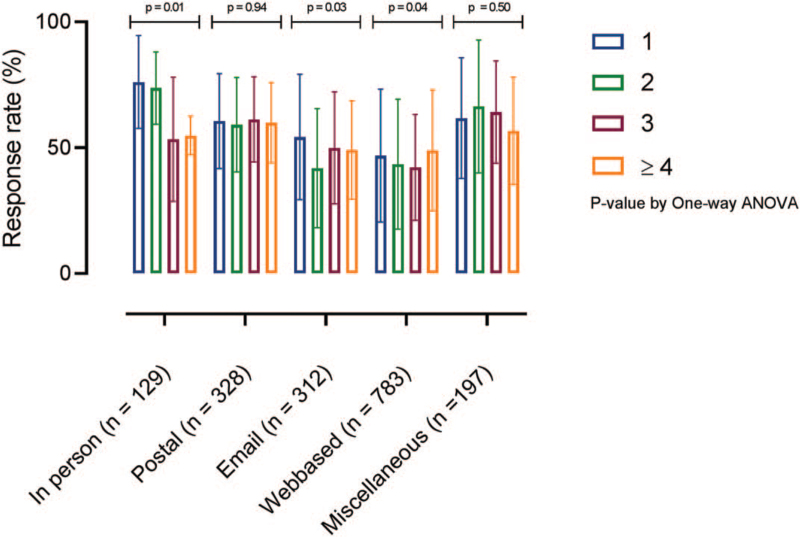
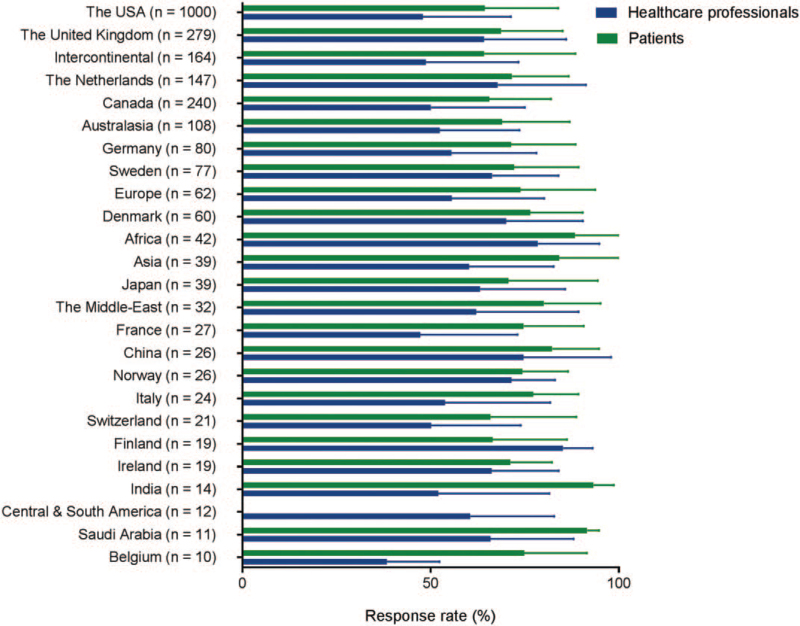
Results: The average response is 70% over 811 studies in patients and 53% over 1746 doctor surveys. In-person surveys yield an average 76% response rate, followed by postal (65%) and online (46% web-based vs 51% email) surveys. Patients respond significantly more often than doctors to surveys by mail (P < 0.001), email (P = 0.003), web-based surveys (P < 0.001) and mixed mode surveys (P = 0.006). Additional contacts significantly improve response rate in email (P = 0.26) and web-based (P = 0.041) surveys in doctors. A wide variation in response rates was identified between countries.
Conclusions: Every survey is unique, but the main commonality between studies is response rate. Response rates appear to be highly dependent on type of survey, follow-up, geography, and interviewee type.
Copyright © 2020 The Author(s). Published by Wolters Kluwer Health, Inc.
Conflict of interest statement
The authors report no conflict of interests.
Figures
References
-
- Mccoll E, Jacoby A, Thomas L, et al. Design and use of questionnaires: a review of best practice applicable to surveys of health service staff and patients. Health Technol Assess 2001; 5:1–256. - PubMed
-
- Marshall G. The purpose,;1; design and administration of a questionnaire for data collection. Radiography 2005; 11:131–136.
-
- Phillips AW, Reddy S, Durning SJ. Improving response rates and evaluating nonresponse bias in surveys: AMEE Guide No. 102. Med Teach 2016; 38:217–228. - PubMed
-
- Krosnick JA. Survey research. Annu Rev Psychol 1999; 50:537–567. - PubMed
-
- Krosnick JA. Response strategies for coping with the cognitive demands of attitude measures in surveys. Appl Cogn Psychol 1991; 5:213–236.
Publication types
MeSH terms
LinkOut - more resources
Full Text Sources
Medical
