. 2020 Jul 23;182(2):481-496.e21.
doi: 10.1016/j.cell.2020.05.040. Epub 2020 Jul 9.

A Genetic Map of the Response to DNA Damage in Human Cells

Affiliations

A Genetic Map of the Response to DNA Damage in Human Cells

Michele Olivieri et al. Cell. .

Abstract

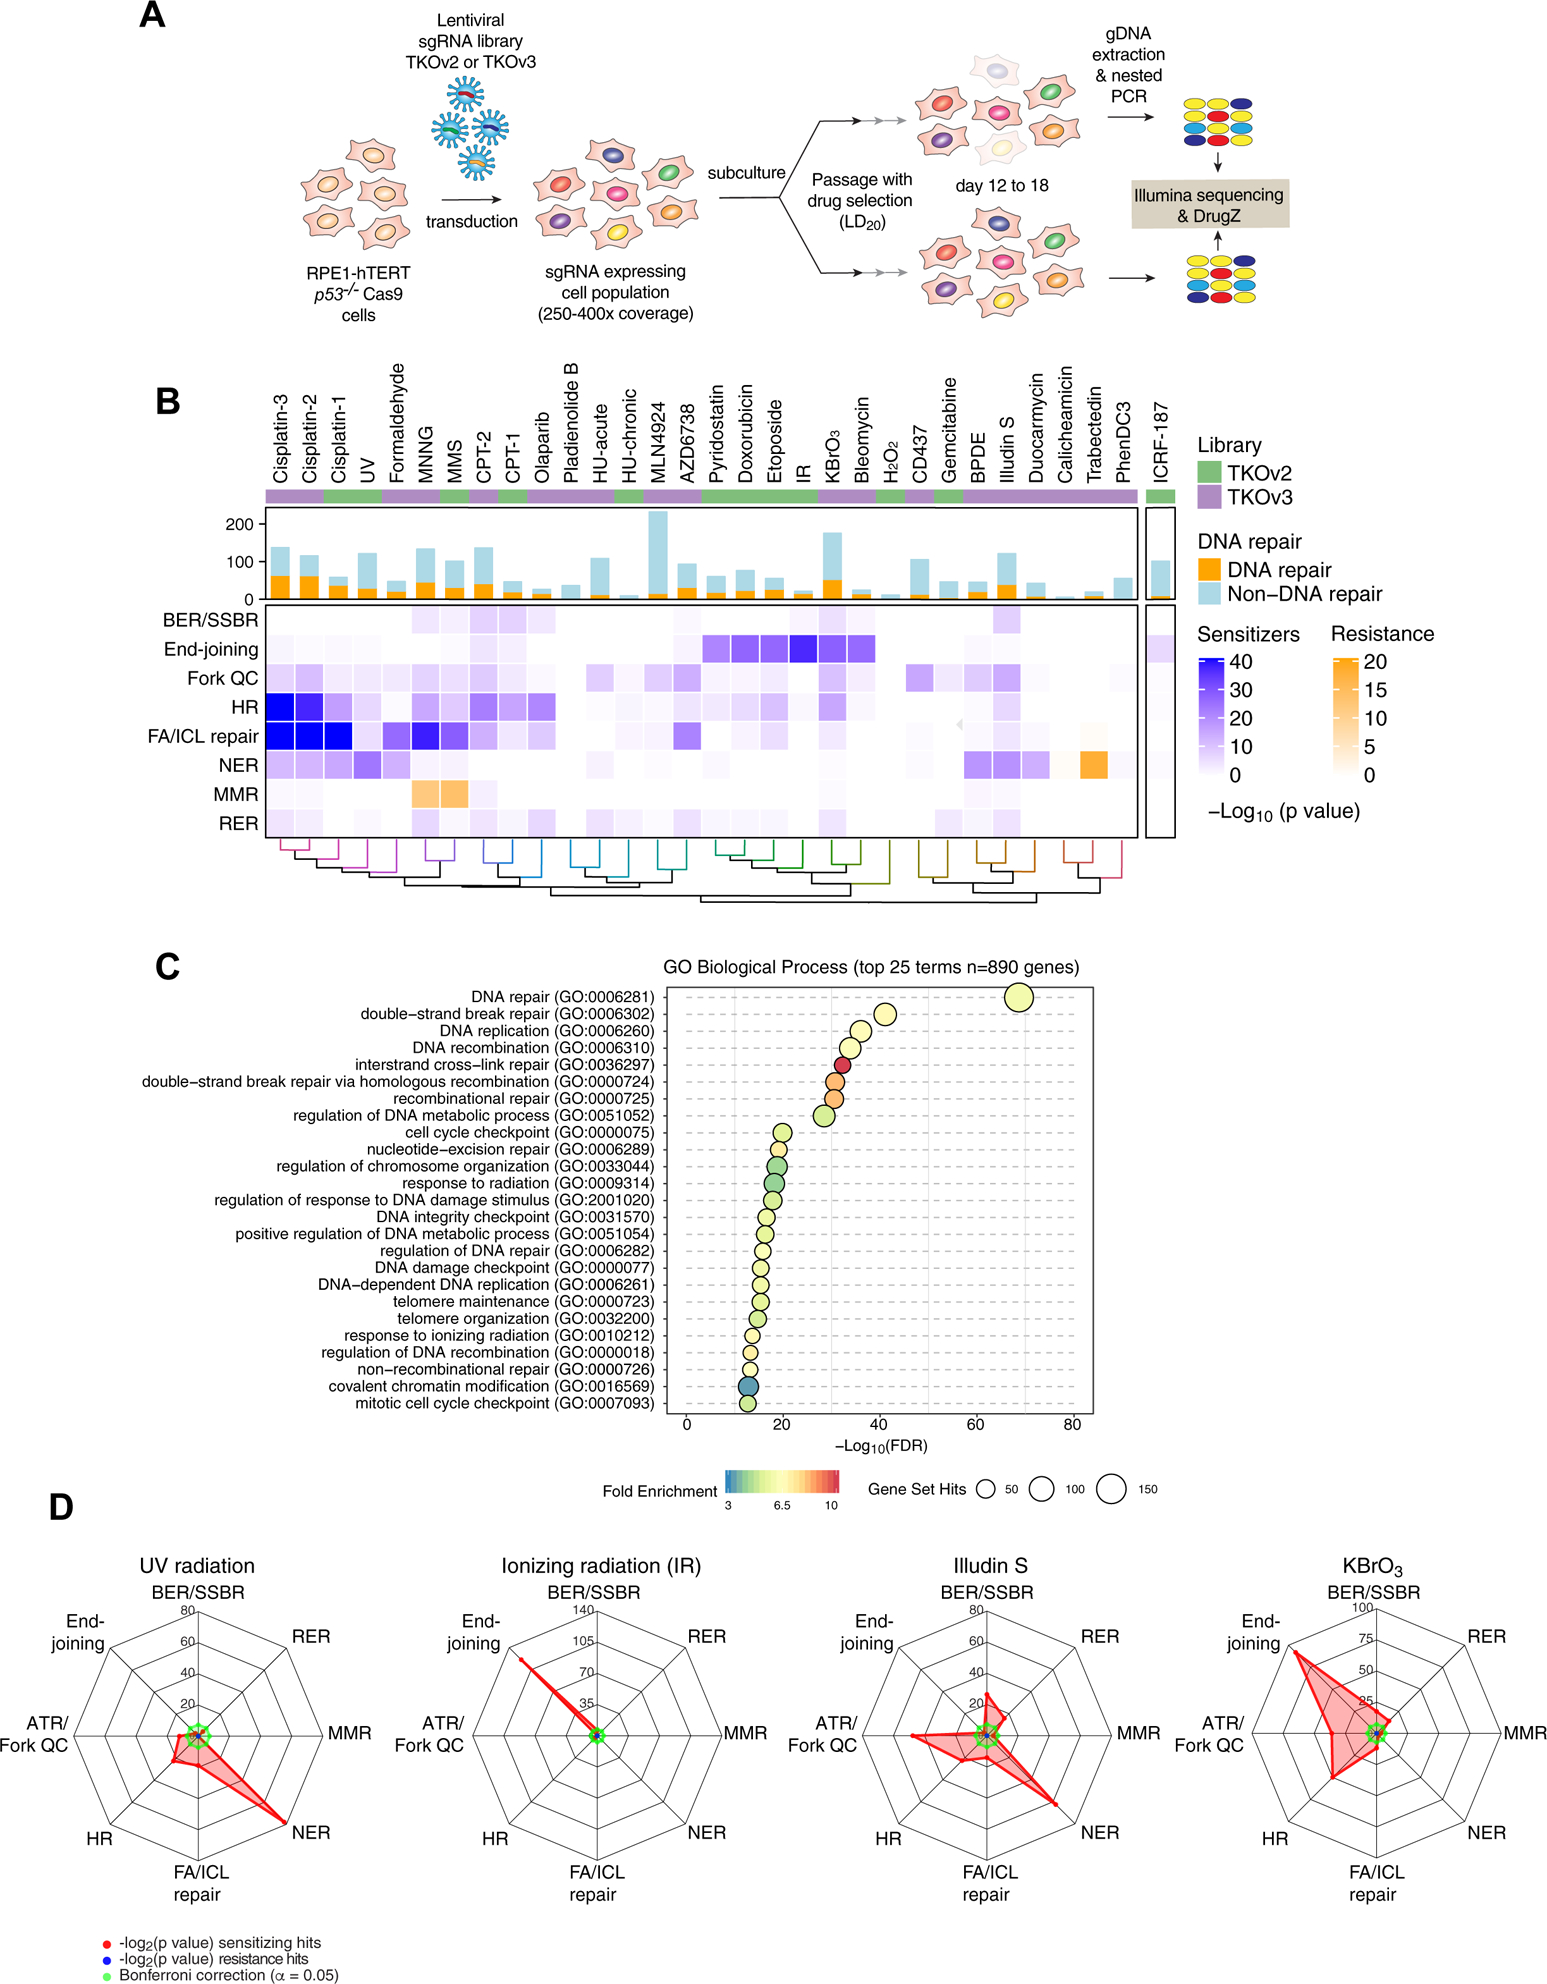
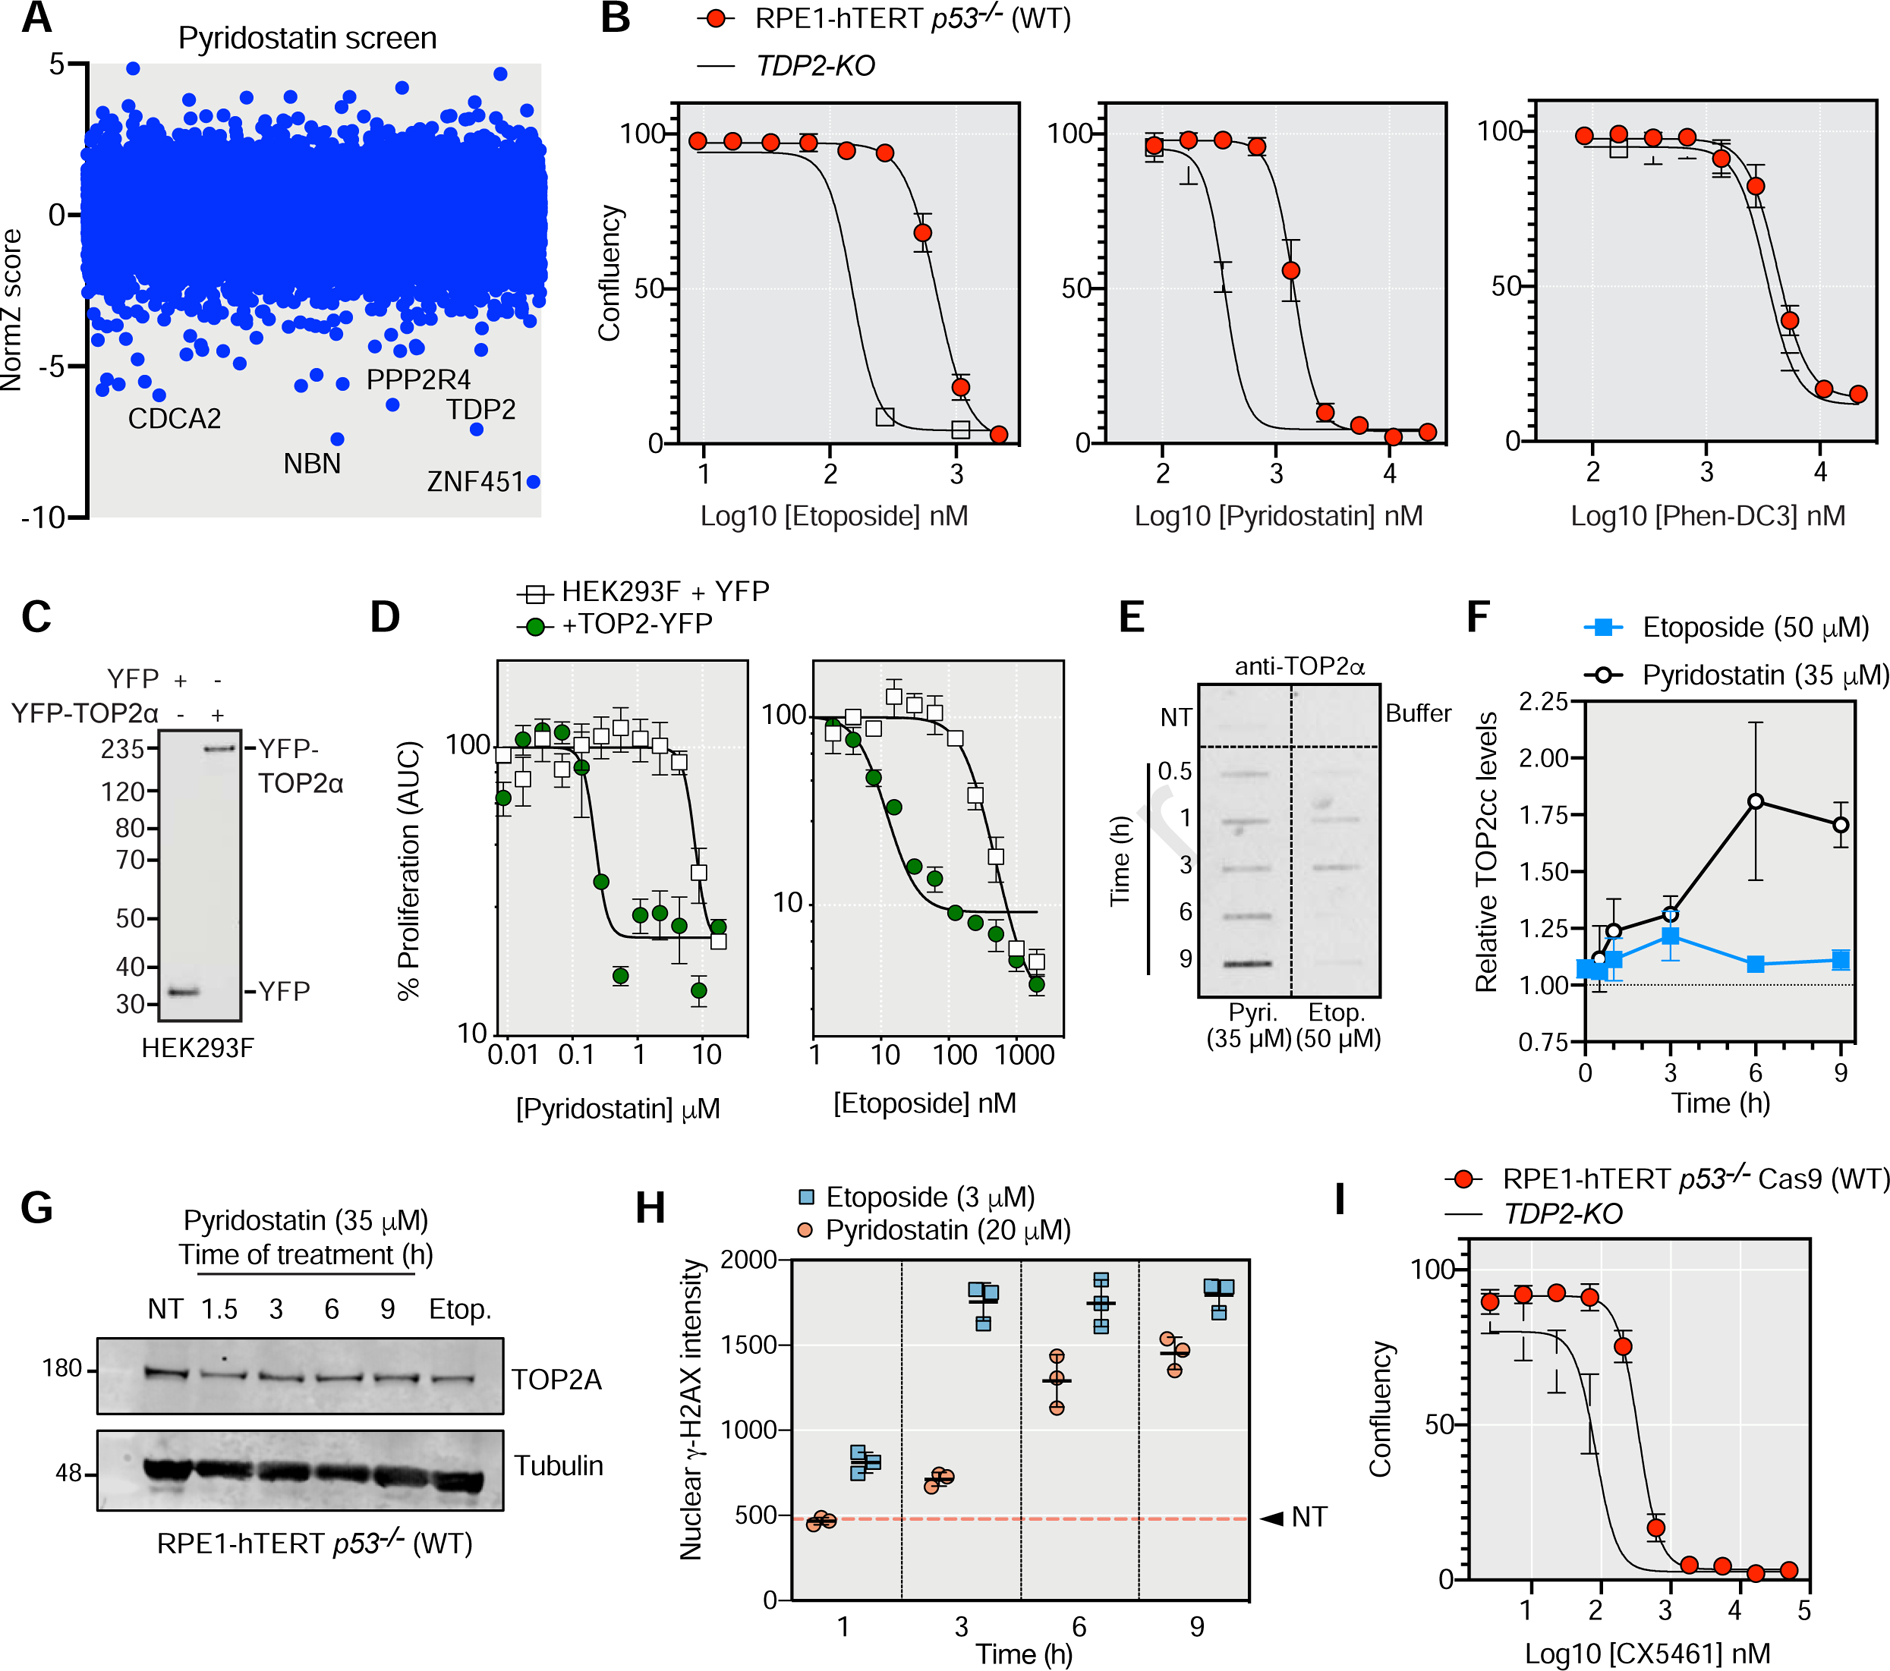
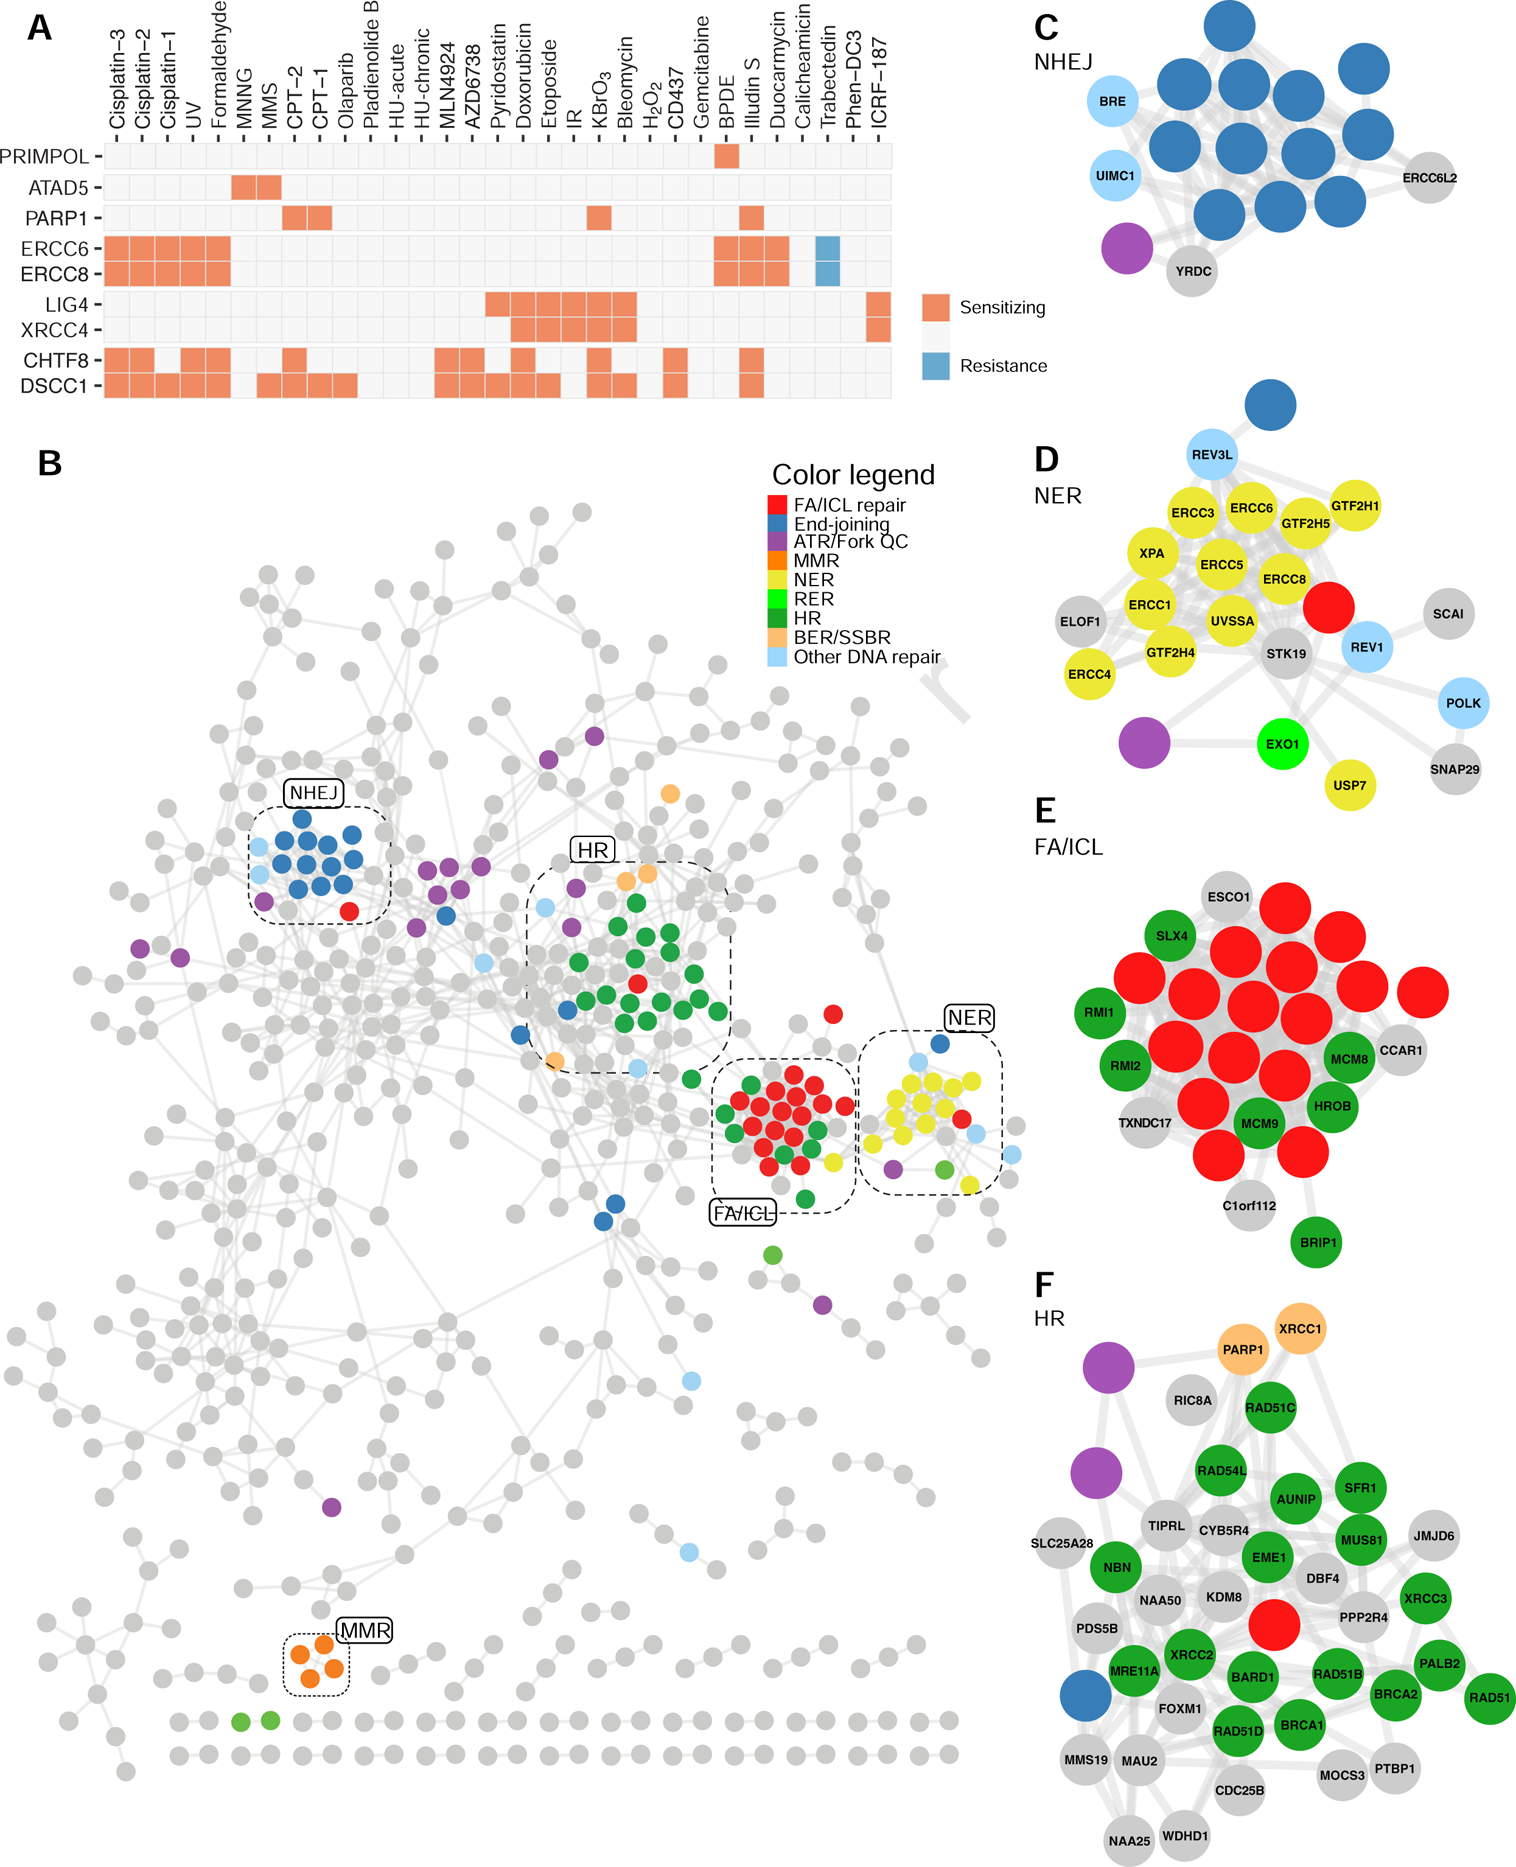
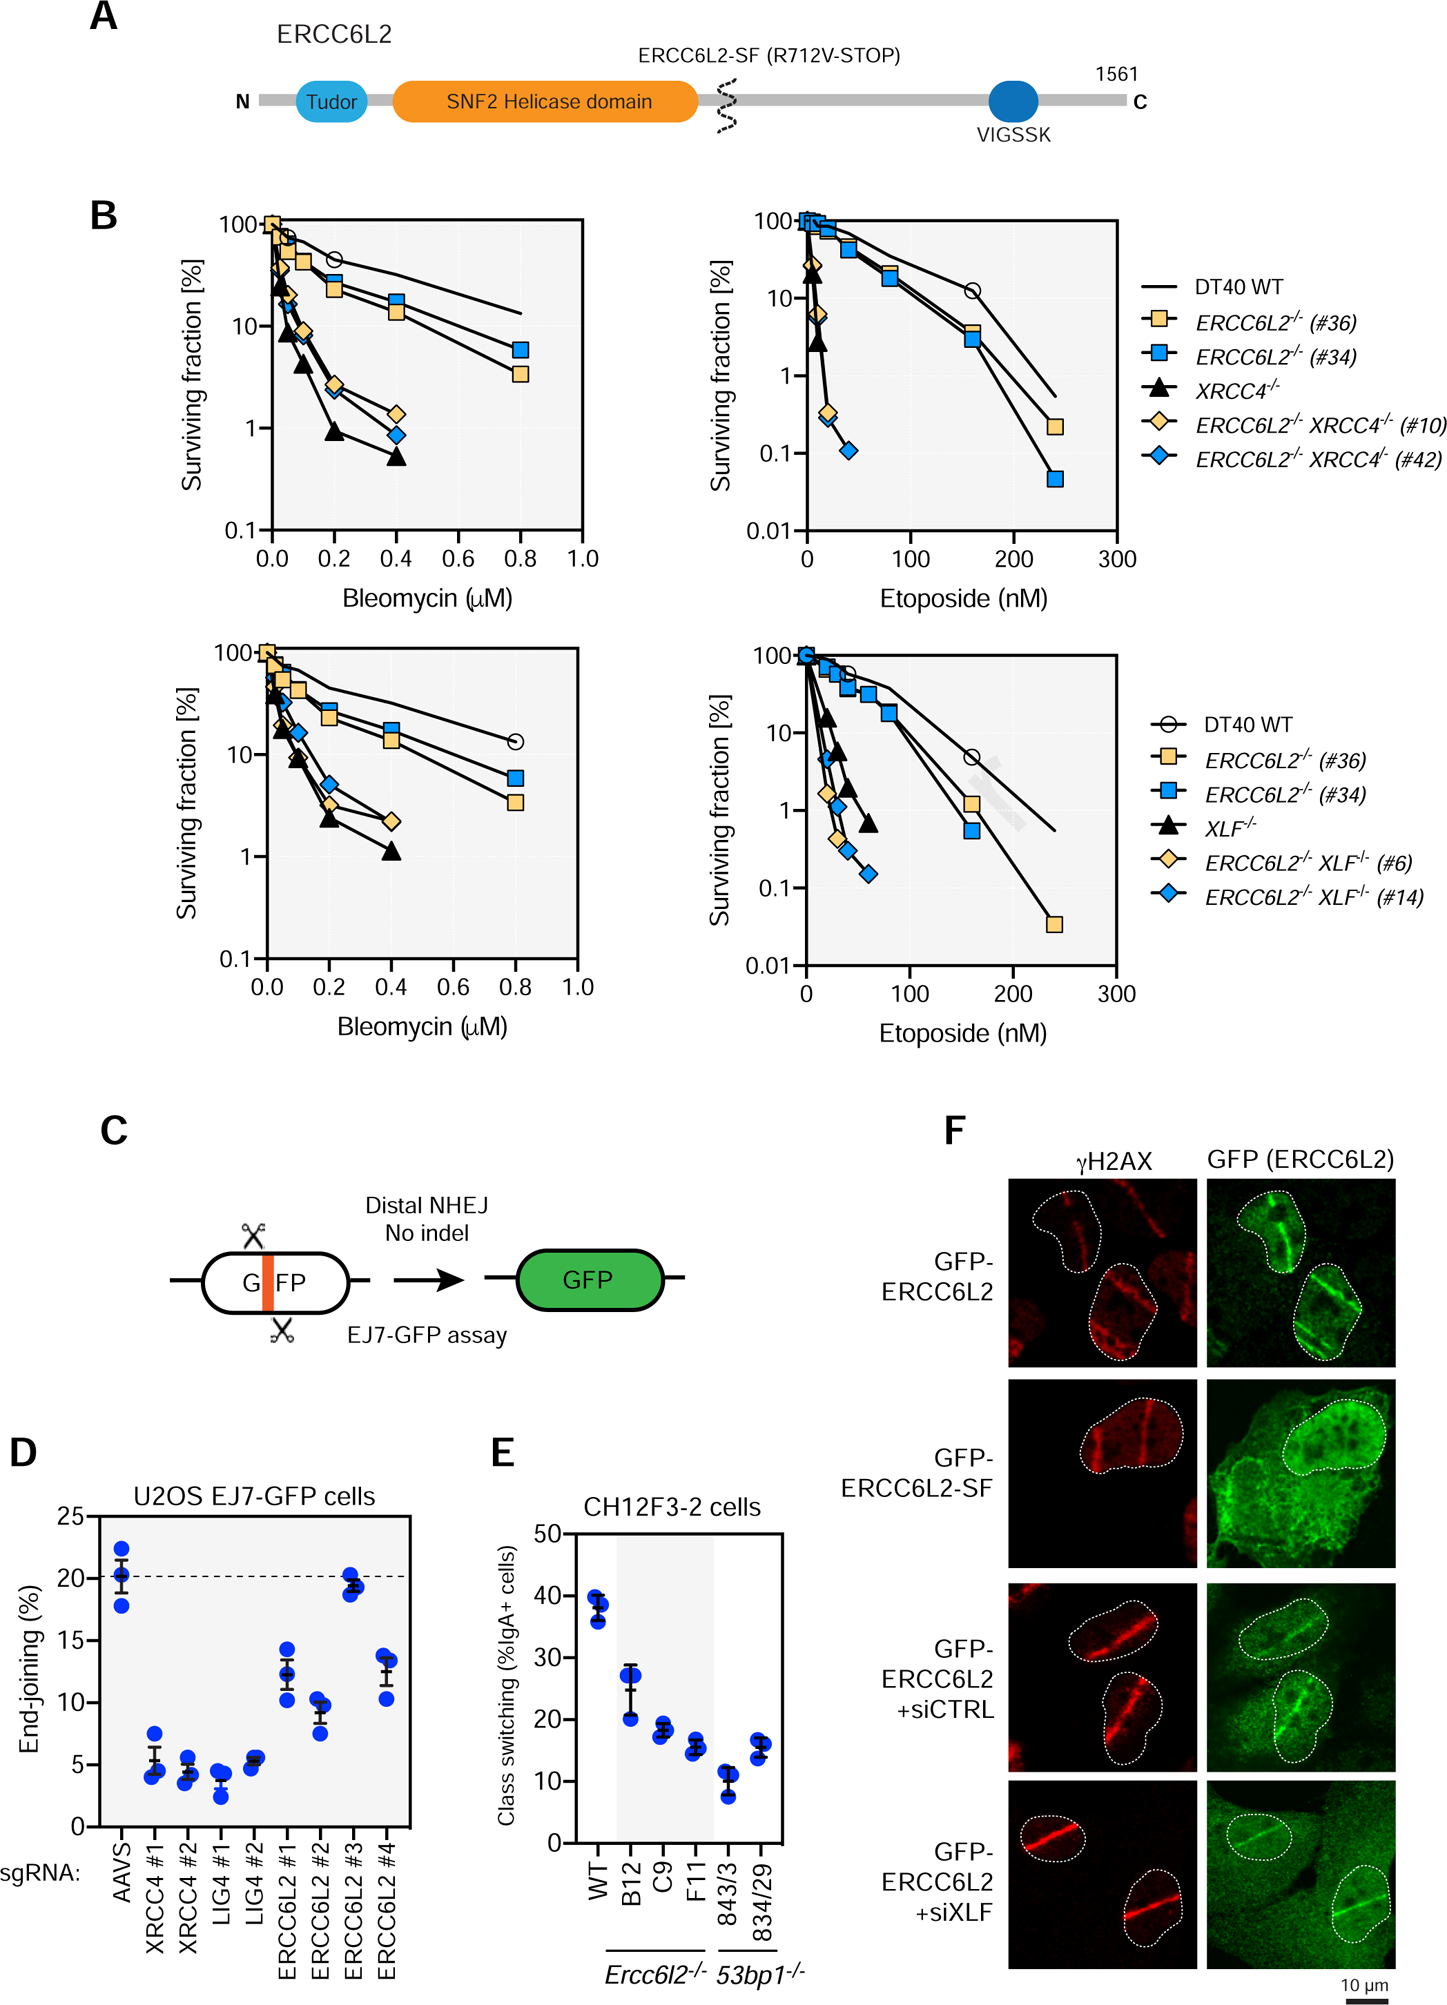
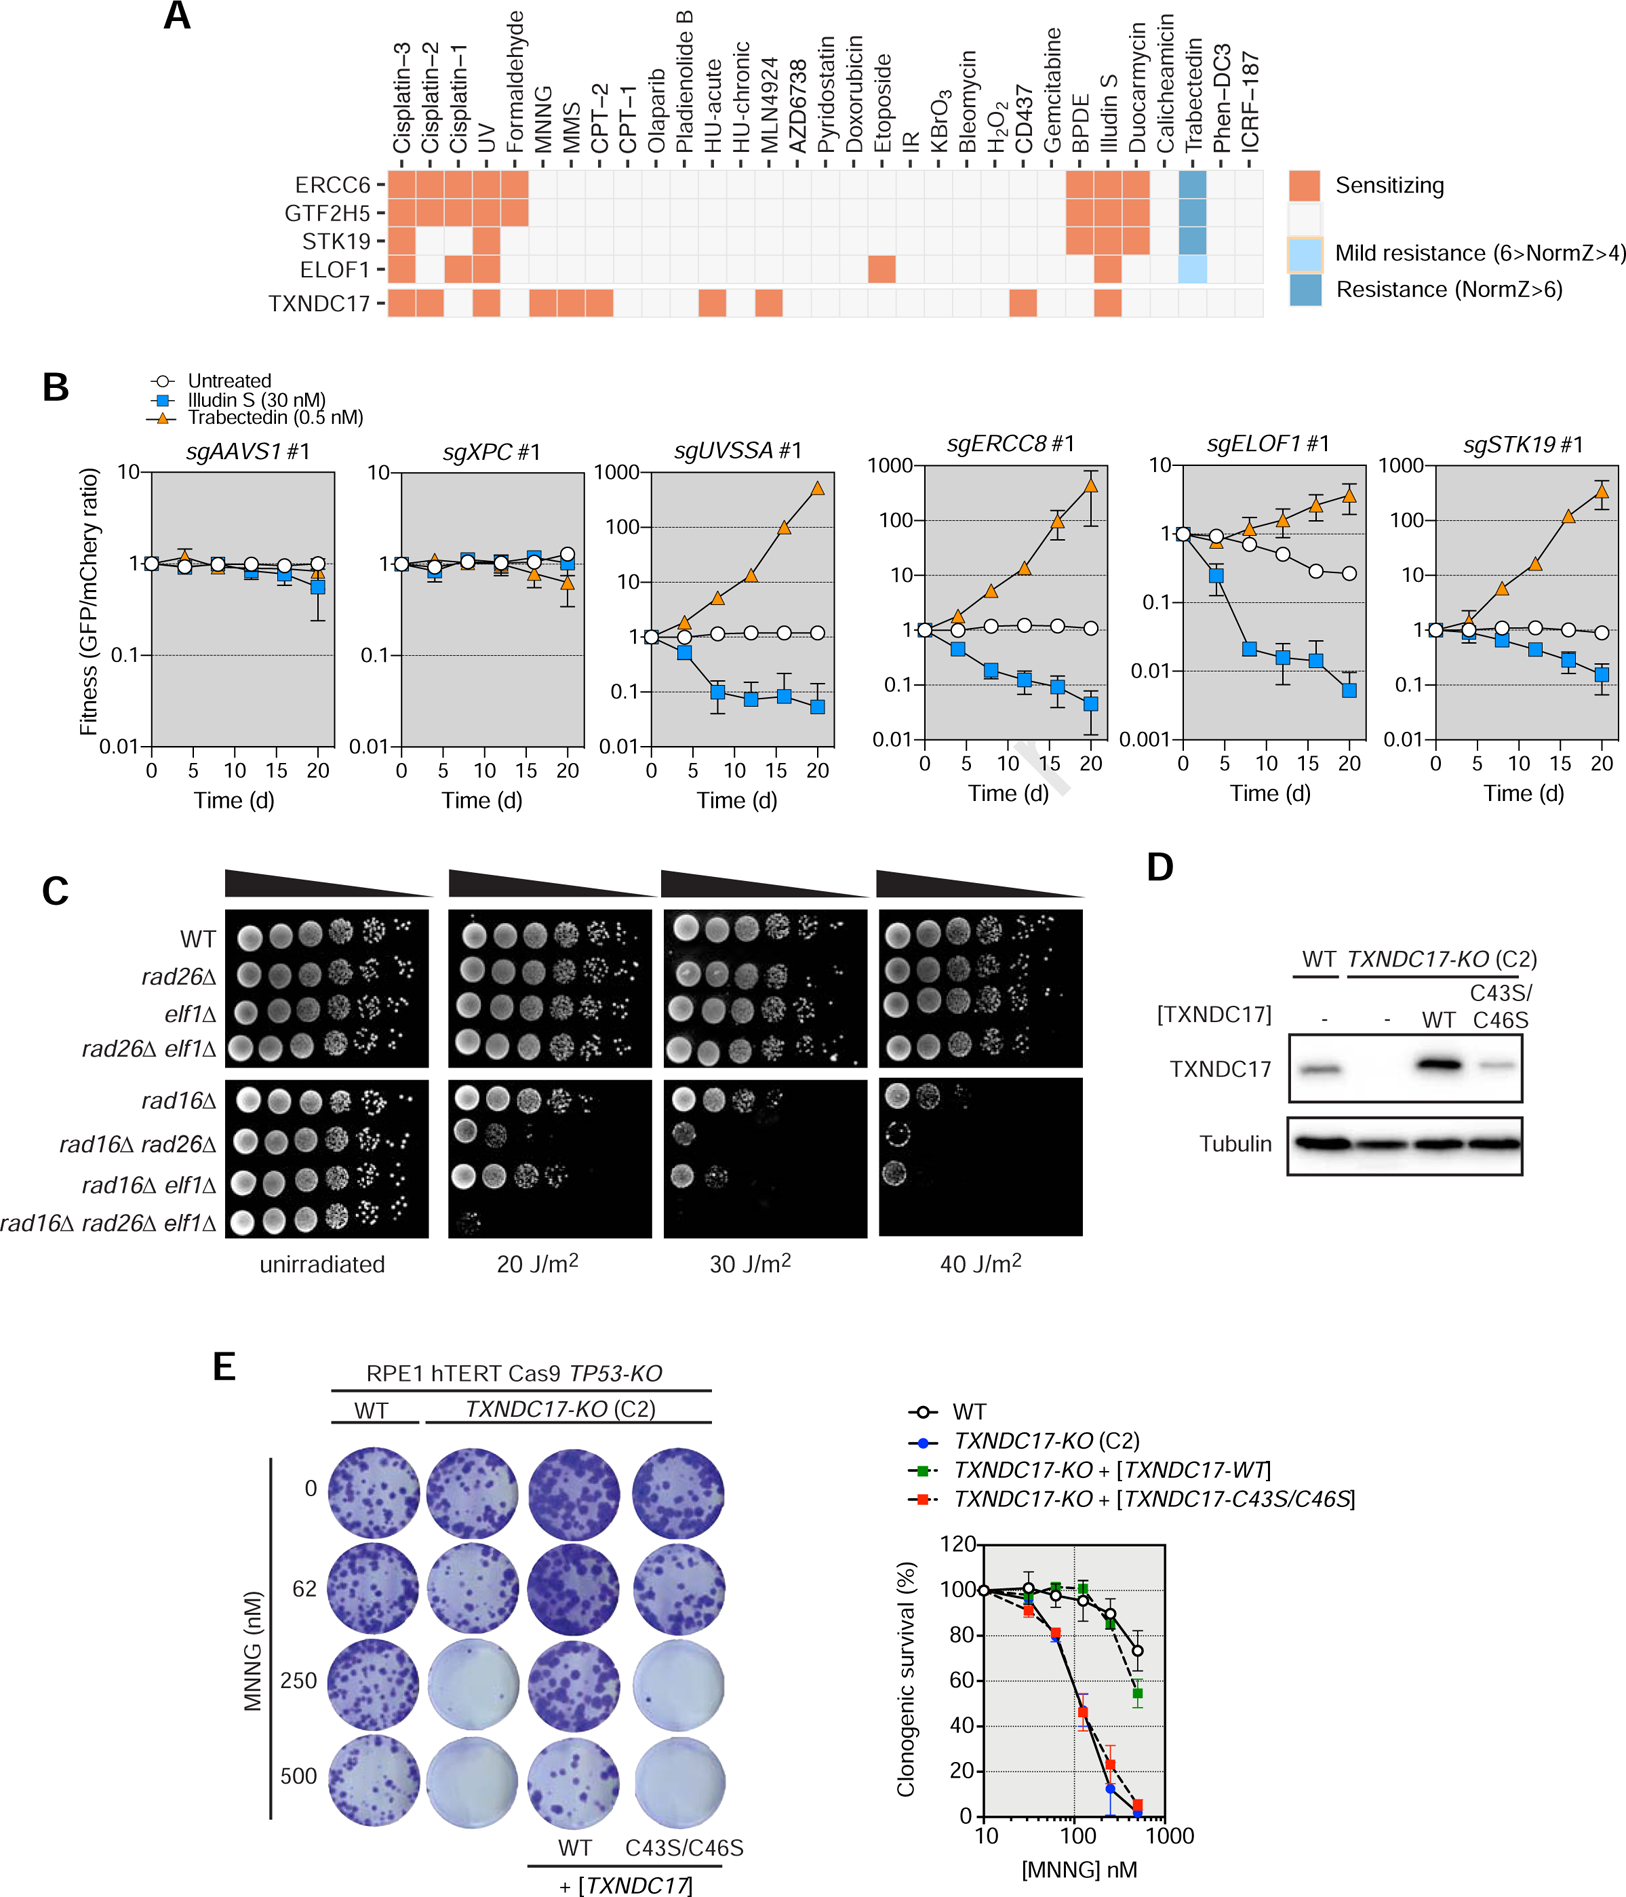
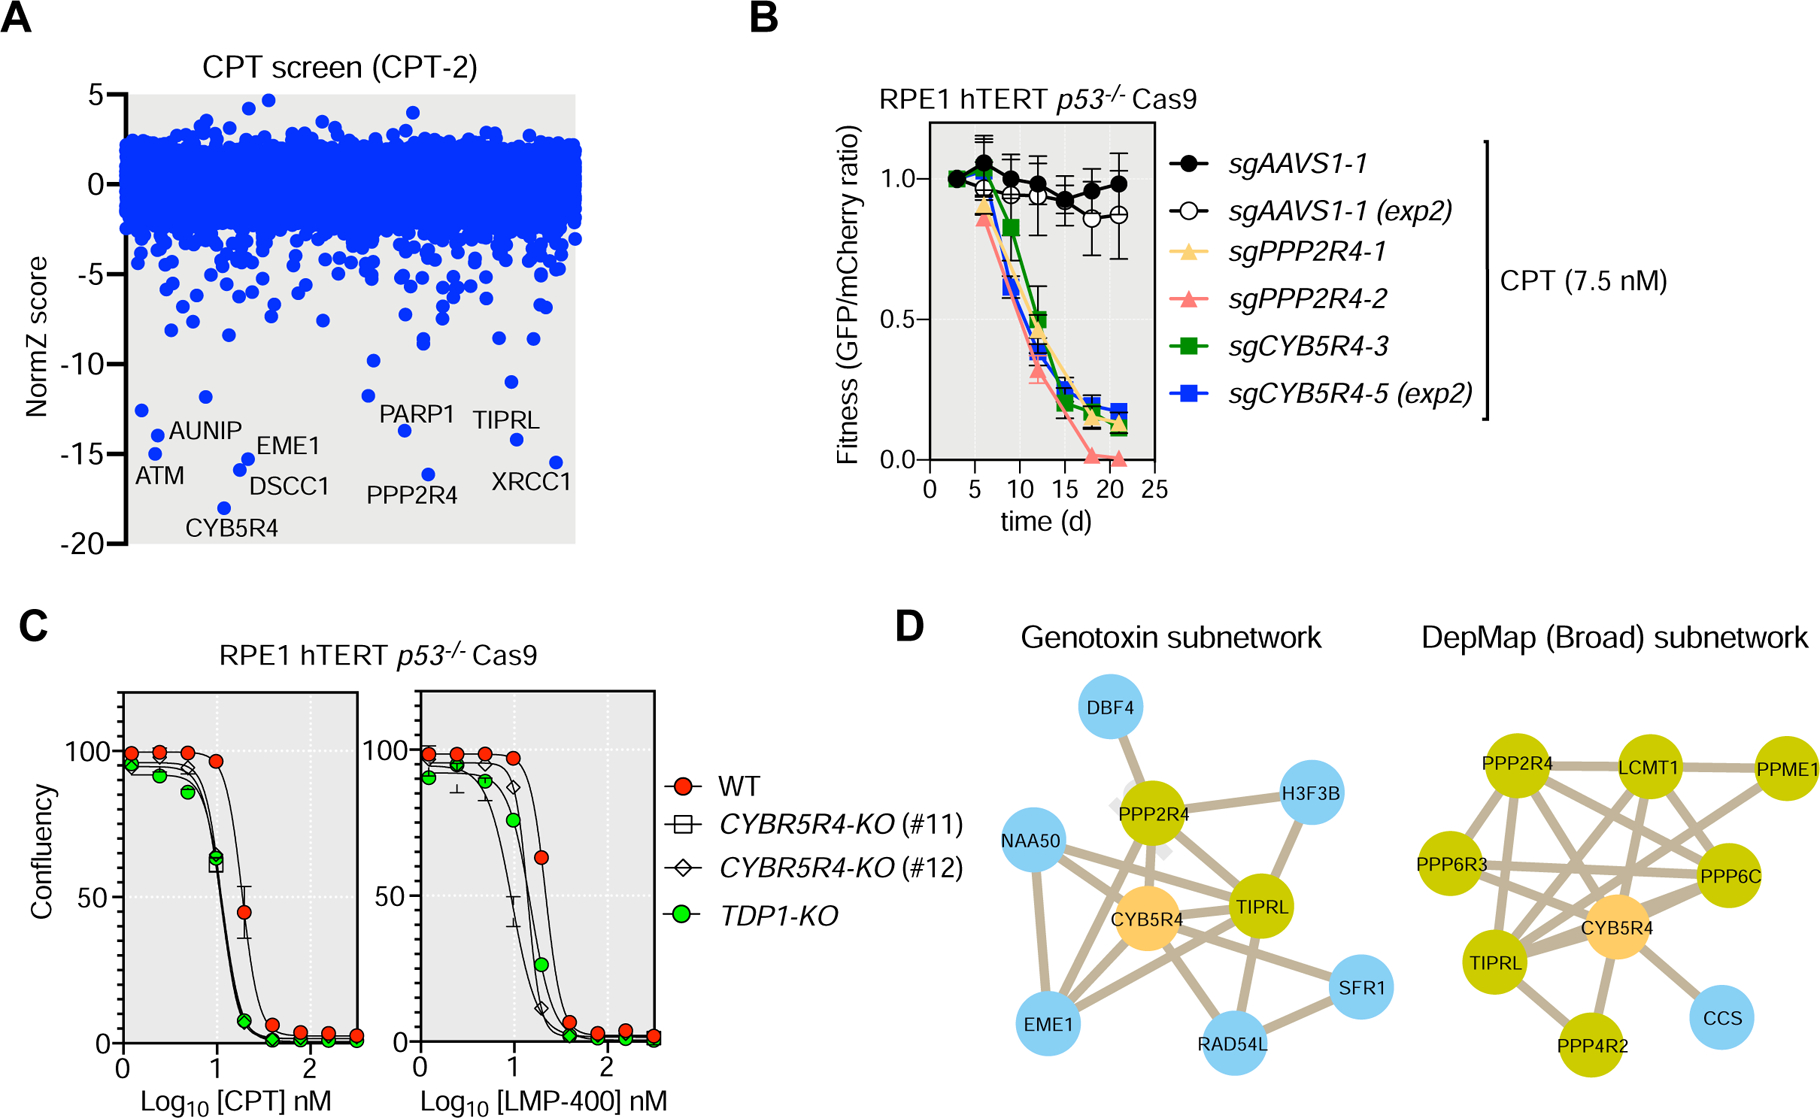
The response to DNA damage is critical for cellular homeostasis, tumor suppression, immunity, and gametogenesis. In order to provide an unbiased and global view of the DNA damage response in human cells, we undertook 31 CRISPR-Cas9 screens against 27 genotoxic agents in the retinal pigment epithelium-1 (RPE1) cell line. These screens identified 890 genes whose loss causes either sensitivity or resistance to DNA-damaging agents. Mining this dataset, we discovered that ERCC6L2 (which is mutated in a bone-marrow failure syndrome) codes for a canonical non-homologous end-joining pathway factor, that the RNA polymerase II component ELOF1 modulates the response to transcription-blocking agents, and that the cytotoxicity of the G-quadruplex ligand pyridostatin involves trapping topoisomerase II on DNA. This map of the DNA damage response provides a rich resource to study this fundamental cellular system and has implications for the development and use of genotoxic agents in cancer therapy.

Keywords: CRISPR; DNA damage; DNA repair; DNA-damaging agents; cancer therapeutics; functional genomics; genome stability; mechanism-of-action.


Conflict of interest statement

Declaration of Interests Michal Zimmermann is an employee and shareholder of Repare Therapeutics. Daniel Durocher is a founder of Repare Therapeutics and a member of its scientific advisory board.

Figures

Figure 1.
Figure 1.. A chemogenomic view of the response to DNA damage.
(A) Schematic of the dropout screens. (B) Heat map representation of the 31 CRISPR screens undertaken in RPE1 hTERT p53−/− Cas9 cells. The histogram indicates the number of hits in each screen and the number of DNA repair factors identified. The lower heat map panel shows the log10-transformed p values for enrichment of different DNA repair pathways (rows) calculated using a one-sided Fisher’s exact test. The color scale indicates fold-enrichment for resistance (orange) and sensitization (blue). Pathways are defined in the text except for ribonucleotide excision repair (RER). (C) Top 25 enriched GO terms, biological process, identified using g:Profiler (>10-fold enrichment; p < 0.05, with Benjamini-Hochberg FDR correction) among all 890 hits. (D) Radar plots of the indicated genotoxic CRISPR screens depicting sensitization (red) or resistance (blue) for different DNA repair pathways. Values indicate the log2-transformed p values of the Fisher’s exact test score. Bonferroni thresholds are in green. See also Figure S1.
Figure 2.
Figure 2.. Pyridostatin cytotoxicity involves TOP2 trapping.
(A) CRISPR dropout screen results for RPE1 cells exposed to pyridostatin. (B) Drug-response assays with the indicated compounds in RPE1 and isogenic TDP2-KO cells using confluency as a readout 6 d post-treatment. Data presented as mean ± SD.; N=3. (C) Immunoblotting of YFP in HEK293F cells expressing TOP2-YFP or a control vector. (D) Drug-response assays with pyridostatin and etoposide in HEK293F cells expressing YFP and those expressing TOP2-YFP. Data presented as mean ± SEM; N=3. (E) RADAR assay for the detection of TOP2cc in RPE1 cells treated with etoposide (Etop.) and pyridostatin (Pyri.). The condition in upper left box represents samples that were untreated (NT). The upper right box represents buffer alone. (F) Quantitation of the RADAR assay normalized to untreated cells. Data presented as mean ± SD; N=3. (G) Immunoblotting for TOP2A in RPE1 cells treated with pyridostatin as indicated. As a control cells were treated with 50 μM of etoposide (Etop.) for 1.5 h. Tubulin was used as a loading control. NT, no treatment. (H) Average γ-H2AX nuclear intensity in RPE1 cells treated with etoposide or pyridostatin determined by image segmentation. The dashed line represents the value for untreated (NT) cells. Data presented as mean ± SD; N=3. (I) Drug-response assays with CX5461 in RPE1 and isogenic TDP2−/− cells using confluency as a readout 6 d post-treatment. Data presented as mean ± SD.; N=3. See also Figure S2.
Figure 3.
Figure 3.. The DNA damage response network.
(A) Fingerprint plot of highlighted genes across the 31 screens (columns). The boxes are labeled according to whether mutations in these genes lead to sensitization (orange) or resistance (blue). (B) Network of genes displaying at least one connection with another gene at a PCC value >0.7. Nodes are colored according to a DNA repair pathway curation (Table S4). Highlighted are the clusters enriched in DNA repair genes. A network with gene names is in Figure S3C. (C-F) Details of the clusters enriched in NHEJ (C), NER (D), FA/ICL (E) or HR (F) pathway coding genes. See also Figures S3 and S4.
Figure 4.
Figure 4.. ERCC6L2 promotes canonical NHEJ.
(A) Schematic overview of ERCC6L2. ERCC6L2 also possess a short isoform of 712 residues produced by alternative splicing. Most disease-associated ERCC6L2 alleles produce proteins that are truncated prior to residue 712. (B) Cell proliferation assays of DT40 cells of the indicated genotypes treated with either etoposide or bleomycin for 3 d. Note that the bleomycin proliferation assays were done as part of the same experiment but were separated for clarity. Data presented as the mean of a technical triplicate. An independent experiment is shown in Figure S5C. (C) Schematic of the EJ7-GFP NHEJ assay. (D) End-joining frequency of U2OS-EJ7 cells following depletion of the indicated genes by gene editing. Dashed line represents the mean of the end-joining frequency of the AAVS1-targeted condition. Data presented as mean ± SD; N=3. TIDE analysis is shown in Table S6. (E) Class switch recombination levels (% IgA+ cells) in CH12F3–2 cells of the indicated genotypes. Data presented as mean ± SD; N=3. (F) U2OS cells transfected with a plasmid encoding either full-length GFP-ERCC6L2 or the short isoform (SF) were subjected to laser microirradiation and then processed for immunofluorescence with GFP and γH2AX antibodies 30 min post-irradiation. The mean percentage of cells (± SD; N=3) with γH2AX- and GFP+ stripes are indicated. See also Figure S5.
Figure 5.
Figure 5.. Characterization of ELOF1, STK19 and TXNDC17.
(A) Fingerprint plots of ERCC6, GTF2H5, STK19, ELOF1 and TXNDC17. (B) Competitive growth assays with or without illudin S (30 nM) or trabectedin (0.5 nM) treatment in RPE1 cells transduced with virus expressing the indicated sgRNAs. Data represent mean fraction of GFP+ cells ± SD normalized to day 0 (N= 3, independent transductions). TIDE analysis is shown in Table S6. (C) Cultures of S. cerevisiae strains with the indicated genotype were serially diluted and spotted onto YPD plates that were irradiated with the indicated UV dose, or left untreated. Plates were incubated at 30°C for 3 d before imaging. WT, wild type. (D) Immunoblotting for TXNDC17 in wild type (WT) or TXNDC17-KO cells transduced with the indicated TXNDC17-encoding viruses. Tubulin was used as a loading control. (E) Clonogenic survival of RPE1 cells of the indicated genotypes in response to MNNG. Representative images are shown (left) and quantified (right). Data represent mean ± SD (N = 3). See also Figure S6.
Figure 6.
Figure 6.. CYB5R4 promotes resistance to TOP1 poisons.
(A) CRISPR dropout screen results for RPE1 cells exposed to camptothecin (screen CPT-2). (B) Competitive growth assays with camptothecin (CPT; 7.5 nM) treatment in RPE1 cells transduced with virus expressing the indicated sgRNAs. Data represent mean fraction of GFP-positive cells ± SD normalized to day 0 (N= 3, independent transductions). TIDE analysis is shown in Table S6. See Figure S7AB. (C) Drug-response assays with camptothecin (CPT) and LMP-400 in RPE1 cells and isogenic TDP1-KO and CYB5R4-KO clones using confluency as a readout 6 d post-treatment. Data presented as mean ± SD.; N=3, independent experiments. (D) Subnetworks derived from the PCC genotoxin network derived in this study or from the DepMap data.

Comment in

References

    1. Amendola PG, Zaghet N, Ramalho JJ, Vilstrup Johansen J, Boxem M, and Salcini AE (2017). JMJD-5/KDM8 regulates H3K36me2 and is required for late steps of homologous recombination and genome integrity. PLoS Genet 13, e1006632. - PMC - PubMed
    1. Anand J, Sun Y, Zhao Y, Nitiss KC, and Nitiss JL (2018). Detection of Topoisomerase Covalent Complexes in Eukaryotic Cells. Methods Mol Biol 1703, 283–299. - PubMed
    1. Aparicio T, Baer R, Gottesman M, and Gautier J (2016). MRN, CtIP, and BRCA1 mediate repair of topoisomerase II-DNA adducts. J Cell Biol 212, 399–408. - PMC - PubMed
    1. Arnoult N, Correia A, Ma J, Merlo A, Garcia-Gomez S, Maric M, Tognetti M, Benner CW, Boulton SJ, Saghatelian A, et al. (2017). Regulation of DNA repair pathway choice in S and G2 phases by the NHEJ inhibitor CYREN. Nature 549, 548–552. - PMC - PubMed
    1. Ballmaier D, and Epe B (2006). DNA damage by bromate: mechanism and consequences. Toxicology 221, 166–171. - PubMed

Publication types

MeSH terms