. 2020 Jul 9;182(1):200-225.e35.
doi: 10.1016/j.cell.2020.06.013.

Proteogenomic Characterization Reveals Therapeutic Vulnerabilities in Lung Adenocarcinoma

Michael A Gillette  1 Shankha Satpathy  2 Song Cao  3 Saravana M Dhanasekaran  4 Suhas V Vasaikar  5 Karsten Krug  6 Francesca Petralia  7 Yize Li  3 Wen-Wei Liang  3 Boris Reva  7 Azra Krek  7 Jiayi Ji  8 Xiaoyu Song  8 Wenke Liu  9 Runyu Hong  9 Lijun Yao  3 Lili Blumenberg  10 Sara R Savage  11 Michael C Wendl  3 Bo Wen  11 Kai Li  11 Lauren C Tang  12 Melanie A MacMullan  13 Shayan C Avanessian  6 M Harry Kane  6 Chelsea J Newton  14 MacIntosh Cornwell  10 Ramani B Kothadia  6 Weiping Ma  7 Seungyeul Yoo  7 Rahul Mannan  4 Pankaj Vats  4 Chandan Kumar-Sinha  4 Emily A Kawaler  9 Tatiana Omelchenko  15 Antonio Colaprico  16 Yifat Geffen  6 Yosef E Maruvka  6 Felipe da Veiga Leprevost  4 Maciej Wiznerowicz  17 Zeynep H Gümüş  7 Rajwanth R Veluswamy  18 Galen Hostetter  14 David I Heiman  6 Matthew A Wyczalkowski  3 Tara Hiltke  19 Mehdi Mesri  19 Christopher R Kinsinger  19 Emily S Boja  19 Gilbert S Omenn  20 Arul M Chinnaiyan  4 Henry Rodriguez  19 Qing Kay Li  21 Scott D Jewell  14 Mathangi Thiagarajan  22 Gad Getz  6 Bing Zhang  11 David Fenyö  9 Kelly V Ruggles  10 Marcin P Cieslik  4 Ana I Robles  19 Karl R Clauser  6 Ramaswamy Govindan  23 Pei Wang  7 Alexey I Nesvizhskii  24 Li Ding  3 D R Mani  6 Steven A Carr  25 Clinical Proteomic Tumor Analysis Consortium
Collaborators, Affiliations

Proteogenomic Characterization Reveals Therapeutic Vulnerabilities in Lung Adenocarcinoma

Michael A Gillette et al. Cell. .

Abstract

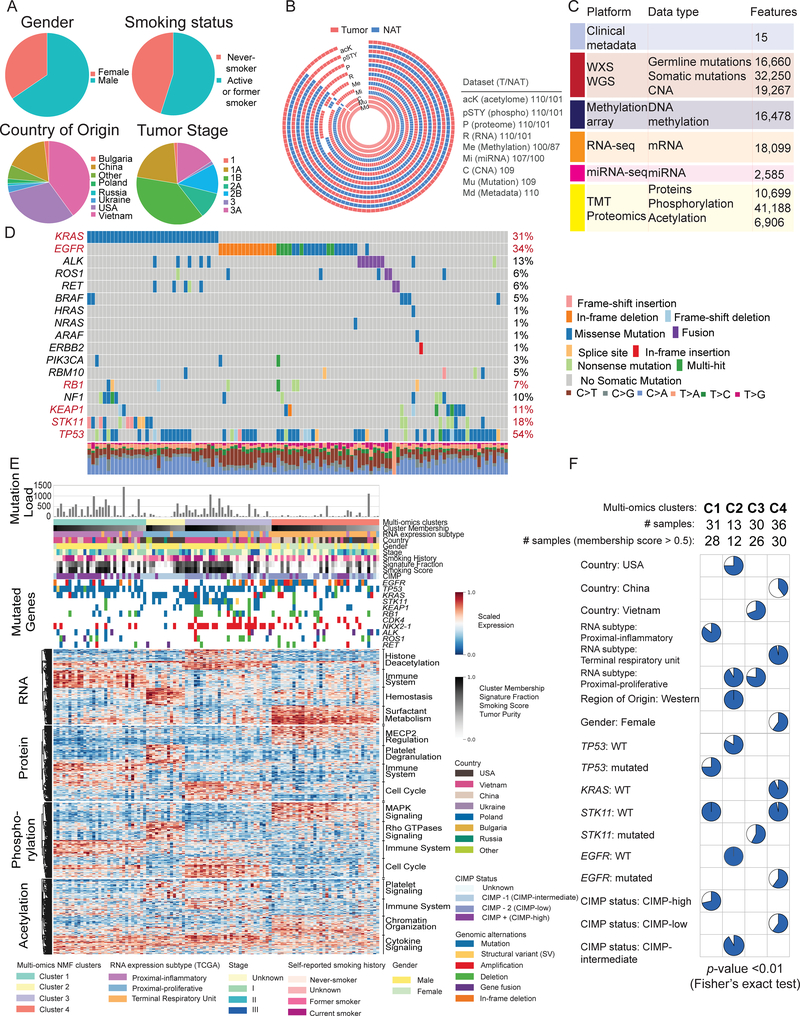
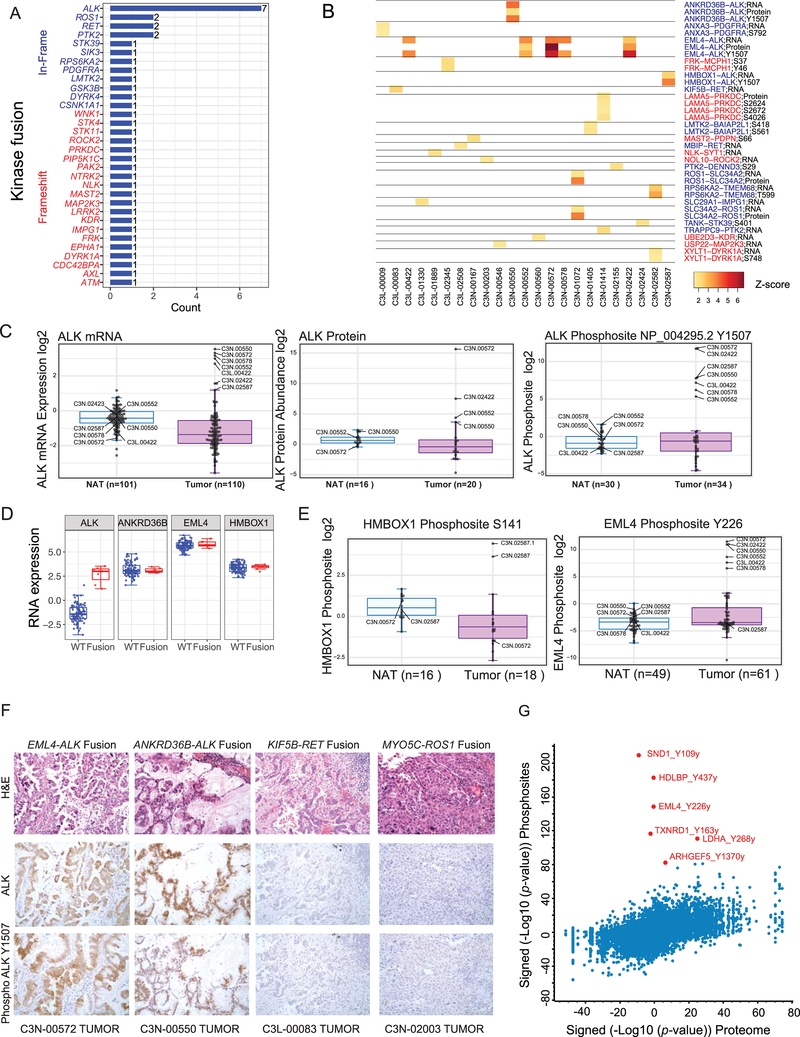
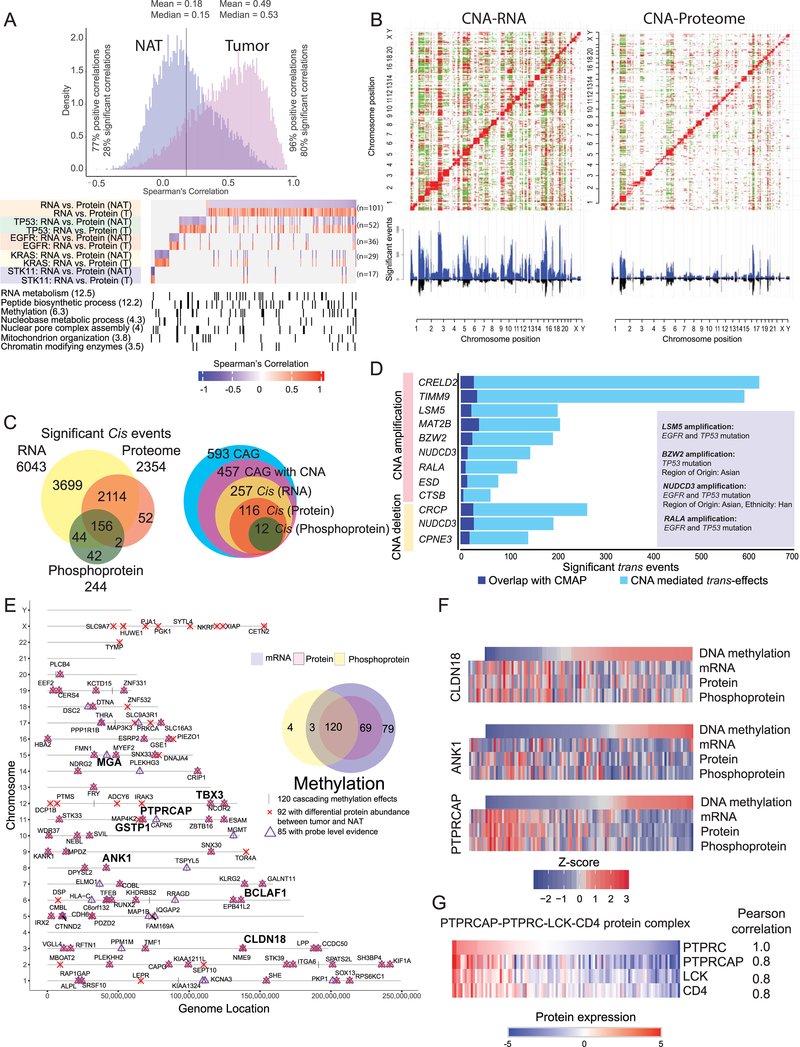
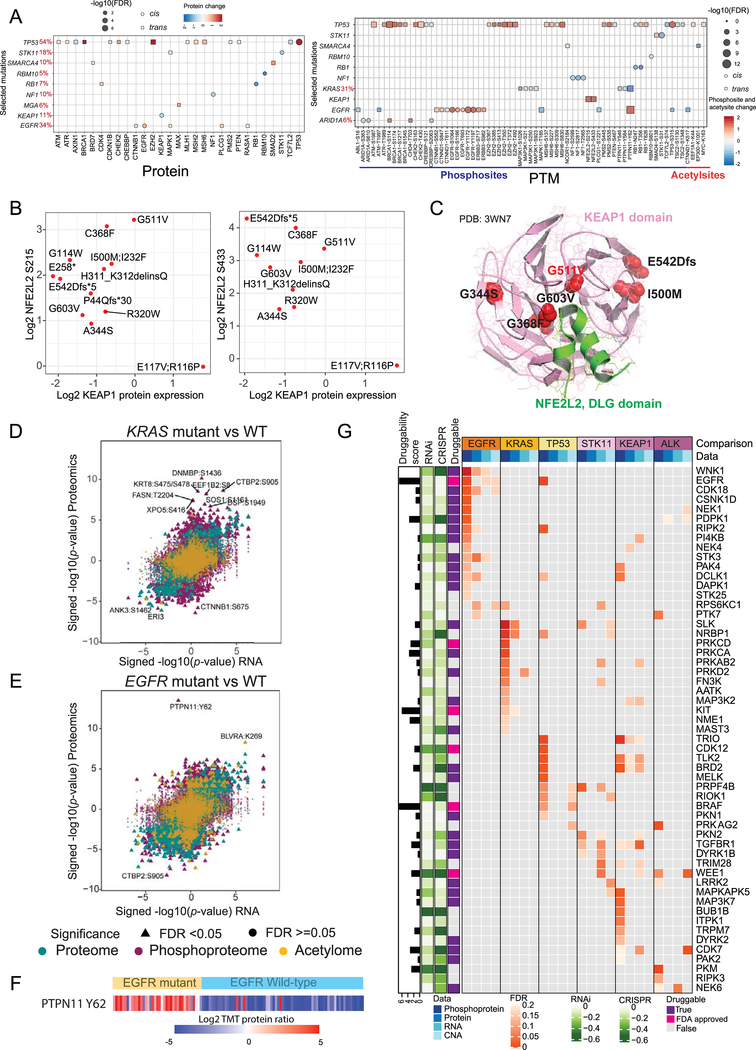
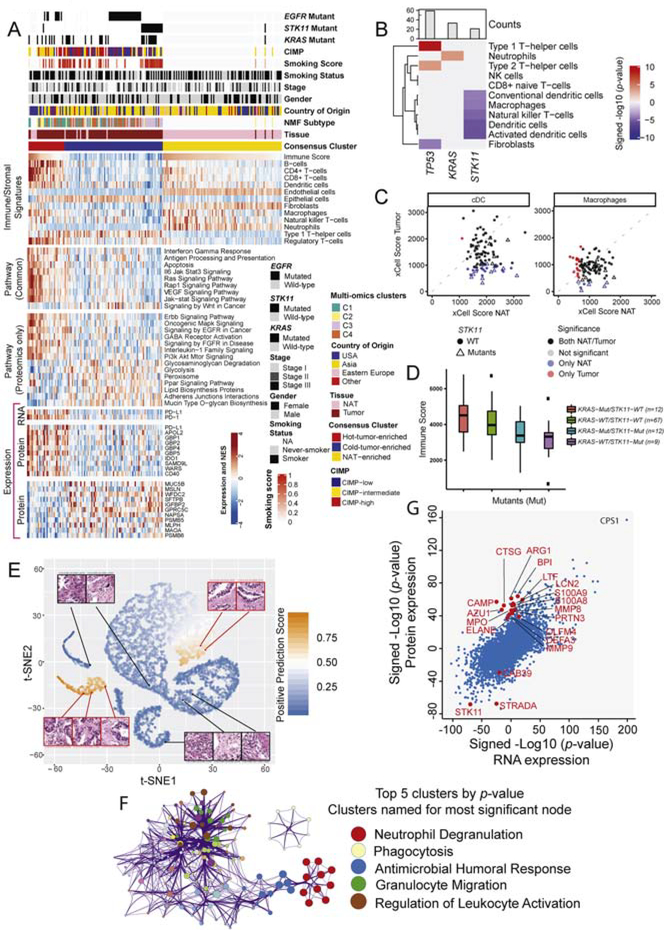
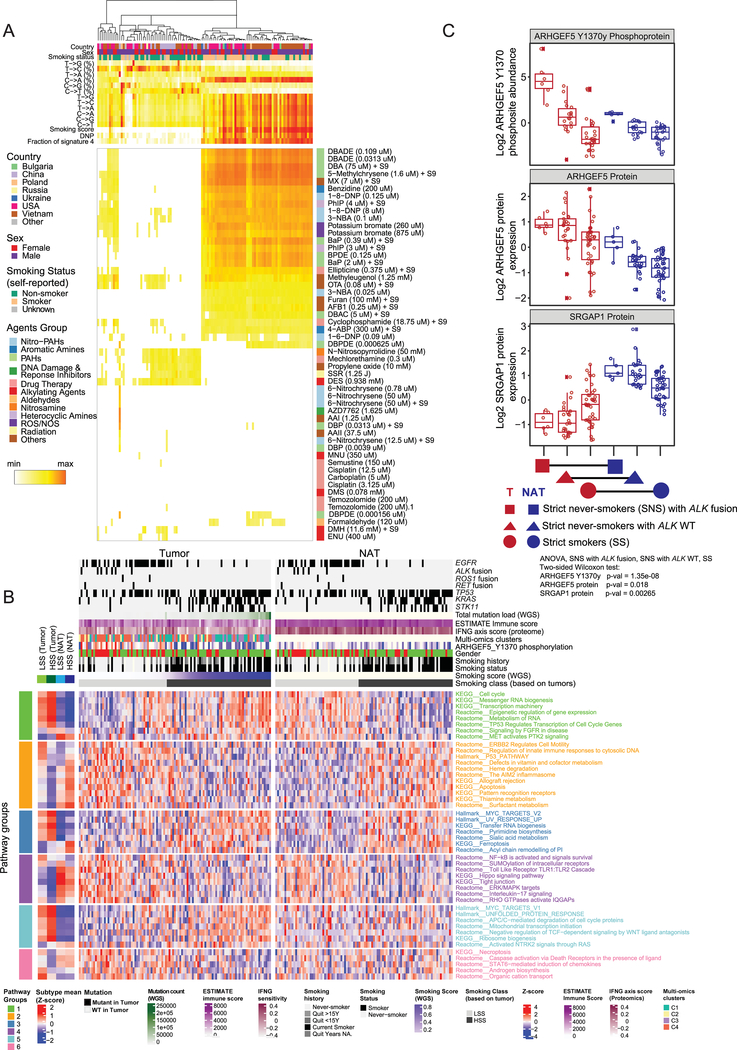
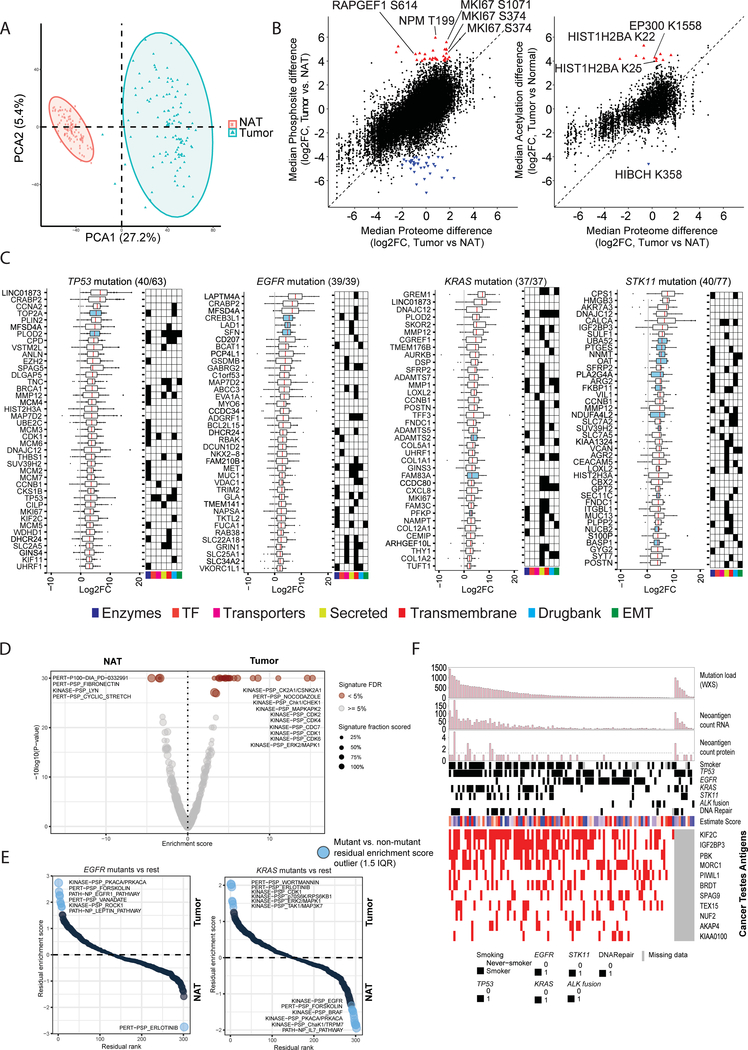
To explore the biology of lung adenocarcinoma (LUAD) and identify new therapeutic opportunities, we performed comprehensive proteogenomic characterization of 110 tumors and 101 matched normal adjacent tissues (NATs) incorporating genomics, epigenomics, deep-scale proteomics, phosphoproteomics, and acetylproteomics. Multi-omics clustering revealed four subgroups defined by key driver mutations, country, and gender. Proteomic and phosphoproteomic data illuminated biology downstream of copy number aberrations, somatic mutations, and fusions and identified therapeutic vulnerabilities associated with driver events involving KRAS, EGFR, and ALK. Immune subtyping revealed a complex landscape, reinforced the association of STK11 with immune-cold behavior, and underscored a potential immunosuppressive role of neutrophil degranulation. Smoking-associated LUADs showed correlation with other environmental exposure signatures and a field effect in NATs. Matched NATs allowed identification of differentially expressed proteins with potential diagnostic and therapeutic utility. This proteogenomics dataset represents a unique public resource for researchers and clinicians seeking to better understand and treat lung adenocarcinomas.

Keywords: CPTAC; acetylation; adenocarcinoma; genomics; lung cancer; mass spectrometry; phosphorylation; protein; proteogenomics; proteomics.


Conflict of interest statement

Declaration of Interests B.Z. has received research funding from Bristol-Myers Squibb. All other authors have no conflict of interests to declare.

Figures

Figure 1:
Figure 1:. Genomic and proteomic landscape of lung adenocarcinoma (LUAD).
(A) Pie charts of key demographic and histologic features, along with self-reported smoking status of LUAD patient samples characterized in this study. (B) Patient-centric circos plot representing the multi-platform data generated in this study. White gaps in the schematic represent missing data. Numbers to the right indicate samples in each of the categories. (C) Summary of data and metadata generated in this study. (D) Oncoplot generated with maftools depicting mutually exclusive driver oncogene somatic mutations in KRAS, EGFR, other RAS/RAF pathway genes and receptor tyrosine kinase gene fusions in the CPTAC LUAD cohort along with their frequencies. Rows represent genes and columns represent samples. Somatic mutations in tumor suppressor genes (NF1, KEAP1, STK11 and TP53) are also depicted. The significantly mutated genes with Benjamini Hochberg (BH) FDR <0.01 are indicated in red. Percentages of transitions/transversions noted in each sample are depicted in the bar plots. (E) Integrative classification of tumor samples into four NMF-derived clusters (multi-omics cluster-1 (C1) to cluster-4 (C4)). Within each cluster, tumors are sorted by cluster membership scores, decreasing from left to right. “RNA expression subtype” shows classification by previously published RNA-seq-based expression subtypes (TCGA LUAD analysis). The heatmap shows the top 50 differential mRNA transcripts, proteins, phosphoproteins, and acetylated proteins for each multi-omics cluster, annotated for representative pathways. (F) Pie charts show sample distribution of metadata terms that are significantly overrepresented (Fisher’s exact test) within the most representative “core” cluster members (membership score > 0.5) that define each cluster. See also Figure S1 and Table S1–3
Figure 2:
Figure 2:. Novel phosphoproteomic aberrations associated with ALK gene fusions.
(A) Summary of all kinase gene fusions identified from RNA-seq analysis. (B) RNA expression, protein abundance and specific phosphosite modifications noted to be outliers in the index fusion event sample relative to all other samples. (C) Boxplot showing outlier expression of ALK RNA, protein and the ALK Y1507 phosphosite in tumors with ALK fusion. Blue: Normal adjacent tissues (NAT); Pink: Tumor samples. Sample IDs of outlier cases are indicated. (D) Boxplot showing overexpression of ALK mRNA observed in fusion-positive (Red) versus - negative (Blue) tumors. The three 5’ partners show comparably high expression in both fusion-positive and -negative tumors, as expected. (E) Boxplot showing the phosphorylation of two ALK fusion partners, HMBOX1 and EML4, in the indicated index cases. (F) Immunohistochemistry reveals upregulation of both total ALK and the ALK Y1507 phosphosite specifically in the tumor epithelia of ALK fusion-positive samples. No staining was seen in RET or ROS1 fusion samples or in matched NATs (Figure S2C). (G) Scatterplot of significantly regulated phosphosites and their corresponding protein expression in tumors with and without ALK fusion. Phosphosites showing distinct upregulation in ALK fusion samples are highlighted in red. See also Figure S2
Figure 3:
Figure 3:. Impact of copy number alteration (CNA) and DNA methylation on protein and phosphoprotein expression.
(A) Correlation between steady-state mRNA and protein abundances in tumors and NATs (n=101 pairs) for genes with discrepant tumor/normal mRNA-protein correlations. Bottom panel represents enriched biological terms, with -Log10 (p-value) in brackets. (B) Correlation plots between CNA and RNA expression and between CNA and protein abundance. Significant (FDR <0.05) positive and negative correlations are indicated in red and green, respectively. CNA-driven cis-effects appear as the red diagonal line; trans-effects appear as vertical red and green lines. The accompanying histograms show the number of significant (FDR <0.05) cis- and trans-events corresponding to the indicated genomic loci (upward plot) as well as the overlap between CNA-RNA and CNA-protein events (downward plot). (C) Venn diagrams depicting the cascading effects of CNAs. The Venn diagram on the left shows the overlap between significant cis-events across the transcriptome, proteome and phosphoproteome. The Venn diagram on the right shows the same analysis restricted to cancer-associated genes (CAG) with significant cis-effects across multiple data types. (D) Genes with CNA events that show significant similarity (BH FDR <0.1) between their significant trans-effects (FDR <0.05) and the Connectivity Map (CMAP) genomic perturbation profiles. Inset shows significant enrichment (Fisher’s exact test, FDR <0.1) for specific mutational or demographic features for 4 genes. (E) Genes whose DNA methylation was associated with cascading cis-regulation of their cognate mRNA expression, global protein level and phosphopeptide abundance. Bold type highlights a few known cancer genes. (F) Methylation-driven cis-regulation of selected genes (n = 109 samples). Gene-level methylation scores, RNA expression levels and protein/phosphopeptide abundances were converted into Z-scores and the tumor samples were ordered by methylation levels. (G) Coordinated expression of proteins associated with PTPRC (CD45) complex in tumors. See also Figure S3 and Table S4
Figure 4:
Figure 4:. Impact of somatic mutation on the proteogenomic landscape.
(A) Significant (Wilcoxon rank-sum test) cis- and trans-effects of selected mutations (x-axis) on the expression of cancer-associated proteins (left) and PTMs (right). (B) Scatterplots showing the relationship between log2 KEAP1 protein and log2 NFE2L2 phosphosite (S215 and S433) expression in KEAP1 mutant samples. Only significant sites (Wilcoxon rank-sum test) are shown. (C) Ribbon/Richardson diagram (Protein Data Bank crystal structure 3WN7) representing 3D protein structure of KEAP1 (Pink) and NFE2L2 DLG motif (green) interaction. Positions of various KEAP1 amino acid residues affected by somatic mutations observed in this cohort are indicated. (D, E) Scatterplots showing significance of RNA, protein (green), phosphorylation site (purple), and acetylation site (yellow) abundance changes between KRAS mutant (D) or EGFR mutant(E) and WT tumors as determined using the Wilcoxon rank sum test. All identified sites are represented, with significant PTMs (FDR < 0.05) specified by triangles. Identities of the most extreme outliers are designated. (F) Heatmap showing phosphorylation of PTPN11 Y62 in EGFR mutant and WT samples. (G) Heatmap showing the outlier kinases enriched (FDR < 0.2) at the phosphoprotein, protein, RNA and CNA levels and their association with mutations in select genes. Cancer Dependency Map-supported (https://depmap.org) panels on the left show log2-transformed relative survival averaged across all available lung cell lines after depletion of the indicated gene (rows) by RNAi or CRISPR. Druggability based on the Drug Gene Interaction Database (http://www.dgidb.org/) is indicated alongside the availability of FDA-approved drugs. The log-transformed druggability score indicates the sum of PubMed journal articles that support the drug-gene relationship. See also Figure S4 and Table S4
Figure 5:
Figure 5:. Immune landscape in LUAD
(A) Heatmaps show three consensus clusters based on immune/stromal signatures identified from xCell, together with derived relative abundance of immune and stromal cell types. The pathway heatmap panels show some key upregulated pathways in HTE and CTE clusters based on multi-omics (“Common”) or global protein abundance only (FDR <0.01, Fisher’s exact test). The expression heatmap panel depicts the RNA and protein levels of various markers involved in immune evasion mechanisms. (B) Association between mutation profiles and immune/stromal signatures from xCell. Only associations significant at FDR < 0.05 are shown. (C) xCell scores for conventional dendritic cells (cDC) and macrophages for NAT samples (x-axis) and tumor samples (y-axis). Scatterplots indicate if a given sample shows significant infiltration by either dendritic cells (left) or macrophages (right) (xCell p-value < 0.05) in both NAT and tumor (black), only in NAT (blue), only in tumor (red), or in neither NAT nor tumor (light-gray). Samples with STK11 mutations are displayed with a triangle. STK11 mutation was found enriched in the subset of samples with infiltration of macrophages and dendritic cells only in NATs (Fisher’s exact test, FDR <0.1). (D) Boxplots show association between STK11 mutation and immune score (ESTIMATE). (E) t-SNE (t-Distributed Stochastic Neighbor Embedding) plot provides a two-dimensional representation of the activation scores of individual STK11 mutated (orange) and WT (blue) tumor histopathology tiles submitted to a deep learning algorithm. Examples of true positive (red outline) and negative (black outline) tiles exhibit different histologic features. STK11 WT tiles correctly recognized by the model harbor abundant inflammatory cells, whereas STK11 mutant tiles showed typical adenocarcinoma characteristics without inflammation. (F) Cluster diagram representing pathways significantly associated with STK11 mutation-enriched cluster IC-068 (Figure S5F) in protein-based unsupervised ICA clustering. The Metascape output represents enriched biological concepts as nodes, aggregates those nodes into clusters based on the similarity of their protein membership, and names the clusters based on their most significant node. Node size represents the number of differentially expressed gene products. Amongst the top 20 clusters, the one representing neutrophil degranulation showed highest significance (Q value < 10−14). The top 5 clusters by p-value are highlighted. G) Scatterplot shows differentially regulated protein and RNA expression (signed -log 10 p-value) in tumors with and without STK11 mutation. Proteins associated with neutrophil degranulation are highlighted in red. See also Figure S5 and Table S5
Figure 6:
Figure 6:. Environmental and smoking-related molecular signatures
(A) Heatmap showing correlation coefficients between the mutational signatures of LUAD tumor samples and 53 signatures of environmental exposure (Kucab et al., 2019). Self-reported smoking status, derived smoking score, di-nucleotide polymorphism (DNP) status, and the fraction of Cosmic signature 4 are shown. (B) Impact of tumor-derived high or low smoking score (HSS; >0.1; LSS; <0.1) on pathways associated with protein expression in tumors and paired NATs. The heatmaps show protein expression-derived, differentially regulated (FDR <0.05) pathways associated with LSS and HSS, separately in tumors (left) and NATs (right). Pathway Groups (PG1–6) are defined according to the patterns of differential HSS/LSS expression in tumors and NATs. A complete list of differentially activated pathways is provided in Table S6. C. Boxplots showing log2 relative abundance of ARHGEF5 phosphosite Y1370, ARHGEF5 and SRGAP1 protein expression in tumors and NATs from strict never-smokers (SNS) with and without ALK fusion and from strict smokers (SS). None of the SS tumors had ALK fusion. ANOVA test was performed on tumor samples only. See also Figure S6 and Table S6
Figure 7:
Figure 7:. Summary of global proteogenomic alterations in tumors and paired NATs
(A) Principal component analysis of protein expression shows distinct separation of tumor samples (n=110) and NATs (n=101). The larger rectangle and triangle represent the centroids of the distributions. (B) Scatterplots show the median log2 fold-change between tumors and paired NATs in the proteome vs phosphosites (left) and acetylsites (right). The dashed line shows equivalence with intercept 0. Red triangles indicate sites with at least log2 4-fold site-level increased abundance compared to associated protein changes between log2, +2 and −2-fold. Blue triangles represent downregulated sites using symmetric parameters (Full list in Table S7). (C) Proteomics-based biomarker candidates (log2 fold change (log2FC) > 2 and FDR <0.01 in ≥ 80% of tumor-NAT pairs) for tumors with any of 4 frequently mutated genes. Numbers in parentheses show candidates displayed / identified. Each dot represents a tumor sample. Blue-colored boxplots highlight proteins with overexpression in more than 99% of tumor samples with the associated mutation. Protein functional groups and relevant clinical trial drug targets of the biomarker candidates are shown in the accompanying schematic. (D) Volcano plot showing the enrichment score (x-axis) and associated log p-value (y-axis) of differentially regulated phosphosite-driven signatures between tumors and matched NATs as assessed by PTM Signature Enrichment Analysis (Krug et al., 2018). Significant (FDR <0.05) signatures are highlighted in shades of brown. The size of the circles shows the overlap between phosphosites detected in our dataset and the phosphosite-specific signatures in PTMsigDB (Krug et al., 2018). (E) Rank plots depicting differential phosphosite-driven signatures (1.5 x interquartile range, IQR) between tumor and paired NATs in tumors with mutations in EGFR (N=38) or KRAS (N=33). Residual enrichment scores (y-axis) were calculated between mutated tumors (EGFR or KRAS) and all other tumors in order to highlight tumor / NAT differences in tumors harboring each specific mutation. (F) Heatmap representing tumor antigens including neoantigens (top panel) and cancer testes (CT) antigens (downloaded from CT database (Almeida et al., 2009)). “DNA repair” indicates mutation in DNA repair genes (POLE, MLH1, MLH3, MSH3, MSH4, MSH6, BRCA1, BRCA2). Displayed CT antigen proteins were overexpressed at least 2-fold in tumors compared to paired NATs in more than 10% of samples. See also Figure S7 and Table S7

Comment in

References

    1. Abril-Rodriguez G, and Ribas A (2017). Snapshot: Immune Checkpoint Inhibitors. Cancer Cell 31, 848–848.e1. - PubMed
    1. Aceto N, Sausgruber N, Brinkhaus H, Gaidatzis D, Martiny-Baron G, Mazzarol G, Confalonieri S, Quarto M, Hu G, Balwierz PJ, et al. (2012). Tyrosine phosphatase SHP2 promotes breast cancer progression and maintains tumor-initiating cells via activation of key transcription factors and a positive feedback signaling loop. Nat. Med 18, 529–537. - PubMed
    1. Achyut BR, and Arbab AS (2016). Myeloid cell signatures in tumor microenvironment predicts therapeutic response in cancer. Onco. Targets. Ther 9, 1047–1055. - PMC - PubMed
    1. Allard D, Allard B, Gaudreau P-O, Chrobak P, and Stagg J (2016a). CD73-adenosine: a next-generation target in immuno-oncology. Immunotherapy 8, 145–163. - PubMed
    1. Allard D, Allard B, Gaudreau P-O, Chrobak P, and Stagg J (2016b). CD73-adenosine: a next-generation target in immuno-oncology. Immunotherapy 8, 145–163. - PubMed

Publication types

MeSH terms