Review
. 2020 Jul 9;182(1):24-37.
doi: 10.1016/j.cell.2020.06.023.

Human Virus Transcriptional Regulators

Affiliations
Review

Human Virus Transcriptional Regulators

Xing Liu et al. Cell. .

Abstract

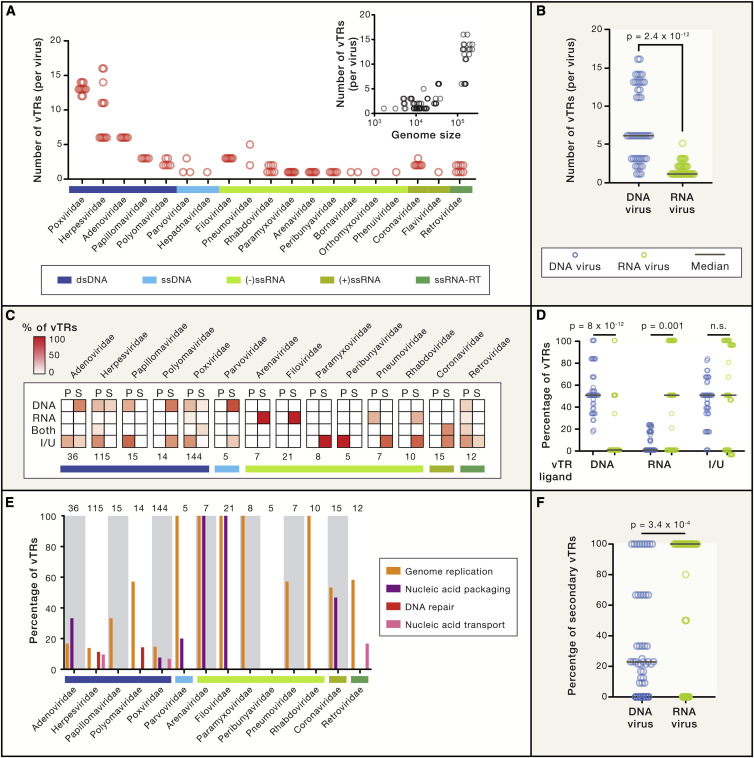
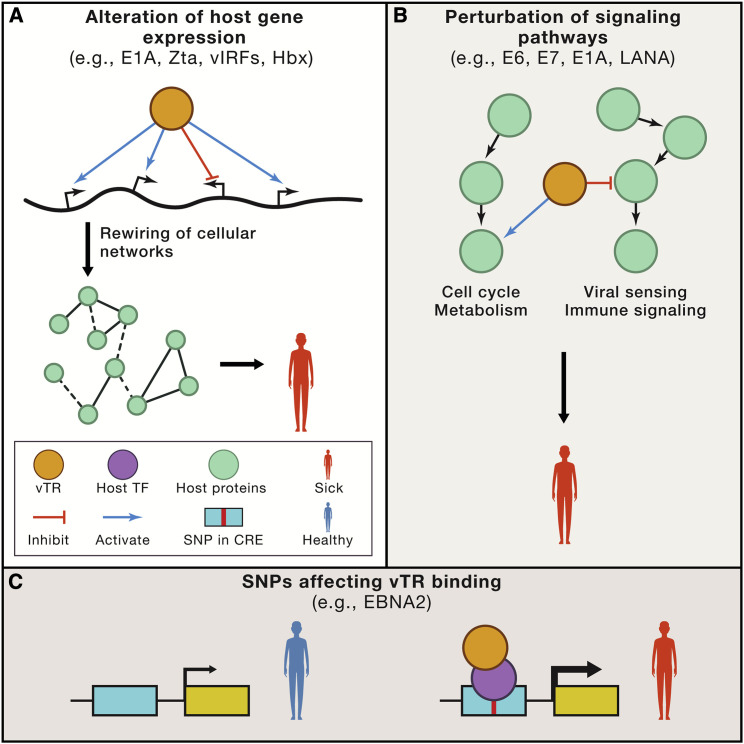
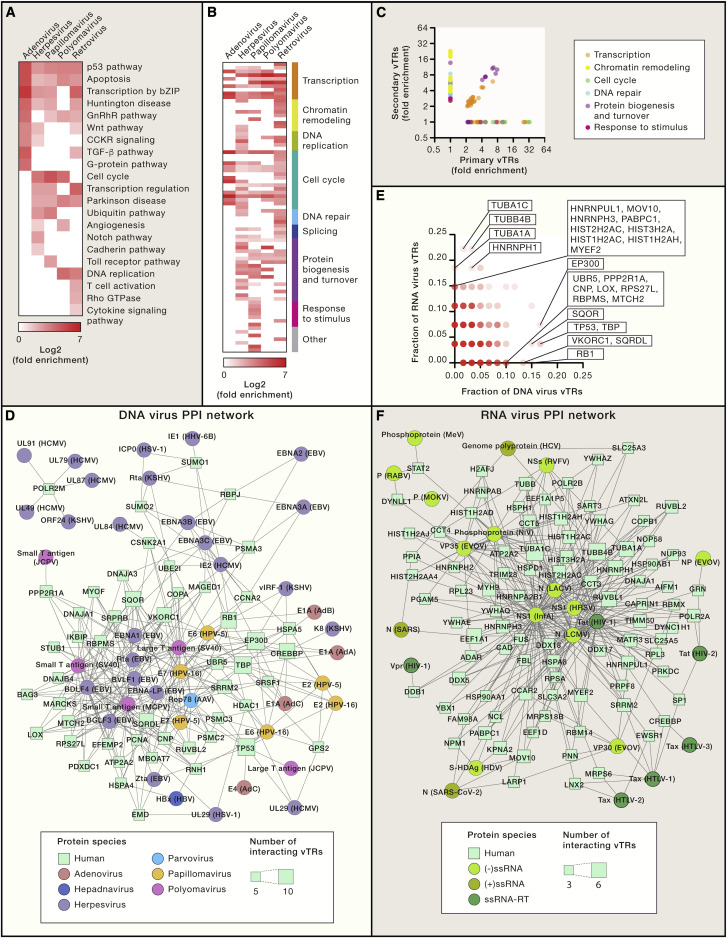
Viral genomes encode transcriptional regulators that alter the expression of viral and host genes. Despite an emerging role in human diseases, a thorough annotation of human viral transcriptional regulators (vTRs) is currently lacking, limiting our understanding of their molecular features and functions. Here, we provide a comprehensive catalog of 419 vTRs belonging to 20 different virus families. Using this catalog, we characterize shared and unique cellular genes, proteins, and pathways targeted by particular vTRs and discuss the role of vTRs in human disease pathogenesis. Our study provides a unique and valuable resource for the fields of virology, genomics, and human disease genetics.


Figures

Figure 1
Figure 1
Roles for vTRs in the Modulation of Gene Expression (A and B) vTRs can bind to nucleic acids either directly (A) or indirectly (B) to modulate target gene expression. (C and D) vTRs can also modulate gene expression by targeting the transcriptional machinery (C) or by altering chromatin states (D).
Figure 2
Figure 2
A Census of Human vTRs (A) Number of vTRs per species for each virus family, classified according to their Baltimore categories. Inset indicates the relationship between the number of vTRs per viral species and viral genome size (in nucleotides). (B) Comparison between the number of vTRs encoded by DNA and RNA viruses. Statistical significance was determined by a Mann-Whitney U test. (C) Percentage of vTRs classified according to their ligand (DNA, RNA, both, or indirect/unknown) and primary (P) or secondary (S) role as vTRs. Values under each heatmap indicate the number of vTRs annotated in each virus family. Only virus families with at least 5 vTRs are shown. (D) Comparison between the percentage of vTRs encoded by DNA and RNA viruses that bind to DNA, bind to RNA or are indirect/unknown binders. Statistical significance was determined by a Mann-Whitney U test. (E) Percentage of vTRs per family associated with molecular functions other than transcriptional regulation. Numbers at the top indicate the total number of vTRs annotated in each virus family. Only virus families with at least 5 vTRs are shown. (F) Comparison between the percentages of vTRs with secondary roles in transcriptional regulation encoded by DNA and RNA viruses. Statistical significance was determined by a Mann-Whitney U test. See also Figures S1 and S2 and Tables S2 and S3.
Figure 3
Figure 3
Roles for vTRs in Human Diseases (A) vTRs can alter host gene expression, resulting in cellular network rewiring, ultimately leading to disease. (B) vTRs can perturb signaling pathways through protein-protein interactions or enzymatic activities. This includes the inhibition of pathways involved in viral sensing and immune signaling, and activating cell cycle progression and cell metabolism. Such perturbations can lead to cancer and other diseases. (C) Single nucleotide polymorphisms (SNPs) and other genetic variants can affect vTR binding, either directly or indirectly through altered host TF binding. This can lead to changes in target gene expression, ultimately leading to disease. CRE, cis regulatory element.
Figure 4
Figure 4
Properties of vTR ChIP-Seq Datasets (A) Overlap of vTR ChIP-seq peaks. Each entry indicates the overlap (number of intersecting peaks divided by the number of peaks in the smaller peak set) between the given pair of vTR ChIP-seq datasets. Rows and columns were hierarchically clustered using the Unweighted Pair Group Method With Arithmetic Mean (UPGMA) algorithm. (B) Distribution of vTR ChIP-seq peaks relative to human gene transcription start sites (TSSs). Transcript-related features were obtained from the UCSC “Known Genes” database table (Haeussler et al., 2019). The plot was created using the ChIPseeker package (Yu et al., 2015). (C) Human TF binding site motifs enriched in vTR ChIP-seq peaks. TF binding site motif enrichment was calculated using HOMER (Heinz et al., 2010). Motifs shown are among the top five motif families (based on HOMER p value) in any individual ChIP-seq dataset. Heatmap color indicates the normalized –log p value. A value of 100 means that the motif has the best –log p value for the given vTR, with 50% indicating half of the best –log p value. See also Tables S1, S4, and S5.
Figure 5
Figure 5
The vTR-Human Protein-Protein Interaction Network (A and B) PANTHER pathway (A) and GO-Slim biological process (B) enrichment analyses for human proteins that interact with vTRs, categorized by virus family. Fold enrichment values are indicated for associations with a false discovery rate (FDR) <0.05. GO-Slim terms were manually classified based on their biological function. Only virus families encoding at least five vTRs with reported protein-protein interactions to human proteins are shown. Gene sets were obtained from the PANTHER database (Mi et al., 2013). (C) GO-Slim biological process fold enrichment of human proteins that interact with primary versus secondary vTRs. (D and F) vTR-human hub protein-protein interaction network. vTR-human protein-protein interaction data were downloaded from VirHostNet 2.0 (http://virhostnet.prabi.fr/) (Guirimand et al., 2015) and VirusMentha (https://virusmentha.uniroma2.it/) (Calderone et al., 2015). vTR-human protein-protein interactions are shown for DNA virus vTRs (D) and RNA virus vTRs (F). Human proteins with at least five DNA virus vTR interactors or at least 3 RNA virus vTR interactors are included in the networks. Physical interactions are indicated by edges. Circles represent vTRs, and are colored by virus family or class. Squares represent human proteins, with node size representing the number of vTR interactors. (E) Comparison of the fraction of DNA and RNA virus vTR protein-protein interactors per human protein. Human proteins preferentially interacting with DNA or RNA virus vTRs are indicated. The color gradient indicates the number of human proteins.

References

    1. Aloni-Grinstein R., Charni-Natan M., Solomon H., Rotter V. p53 and the Viral Connection: Back into the Future‡. Cancers (Basel) 2018;10:178. - PMC - PubMed
    1. Arvey A., Tempera I., Tsai K., Chen H.S., Tikhmyanova N., Klichinsky M., Leslie C., Lieberman P.M. An atlas of the Epstein-Barr virus transcriptome and epigenome reveals host-virus regulatory interactions. Cell Host Microbe. 2012;12:233–245. - PMC - PubMed
    1. Ascherio A., Munger K.L., Lennette E.T., Spiegelman D., Hernán M.A., Olek M.J., Hankinson S.E., Hunter D.J. Epstein-Barr virus antibodies and risk of multiple sclerosis: a prospective study. JAMA. 2001;286:3083–3088. - PubMed
    1. Balandraud N., Roudier J. Epstein-Barr virus and rheumatoid arthritis. Joint Bone Spine. 2018;85:165–170. - PubMed
    1. Barbera A.J., Chodaparambil J.V., Kelley-Clarke B., Joukov V., Walter J.C., Luger K., Kaye K.M. The nucleosomal surface as a docking station for Kaposi’s sarcoma herpesvirus LANA. Science. 2006;311:856–861. - PubMed

Publication types