. 2020 Aug 11;15(2):326-339.
doi: 10.1016/j.stemcr.2020.06.008. Epub 2020 Jul 9.

A Novel GATA2 Protein Reporter Mouse Reveals Hematopoietic Progenitor Cell Types

Affiliations

A Novel GATA2 Protein Reporter Mouse Reveals Hematopoietic Progenitor Cell Types

Nouraiz Ahmed et al. Stem Cell Reports. .

Abstract

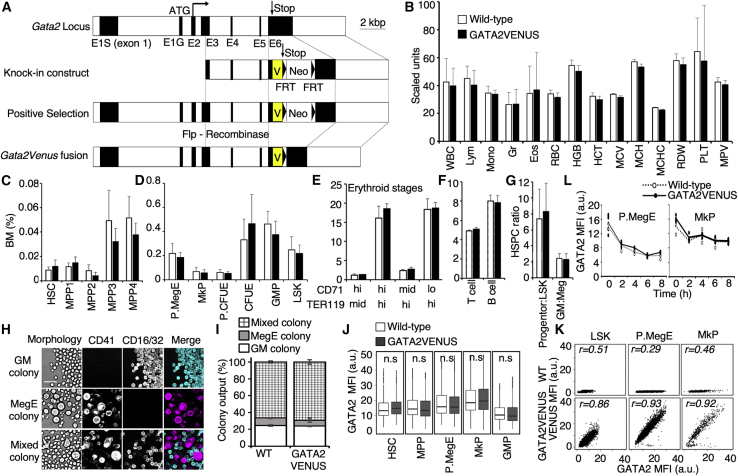
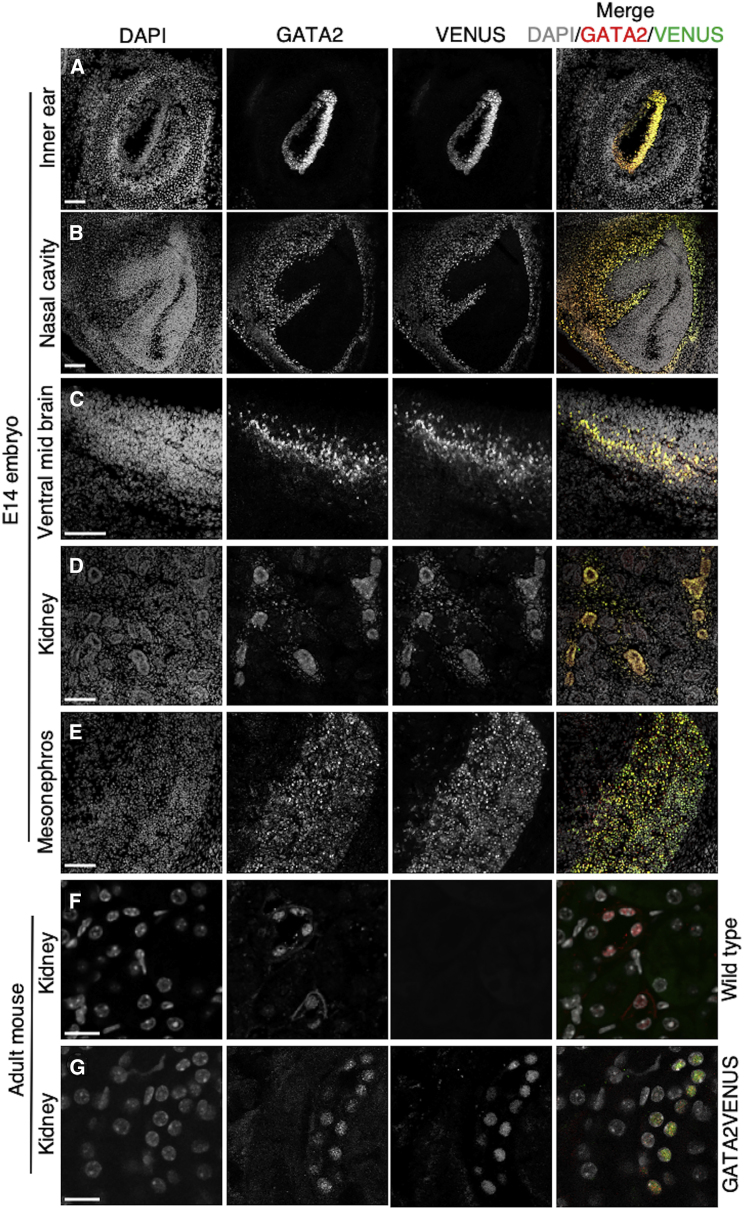
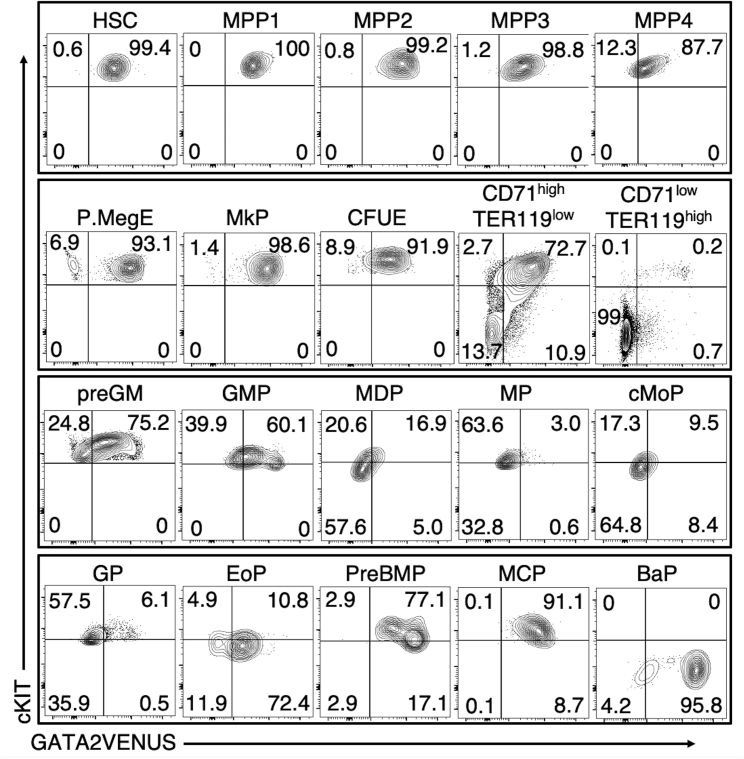
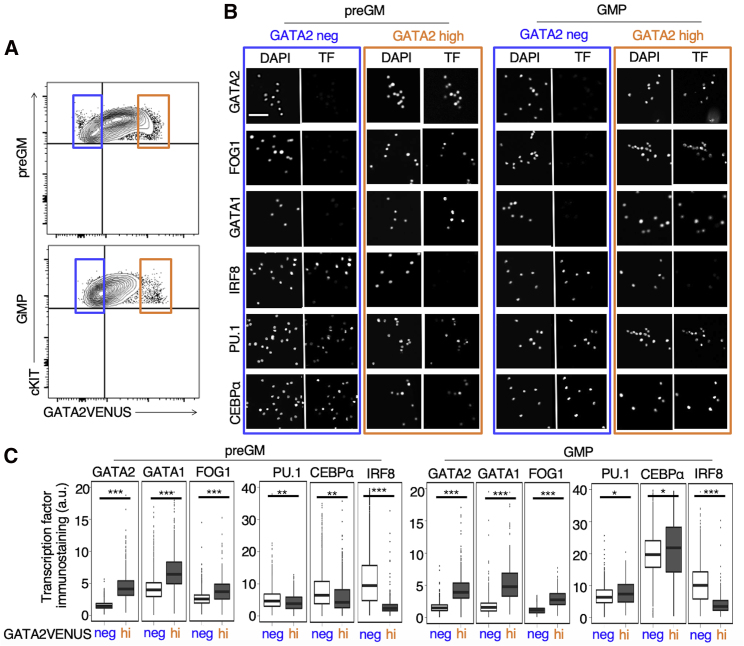
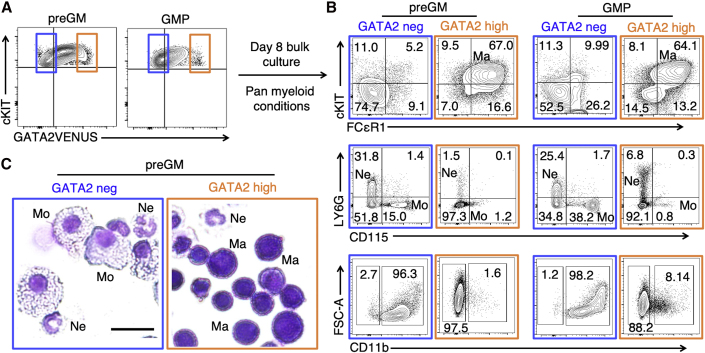
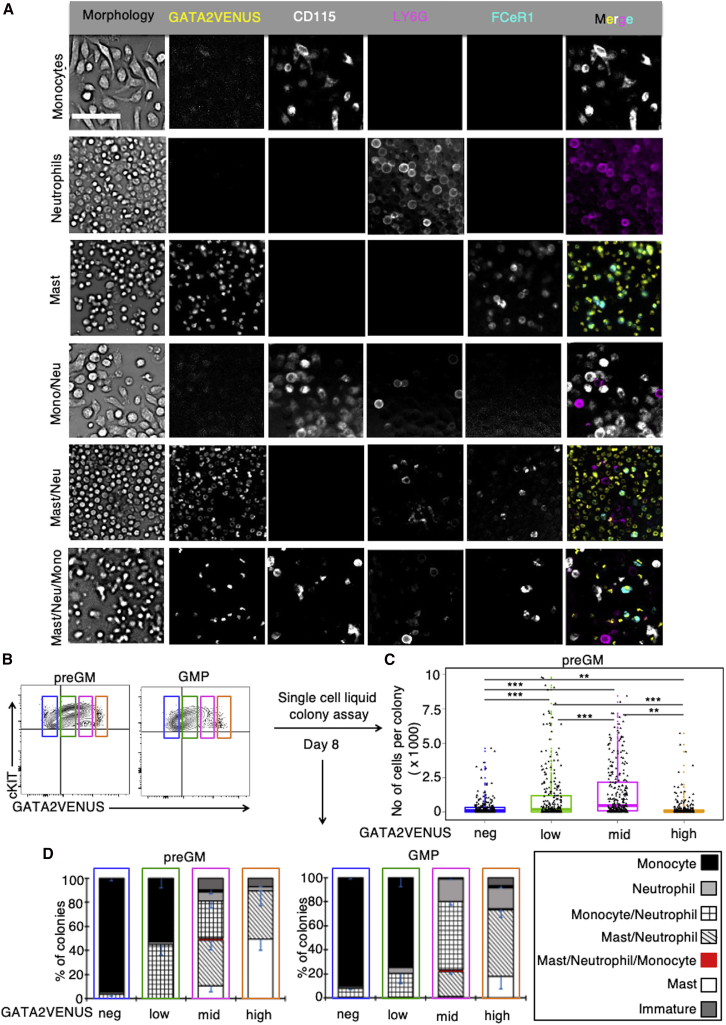
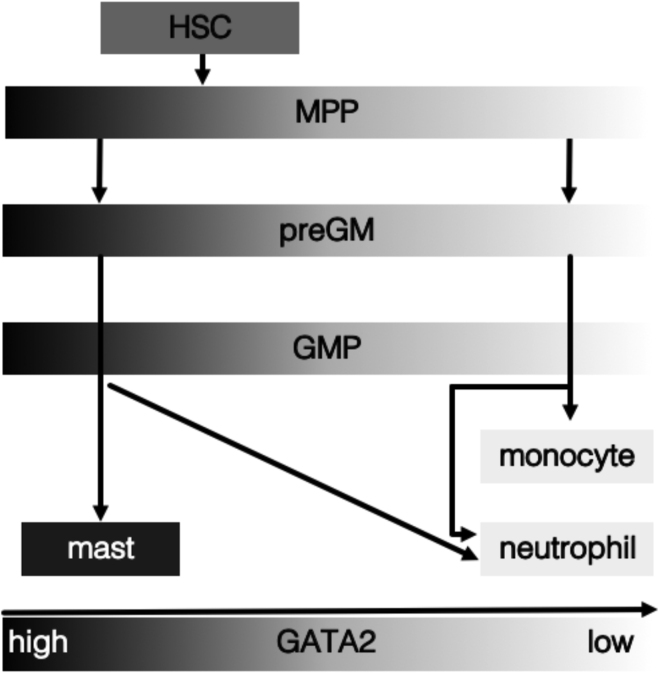
The transcription factor (TF) GATA2 plays a key role in organ development and cell fate control in the central nervous, urogenital, respiratory, and reproductive systems, and in primitive and definitive hematopoiesis. Here, we generate a knockin protein reporter mouse line expressing a GATA2VENUS fusion from the endogenous Gata2 genomic locus, with correct expression and localization of GATA2VENUS in different organs. GATA2VENUS expression is heterogeneous in different hematopoietic stem and progenitor cell populations (HSPCs), identifies functionally distinct subsets, and suggests a novel monocyte and mast cell lineage bifurcation point. GATA2 levels further correlate with proliferation and lineage outcome of hematopoietic progenitors. The GATA2VENUS mouse line improves the identification of specific live cell types during embryonic and adult development and will be crucial for analyzing GATA2 protein dynamics in TF networks.

Keywords: GATA2; cell fate; development; fluorescent protein; hematopoietic stem and progenitor cell; monocyte and mast cell lineage; transcription factor networks; transgenic mouse.


Figures

Figure 1
Figure 1
Generation of a GATA2VENUS Knockin Protein Reporter Mouse Line with Normal Hematopoiesis (A) Constructs used for GATA2VENUS knockin generation. The FRT PGK-Neo FRT was deleted by cross with a Flpe deleter mouse line. Black boxes indicate exons (also see Figure S1). (B) Peripheral blood counts are not altered in GATA2VENUS mouse line. WBC, white blood cells (200 cells per mm3); Lym, percent lymphocytes of WBC (%); Mono, percent monocytes of WBC (0.1%); Gr, percent granulocytes of WBC (%); Eos, percent eosinophils of WBC (0.2%); RBC, red blood cells (2 ×105 cells per mm3); HGB, hemoglobin (0.2 g/dL); HCT, hematocrit (%); MCV, mean corpuscular volume (μm3); MCH, mean corpuscular hemoglobin (0.2 pg); MCHC, mean corpuscular hemoglobin concentration (g/dL); RDW, red cell distribution width (0.2%); PLT, platelets (104 per mm3); MPV, mean platelet volume (0.1 μm3) (n = 9 mice per genotype). (C–G) Fusion of VENUS to GATA2 does not alter bone marrow composition. Data indicate bone marrow percentage of (C) HSCs and multipotent progenitors (n = 7 mice per genotype), (D) lineage committed progenitors (n = 10 mice per genotype), (E) early and late erythrocyte progenitors (n = 3 mice per genotype), (F) T and B cells (n = 3 mice per genotype), and (G) ratio of multipotent progenitors to lineage committed progenitors and granulocyte-monocyte progenitors to megakaryocyte-erythrocyte (MegE) progenitors (n = 10 mice per genotype). (H and I) Colony-forming potential and output of HSCs is not altered in GATA2VENUS mouse line. (H) Single HSCs sorted into 384-wells in IMDM, FCS, BIT, SCF, EPO, TPO, IL-3, and IL-6. Granulocyte-monocyte (GM) colonies identified by morphology and FCγR expression. MegE colonies identified by morphology and CD41 expression. Scale bar, 50 μm. (I) Types of colonies formed from HSCs (n = 3 independent mice per genotype). (J) Protein levels of GATA2 are not altered in different cell types in GATA2VENUS mouse line. Data were acquired using quantitative immunostaining against endogenous GATA2 protein. Data represented by box and whisker plots with median of GATA2 intensity (n = 3 independent mice per genotype). (K) Endogenous GATA2 protein levels correlate to VENUS fusion levels. Data were acquired using quantitative immunostaining against GATA2 and VENUS and represented by a 2D plot of GATA2 and VENUS intensities. Number (r) in the plots indicate Pearson correlation coefficient (n = 3 independent mice per genotype). (L) Normal stability of GATA2 fusion proteins in pre-MegE progenitors (preMegEs) (left panel) and megakaryocyte progenitors (MkPs) (right panel). Data were acquired using quantitative immunostaining against GATA2 in indicated cell types after treatment with 50 μM cycloheximide (protein translation inhibitor) and sampling of cells at the indicated time points (n = 3 independent mice per genotype). Error bars in (B)–(G) and (I) = SD. Data in (J)–(L) indicate mean fluorescence intensity (MFI) of GATA2 and VENUS. Difference between wild-type and GATA2VENUS samples is non-significant unless specified. Two-sample t test; ∗∗∗p < 0.001, ∗∗p < 0.01, p < 0.05.
Figure 2
Figure 2
Normal Expression and Localization of GATA2VENUS in Embryonic and Adult Tissues Localization of GATA2VENUS is similar to GATA2 in nuclei of the inner ear (A), nasal cavity (B), ventral mesoderm (C), kidney (D), and mesonephros (E) from E14 embryo and kidney from adult wild-type (F) and GATA2VENUS (G) mice. Confocal images of E14 embryo (A–E) and 12-week-old adult mouse (F–G) sections stained with DAPI (nuclei), and anti-GATA2 and anti-GFP antibodies. Scale bars, 100 μm (A–E) and 10 μm (F–G).
Figure 3
Figure 3
Cell-Type-Specific and Heterogeneous GATA2 Protein Expression in Adult HSPCs Flow-cytometric quantification of GATA2VENUS expression in adult HSPCs. GATA2VENUS gate was set using wild-type cells (see Figure S5). Numbers in quadrants represent percentage of cells. See Figure S3 for gating schemes for these cell types: HSC, hematopoietic stem cell; MPP 1–4, multipotent progenitors 1–4; P.MegE, pre-megakaryocyte-erythrocyte; MkP, megakaryocyte progenitor; CFUE, colony-forming unit erythrocyte; CD71highTER119low and CD71lowTER119high, erythrocyte differentiation stages; preGM, pre-granulocyte-monocyte; GMP, granulocyte-monocyte progenitor; MDP, monocyte dendritic cell progenitor; MP, monocyte progenitor; cMoP, common monocyte progenitor; GP, granulocyte progenitor; EoP, eosinophil progenitor; preBMP, pre-basophil mast cell progenitor; MCP, mast cell progenitor; BaP, basophil progenitor.
Figure 4
Figure 4
GATA2 Protein Expression Identifies preGM and GMP Subpopulations with Differential Hematopoietic TF Expression (A) GATA2-negative and -high preGMs and GMPs were sorted before immunostaining, imaging, and quantification of core hematopoietic TFs. (B) Representative fluorescence images of preGMs (left panel) and GMPs (right panel) stained with DAPI and anti-TF antibodies. Scale bar: 50 µm. (C) Quantification of TF levels in GATA2-negative and -high preGMs and GMPs. Data represented by box and whisker plots with median (n = 3 independent mice). Two-tailed t test; ∗∗∗p < 0.001, ∗∗p < 0.01, p < 0.05.
Figure 5
Figure 5
GATA2 Protein Levels Identify Early Segregation of Monocyte and Mast Cell Lineages but Not Neutrophils (A) GATA2-negative and -high preGMs and GMPs were sorted and cultured in pan-myeloid medium (IMDM + FCS + BIT + SCF + GM-CSF + IL-3 + IL-9). (B) Quantification of mature cell types at day 8 by flow cytometry. GATA2-negative preGMs and GMPs mainly generate CD11b+ CD115+ FCεR1 monocytes and CD11b+ LY6G+ FCεR1 neutrophils while GATA2-high preGMs and GMPs generate cKIT+ FCεR1+ CD11b CD115 LY6G mast cells and few neutrophils. Numbers in quadrants represent percentage of cells. (C) Representative images of May-Grünwald Giemsa morphology of cells from day 8 culture preGMs. GATA2-negative versus -high preGMs generate monocytes and neutrophils versus mast cells and neutrophils, respectively. Scale bar, 20 μm.
Figure 6
Figure 6
Variations in GATA2 Protein Levels Correlate with HSPC Proliferation and Lineage Potential (A) Quantification of liquid colonies from single preGMs or GMPs by quantitative imaging of cell morphology, nuclear shape, and expression of GATA2VENUS, CD115 (monocytes), LY6G (neutrophils), and FCεR1 (mast cells). Examples shown for monocyte, neutrophil, mast cell, bipotent monocyte-neutrophil, bipotent mast cell-neutrophil, and tripotent monocyte-neutrophil-mast cell colonies. Immature colonies do not express any surface markers. Scale bar, 50 μm. (B) Four different preGM and GMP fractions based on GATA2 levels were single-cell sorted into 384-well plates and cultured for 8 days in pan-myeloid media (IMDM + FCS + BIT + SCF + GM-CSF + IL-3 + IL-9). (C) GATA2 -low and -mid preGMs exhibit higher proliferation and colony-forming potential than GATA2 -negative and -high cells. Data represented by box and whisker plots with median. Dots indicate individual measurement per cell (n = 3 independent mice). (D) GATA2 protein expression correlates with different preGM and GMP lineage potential. Mean percentage of different colony types identified in (A) (n = 3 independent mice). Error bars = SD. Number of colonies, preGMs: GATA2-neg, 155; GATA2-low, 225; GATA2-mid, 157; GATA2-high, 152. GMPs: GATA2-neg, 173; GATA2-low, 153; GATA2-mid, 161; GATA2-high, 91. Two-sided Wilcoxon rank-sum test; ∗∗∗p < 0.001, ∗∗p < 0.01, p < 0.05.
Figure 7
Figure 7
Early Segregation of Monocyte and Mast Cell Lineages Based on GATA2 expression, monocyte, and mast cell lineages bifurcate already within the preGM and likely the MPP compartment. Neutrophil fate is shared between GATA2-low and -high pathways. Only mast, neutrophil, and monocyte lineages are shown. Infrequent transition between GATA2-low and -high states in MPPs, preGMs, and GMPs may be possible.

References

    1. Akashi K., Traver D., Miyamoto T., Weissman I.L. A clonogenic common myeloid progenitor that gives rise to all myeloid lineages. Nature. 2000;404:193–197. - PubMed
    1. Arinobu Y., Iwasaki H., Gurish M.F., Mizuno S., Shigematsu H., Ozawa H., Tenen D.G., Austen K.F., Akashi K. Developmental checkpoints of basophil/mast cell lineages in adult murine hematopoiesis. Proc. Natl. Acad. Sci. U S A. 2005;102:1–6. - PMC - PubMed
    1. Bresnick E.H., Martowicz M., Pal S., Johnson K.D. Developmental control via GATA factor interplay at chromatin domains. J. Cell. Physiol. 2005;205:1–9. - PubMed
    1. Bresnick E.H., Lee H.Y., Fujiwara T., Johnson K.D., Keles S. GATA switches as developmental drivers. J. Biol. Chem. 2010;285:31087–31093. - PMC - PubMed
    1. Cabezas-Wallscheid N., Klimmeck D., Hansson J., Lipka D.B., Reyes A., Wang Q., Weichenhan D., Lier A., Von Paleske L., Renders S. Identification of regulatory networks in HSCs and their immediate progeny via integrated proteome, transcriptome, and DNA methylome analysis. Cell Stem Cell. 2014;15:507–522. - PubMed

Publication types