. 2020 Nov;587(7833):309-312.
doi: 10.1038/s41586-020-2530-3. Epub 2020 Jul 10.

Structural basis for RIFIN-mediated activation of LILRB1 in malaria

Affiliations

Structural basis for RIFIN-mediated activation of LILRB1 in malaria

Thomas E Harrison et al. Nature. 2020 Nov.

Abstract

The Plasmodium species that cause malaria are obligate intracellular parasites, and disease symptoms occur when these parasites replicate in human blood. Despite the risk of immune detection, the parasite delivers proteins that bind to host receptors on the cell surfaces of infected erythrocytes. In the causative parasite of the most deadly form of malaria in humans, Plasmodium falciparum, RIFINs form the largest family of surface proteins displayed by erythrocytes1. Some RIFINs can bind to inhibitory immune receptors, and these RIFINs act as targets for unusual antibodies that contain a LAIR1 ectodomain2-4 or as ligands for LILRB15. RIFINs stimulate the activation of and signalling by LILRB15, which could potentially lead to the dampening of human immune responses. Here, to understand how RIFINs activate LILRB1-mediated signalling, we determine the structure of a RIFIN bound to LILRB1. We show that this RIFIN mimics the natural activating ligand of LILRB1, MHC class I, in its LILRB1-binding mode. A single mutation in the RIFIN disrupts the complex, blocks LILRB1 binding of all tested RIFINs and abolishes signalling in a reporter assay. In a supported lipid bilayer system, which mimics the activation of natural killer (NK) cells by antibody-dependent cell-mediated cytotoxicity, both RIFIN and MHC are recruited to the immunological synapse of NK cells and reduce the activation of NK cells, as measured by the mobilization of perforin. Therefore, LILRB1-binding RIFINs mimic the binding mode of the natural ligand of LILRB1 and suppress the function of NK cells.


Conflict of interest statement

Competing interests: The authors confirm that there are no competing interests.

Figures

Extended Data Figure 1
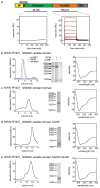
Extended Data Figure 1. Biophysical characterisation of RIFIN variable and constant regions, and the RIFIN:LILRB1 complex.
a. Schematic showing the domain architecture of a RIFIN, using numbering from PF3D7_1254800, and surface plasmon resonance analysis of the binding of the PF3D7_1254800 constant and variable regions to immobilised LILRB1. The variable region was injected in a two-fold dilution series from 4μM to 3.9nM, while a single injection of 4µM was used for the constant region. Equilibrium fitting gave KD=570 ± 130nM. Red dotted lines show the fitting to a one-to-one kinetic binding model and give KD=1.13μM, ka=2.63x10⁵M-1s-1 and kd=0.297 s-1 (chi2=3.88RU2) with n=1 for each series. b. Size exclusion chromatograms and Coomassie-stained SDS-PAGE gel showing LILRB1 ectodomain, RIFIN 1254800 variable region and their complex, and a circular dichroism spectrum for the RIFIN. c. Size exclusion chromatogram, Coomassie-stained SDS-PAGE gel, and circular dichroism spectrum for the RIFIN 1254800 constant region. d. Size exclusion chromatogram, Coomassie-stained SDS-PAGE gel, and circular dichroism spectrum for the RIFIN PF3D7_1254800 C223S mutant. e. Size exclusion chromatogram, Coomassie-stained SDS- PAGE gel, and circular dichroism spectrum for the RIFIN PF3D7_1254800 C223S G234R mutant. Circular dichroism data shows the average of ten technical replicates, while size exclusion chromatograms and gels are from single experiments
Extended Data Figure 2
Extended Data Figure 2. Surface plasmon resonance analysis of RiFiN binding to LILRB1.
Surface plasmon resonance analysis of the binding of RIFIN PF3D7_1254800 variable region containing mutations C223S or C223S G234R to different LILRB1 constructs, showing that the RIFIN binding site is contained within domains 1 and 2 of LILRB1 and involves RIFIN residue G234. Each RIFIN was injected in a two-fold dilution series from 4μM to 3.9nM. For binding to D1-D4, equilibrium fitting gave KD = 700 ± 5 nM. Red dotted lines show the fitting to a one-to-one kinetic binding model and give KD=1.04µM, ka=2.88x10⁵M-1s-1 and kd=0.299 s-1 (chi2=3.76RU2) with n=1 for each series. For binding to D1-D2, equilibrium fitting gave KD= 1.10 ± 0.05 µM. Red dotted lines show the fitting to a one-to-one kinetic binding model and give KD=1.33µM, ka=4.37x10⁵M-1s-1 and kd=0.579 s-1 (chi2=4.04RU2) with n=1 for each series.
Extended Data Figure 3
Extended Data Figure 3. Analysis of the effect of RIFINs on signalling in a T cell based GFP report system.
a. NFAT-GFP-based reporter system which expresses GFP in response to LILRB1-mediated signalling was used to assess the effect of RIFINs. Fluorescent signalling of the LILRB1- reporter cells and control reporter cells were assessed in triplicate in the presence of the immobilized LILRB1-binding RIFIN variable domain (PF3D7_1254800: C223S), its G234R mutant (C223S G234R) and a RIFIN which does not bind LILRB1 (PF3D7_1254200). b. Flow cytometry images used to derive a.
Extended Data Figure 4
Extended Data Figure 4. Analysis of the sequence variability of RIFINs.
a. A sequence LOGO for 185 RIFINs from the 3D7 strain of Plasmodium falciparum. Numbers are those from the 1254800 RIFIN and the orange cylinders beneath the numbers represent the positions of helices in the RIFIN structure. b. An equivalent sequence LOGO for ten LILRB1-binding RIFINs. c. and d. Sequence LOGOs for the residues which in PF3D7_1254800 contact LILRB1 in c. 185 RIFINs from 3D7 and d. 10 LILRB1-binding RIFINs. e. The structure of the RIFIN with the most conserved residues in ten LILRB1-binding RIFINs coloured. Red represents a sequence entropy of <0.5; orange is 0.5-0.75 and yellow is 0.75-1.0. f. An equivalent representation of conserved residues across 185 RIFINs from 3D7.
Extended Data Figure 5
Extended Data Figure 5. Analysis of the effect of point mutations on LILRB1-binding by RIFINs
a. Size exclusion chromatogram, Coomassie-stained SDS-PAGE gel, and circular dichroism spectrum for the PF3D7_0100400 variable region. b. Size exclusion chromatogram, Coomassie-stained SDS-PAGE gel, and circular dichroism spectrum for the PF3D7_0100400 variable region with the L264R mutation. The peak at ~13.3ml corresponded to monomer, with the same mobility observed for PF3D7_0100400 and was used for subsequent experiments. Circular dichroism data shows the average of ten technical replicates, while size exclusion chromatograms and gels are from single experiments. c. Flow cytometry analysis of the binding of LILRB1-Fc to erythrocytes infected with transgenic parasites expressing specific RIFINs.
Extended Data Figure 6
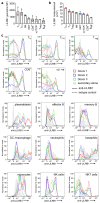
Extended Data Figure 6. Measurement of quantities of LILRB1 on different plasma white blood cells after fluorescent sorting.
a. Summary of LILRB1 expression levels on select leukocyte subsets. b. LILRB1 surface densities were calculated using MESF calibration beads as described in the Methods section. c. Original histograms on which these measurements are based. In figures 3a and 3b, error bars are represented as mean ± 1 SD. Each circle represents the measurement from one donor. Th = helper T cell, Tfh = follicular helper T cell, Treg = regulatory T cell, Beff = effector B cell, NKT = natural killer T cell. In all panels, data was collected for three independent donors, colour coded as in panel c.
Extended Data Figure 7
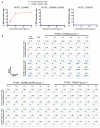
Extended Data Figure 7. Imaging LILRB1 and perforin in an NK cell immunological synapse model
a. PfRH5 and anti-PfRH5 R5.016 antibody (aRH5), together with ICAM-1, trigger NK cell contact formation and perforin (yellow) mobilisation to the synapse. Representative images are shown from one of two independent experiments with similar results. b. A calibration curve for the density of pMHC, RIFIN (C223S) and G234R (C223S G234R) on SLBs. c. Supplementary images of LILRB1 localisation (green) in NK cells in the contact area on SLBs coated with RIFIN, G234R mutant or MHC class I (pMHC) (magenta). d. Supplementary images of perforin mobilisation (yellow) in NK cells on SLBs coated with RIFIN, G234R mutant or MHC class I (pMHC) (magenta). Scale bars = 10 µm. Three independent experiments were carried out with cells from different donors with similar results. The raw MFI values of these experiments are shown in ED figure 8a, 8b and 8c.
Extended Data Figure 8
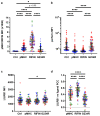
Extended Data Figure 8. nalysis of quantity and co-localisation of RIFIN and its G234R mutant, pMHC, LILRB1 and perforin at the NK cell immunological synapse
Fluorescence measurements from three donors, each indicated by a different colour, were analysed to investigate: a. the quantity of RIFIN (C223S), G234R (C223S G234R) and pMHC at the contact area; b. perforin mobilisation to the synapse under each condition; c. the quantity of LILRB1 at the contact area and; d. the degree of co-localisation of RIFIN, G234R and pMHC with LILRB1. In figure 8a, Tukey’s post hoc test was performed on the following sample sizes: control (n = 80), pMHC (n = 84), RIFIN (n = 104), G234R (n = 78). All comparisons had an adjusted p value < 0.0001 except for control versus G234R (p = 0.01) and pMHC vs G234R (shown). In figure 8b, Dunn’s test was performed on the following sample sizes: control (n = 80), pMHC (n = 84), RIFIN (n = 104), G234R (n = 78). All comparisons had an adjusted p value < 0.0001 except for control versus G234R and pMHC vs RIFIN which were non-significant (p > 0.9999). In figure 8c, Dunn’s test was performed on the following sample sizes: control (n = 72), pMHC (n = 61), RIFIN (n = 65), G234R (n = 71) All comparisons were highly non-significant (p > 0.9999) except for control vs G234R (p = 0.64), RIFIN vs G234R (p = 0.18) and MHC vs G234R (p = 0.02). Figure 8d is identical to figure 3f but with each measurement colour-coded by donor. Tukey’s post hoc test was performed on the following sample sizes: RIFIN (n=65 cells), G234R (n=71 cells) and pMHC (n=61 cells). All had adjusted p value < 0.0001. Data are represented as mean ± 1 SD for figures 8a and 8d and median ± interquartile range for figures 8b and 8c. For further details of statistical testing, see the Methods section.
Figure 1
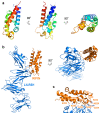
Figure 1. The structure of the RIFIN:LILRB1 complex.
a. The structure of RIFIN 1254800 variable region in a rainbow representation with N- terminus blue and C-terminus red. b. The structure of the RIFIN variable region (orange) bound to the LILRB1 ectodomain (blue). c. The interface between the RIFIN and LILRB1 with interacting residues and disulphide bonding cysteines of the RIFIN labelled in orange.
Figure 2
Figure 2. A conserved binding mode amongst sequence diverse LILRBl-binding RIFINs
a. A close up of the interface between the RIFIN and LILRB1 with residue G234 labelled. b. Surface plasmon resonance analysis of the binding of the RIFIN variable domain (WT: C223S) and its G234R (C223S G234R) mutant to immobilised LILRB1, injecting a two-fold dilution series from 4µM to 3.9nM. For the variable domain, equilibrium fitting gave KD = 700 ± 5 nM. Red dotted lines show the fitting to a one-to-one kinetic binding model and gave KD=1.04μM, ka=2.88x10⁵M-1s-1 and kd=0.299 s-1 (chi2=3.76RU2) with n=1 for each series. c. Analysis of the effect of RIFIN (PF3D7_1254800), G234R and a non-LILRBl binding RIFIN (PF3D7_1254200) on signalling in a T cell-based GFP reporter assay system. The mean of three independent measurements are shown with error bars representing the standard deviation. d. A sequence logo for residues from 10 LILRBl-binding RIFINs corresponding to residues 220-255 of PF3D7_1254800. Residues that contact LILRB1 are indicated with red triangles, G234 with a green triangle, and the conserved disulphide bond with a bracket. e. The most conserved residues in ten LILRB1-binding RIFINs plotted onto the structure of the RIFIN. Red represents a sequence entropy of <0.5; orange is 0.5-0.75 and yellow is 0.75-1.0. f. Surface plasmon resonance analysis for the binding of the variable domain of PF3D7_0100400 (injecting a two-fold dilution series from 8μ,M to 7.8nM) and its L264R mutant (8μM injection) to immobilised LILRB1. For the PF3D7_0100400, equilibrium fitting gave KD = 4.4 ± 3.2 μM. Red dotted lines show the fitting to a one-to-one kinetic binding model and gave KD=14.5μM, ka=4100M-1s-1 and kd=0.0592s-1 (chi2=0.459RU2) with n=1 for each series. g. Flow cytometry analysis of the binding of LILRB1-Fc to erythrocytes infected with transgenic parasites expressing specific RIFINs and their mutants.
Figure 3
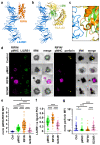
Figure 3. Molecular mimicry of MHC class I by a LILRB1-binding RIFIN reduces NK cell activation
a. Structure of the RIFIN variable region (orange) bound to LILRB1 (blue). b. A model of LILRB1 (blue) bound to MHC class I (alpha chain, yellow; b2-microglobulin, green), based on MHC class I bound to LILRB1 domains 1 and 2. c. Close up of an alignment of RIFIN:LILRB1 complex with MHC class I:LILRB1 complex. d. Analysis of localisation of LILRB1 (green) or perforin (yellow) in the contact area for NK cells on SLBs coated with RIFIN (C223S), G234R mutant (C223S G234R) or MHC class I (pMHC) (magenta). Scale bars = 10 μm. Measurements from three independent donors were pooled and analysed to investigate; e. the quantity of RIFIN (n=104 cells), G234R (n=78 cells) and pMHC (n=84 cells), with control (n=80 cells), in the contact area. All had adjusted p value < 0.0001 except for control versus G234R (p = 0.03); f. the degree of co-localisation of RIFIN (n=65 cells), G234R (n=71 cells) and pMHC (n=61 cells) with LILRB1. All had adjusted p value < 0.0001; and g. the quantity of perforin in the contact area. Control (n = 80 cells), pMHC (n = 84 cells), RIFIN (n = 104 cells), G234R (n = 78 cells). All had adjusted p value < 0.0001 except for control versus pMHC (p = 0.04), while control versus G234R and pMHC versus RIFIN were non-significant (p > 0.9999). Each data point represents the measurement from one cell. For e and f, Tukey’s post hoc test was performed, and mean ± 1 SD are shown. For g, Dunn’s test was performed and median value ± interquartile range is shown. *p < 0.05, **p < 0.01, ***p < 0.001, ****p < 0.0001. MFI = mean fluorescence intensity.

Comment in

  • RIFINing Plasmodium-NK Cell Interaction.
    Ménard D, Houzé S, Papon N. Ménard D, et al. Trends Parasitol. 2020 Oct;36(10):802-804. doi: 10.1016/j.pt.2020.07.017. Epub 2020 Aug 12. Trends Parasitol. 2020. PMID: 32800428

References

    1. Chan JA, Fowkes FJ, Beeson JG. Surface antigens of Plasmodium falciparum- infected erythrocytes as immune targets and malaria vaccine candidates. Cell Mol Life Sci. 2014;71:3633–57. - PMC - PubMed
    1. Tan J, et al. A LAIR1 insertion generates broadly reactive antibodies against malaria variant antigens. Nature. 2016;529:105–9. - PMC - PubMed
    1. Pieper K, et al. Public antibodies to malaria antigens generated by two LAIR1 insertion modalities. Nature. 2017;548:597–601. - PMC - PubMed
    1. Hsieh FL, Higgins MK. The structure of a LAIR1-containing human antibody reveals a novel mechanism of antigen recognition. Elife. 2017;6 - PMC - PubMed
    1. Saito F, et al. Immune evasion of Plasmodium falciparum by RIFIN via inhibitory receptors. Nature. 2017;552:101–105. - PMC - PubMed

Publication types

MeSH terms