. 2020 Aug 12;40(33):6289-6308.
doi: 10.1523/JNEUROSCI.0288-20.2020. Epub 2020 Jul 10.

Induction of BDNF Expression in Layer II/III and Layer V Neurons of the Motor Cortex Is Essential for Motor Learning

Affiliations

Induction of BDNF Expression in Layer II/III and Layer V Neurons of the Motor Cortex Is Essential for Motor Learning

Thomas Andreska et al. J Neurosci. .

Abstract

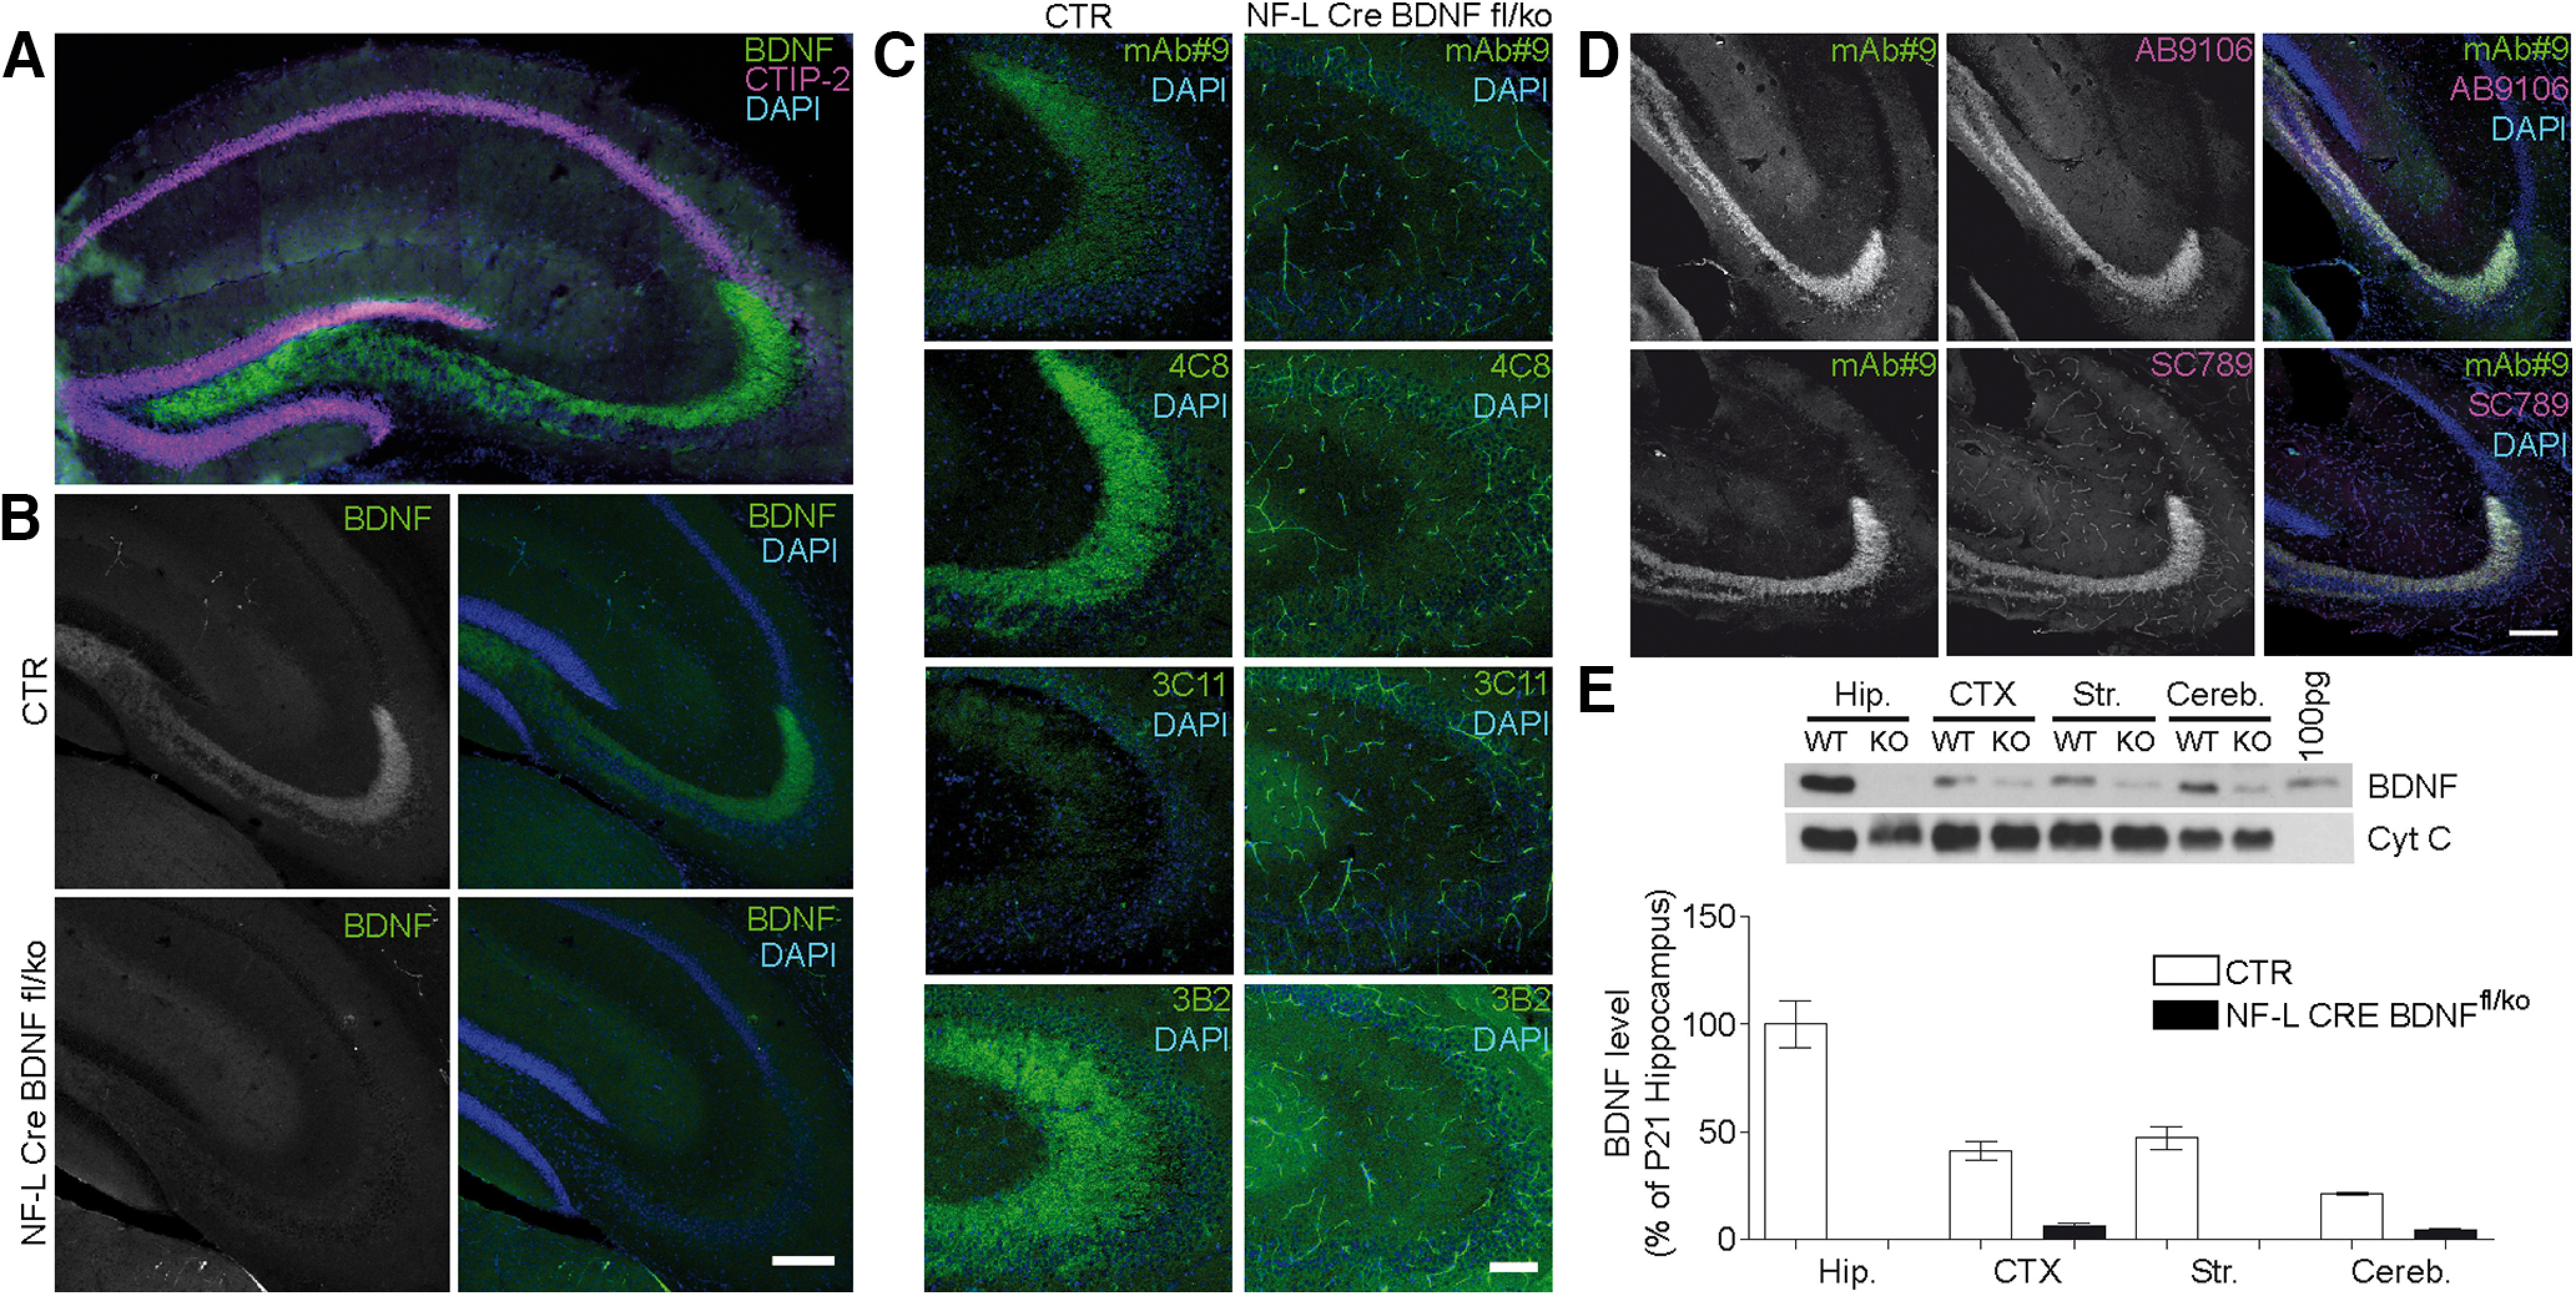
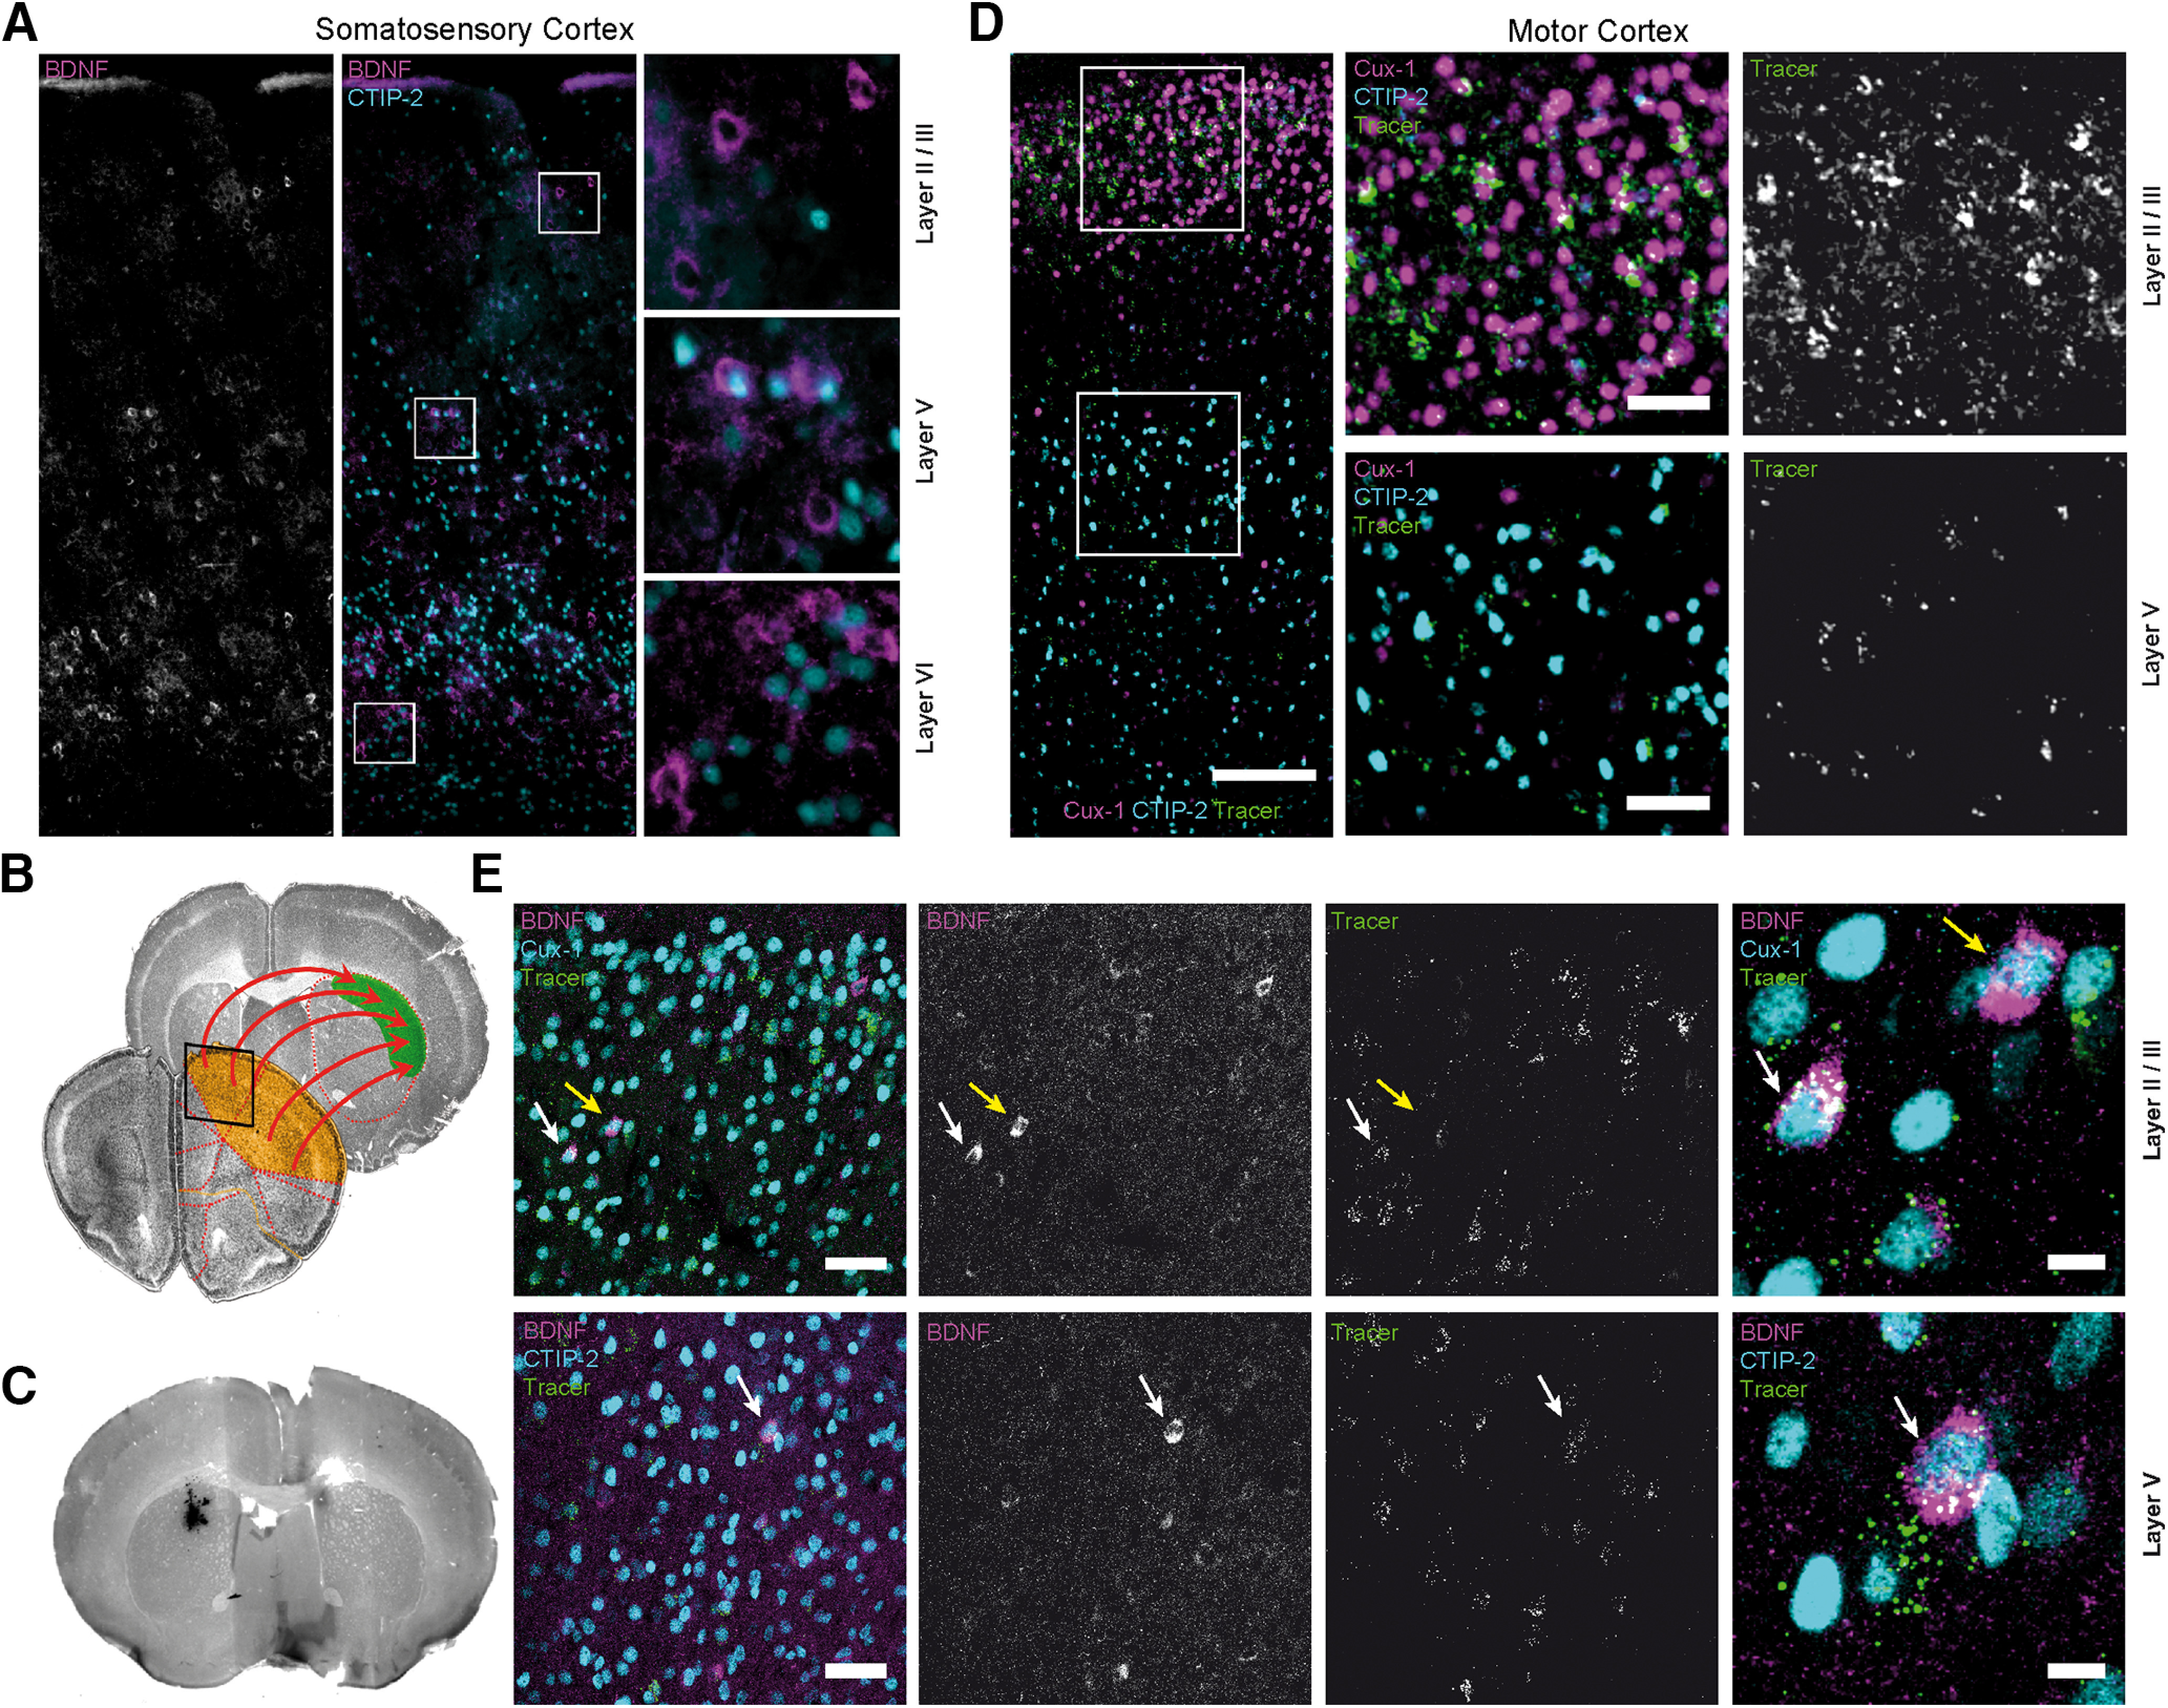
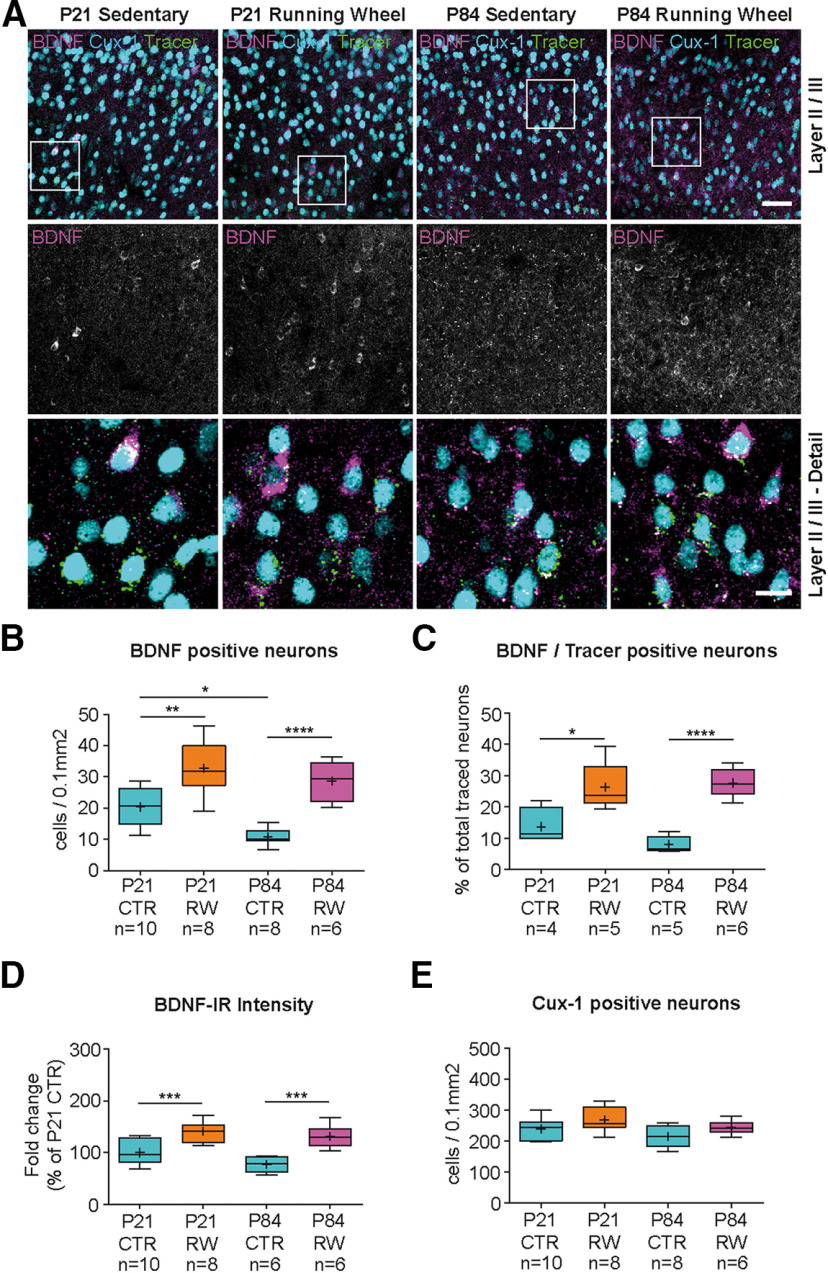
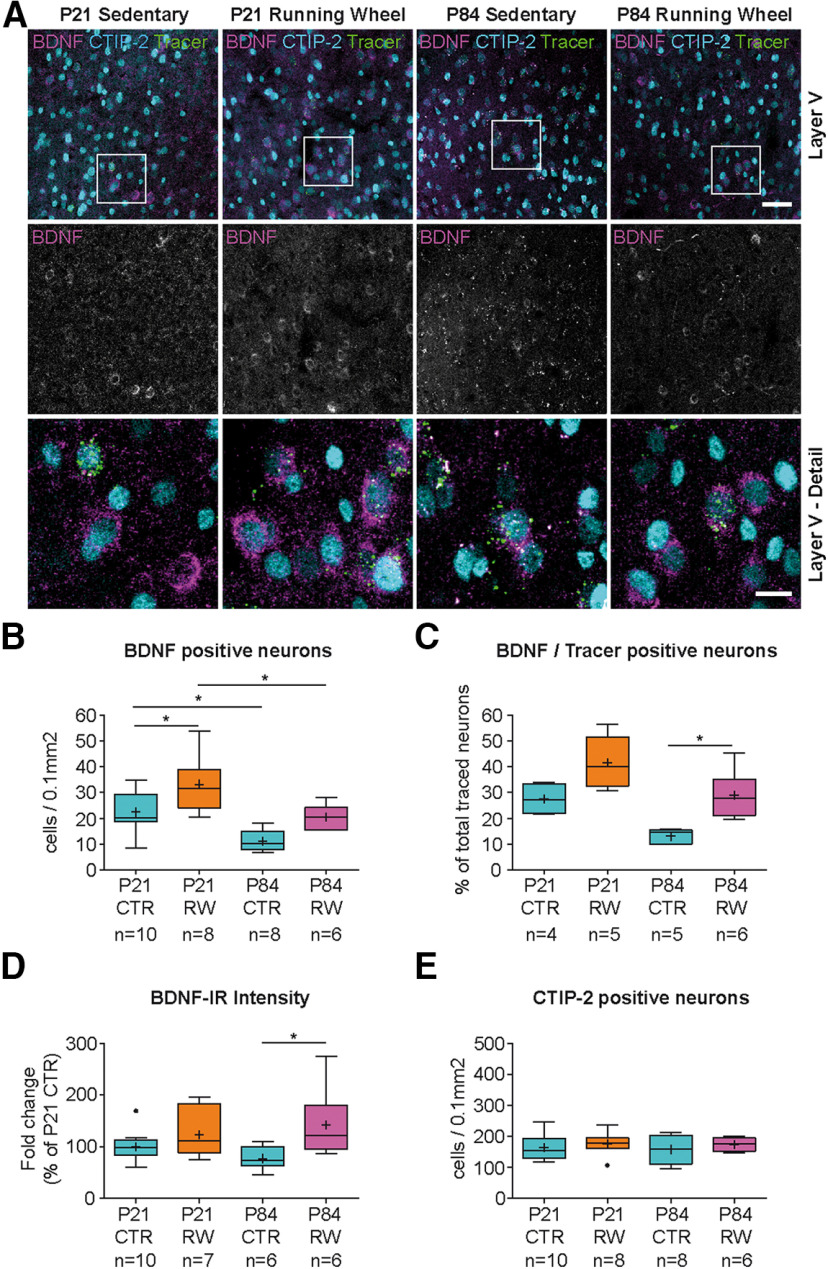
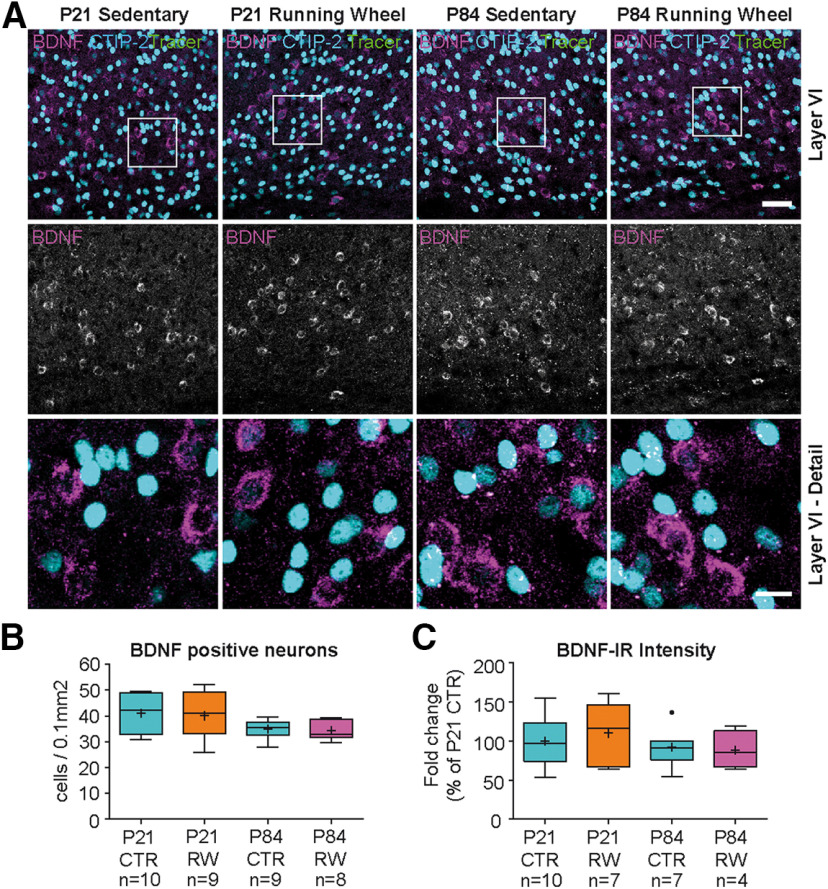
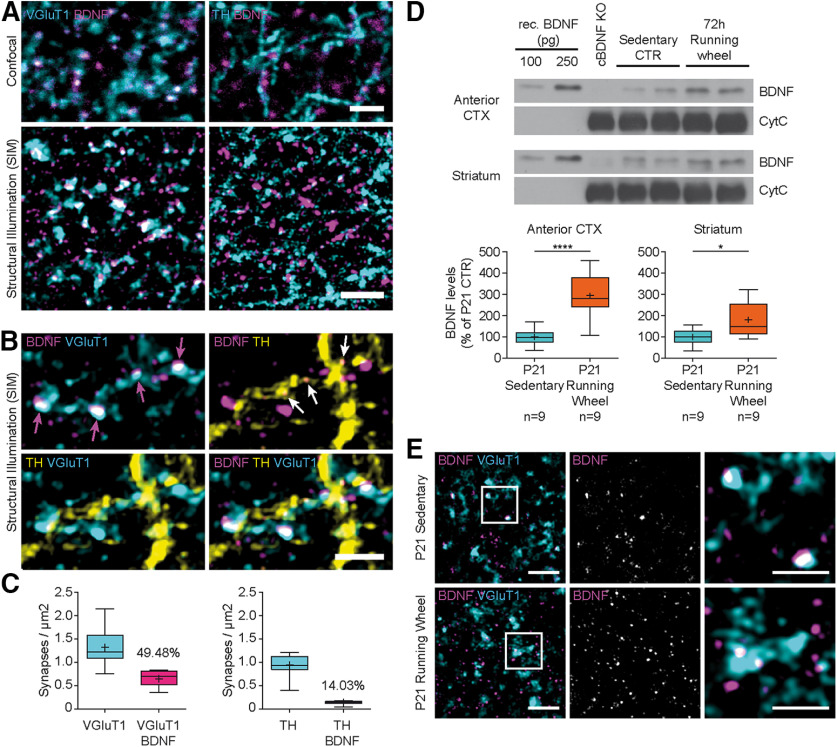
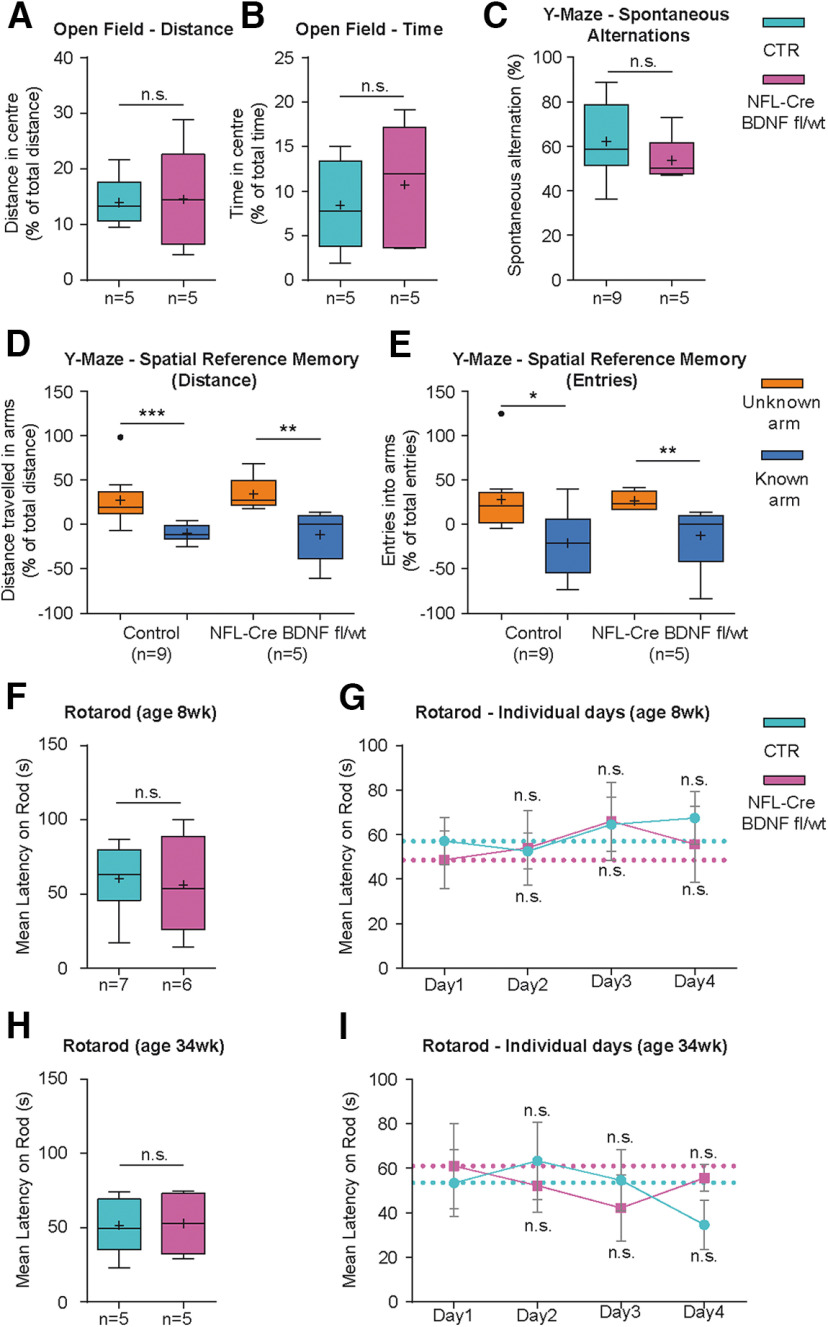
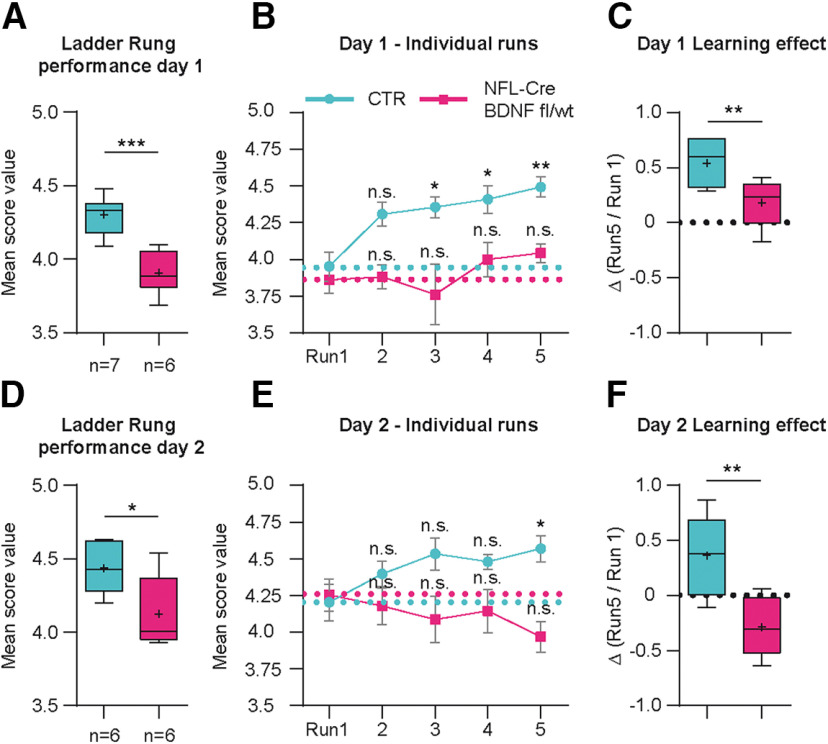
Motor learning depends on synaptic plasticity between corticostriatal projections and striatal medium spiny neurons. Retrograde tracing from the dorsolateral striatum reveals that both layer II/III and V neurons in the motor cortex express BDNF as a potential regulator of plasticity in corticostriatal projections in male and female mice. The number of these BDNF-expressing cortical neurons and levels of BDNF protein are highest in juvenile mice when adult motor patterns are shaped, while BDNF levels in the adult are low. When mice are trained by physical exercise in the adult, BDNF expression in motor cortex is reinduced, especially in layer II/III projection neurons. Reduced expression of cortical BDNF in 3-month-old mice results in impaired motor learning while space memory is preserved. These findings suggest that activity regulates BDNF expression differentially in layers II/III and V striatal afferents from motor cortex and that cortical BDNF is essential for motor learning.SIGNIFICANCE STATEMENT Motor learning in mice depends on corticostriatal BDNF supply, and regulation of BDNF expression during motor learning is highest in corticostriatal projection neurons in cortical layer II/III.

Keywords: BDNF; motor cortex; motor learning; neurotrophic factor; striatum.


Figures

Figure 1.
Figure 1.
Detection and quantification of BDNF in mouse hippocampus with different monoclonal antibodies. A, BDNF-IR using mAb#9 antibody in P21 WT C57Bl6/J hippocampus. CTIP-2 expression highlights granule cells in the dentate gyrus and pyramidal projection neurons in cornu ammonis (CA) 1-3. B, BDNF-IR in hippocampal mossy fiber projections of 8 week male WT C57Bl6/J versus NFL-Cre BDNFfl/ko hippocampus, using mAb#9. C, Specificity of 4 independent BDNF antibodies in CA3 mossy fiber terminals of WT C57Bl6/J (left column) and NFL-Cre BDNFfl/ko (right column). Clone 3C11 failed to detect endogenous BDNF. 3B2 produced high background in BDNF depleted hippocampal sections. The signal-to-noise ratio appeared best with mAb#9 and also with 4C8, which showed intense BDNF-IR. D, Double staining of BDNF and Myc in hippocampus of 8 week male BDNF-myc mice. Myc was costained with two independent polyclonal myc antibodies (Abcam, AB9106; Santa Cruz Biotechnology, SC789). E, BDNF protein levels in different CNS mouse brain areas, as determined by Western blot (top) with the 3C11 antibody and ELISA (bottom) using mAb#9 and mAB#1. P21 male WT C57Bl6/J (white bars) mice were compared with male NFL-Cre BDNFfl/ko mice (black bars) with bdnf gene recombination in most pyramidal neurons. Data are mean ± SEM. Hip, Hippocampus; CTX, anterior cortex; STR, striatum; Cereb, cerebellum (n = 3 for WT Hip, n = 5 for CTX, Cereb, STR, n = 2 for NFL Cre BDNFfl/ko Hip, CTX, STR, Cereb). Raw data are provided in Extended Data Figure 1-1 and Table 2. Image type: A, 2D merged single-plane image; B, D, maximum intensity projection; C, average intensity projection. Scale bars: B, D, 200 µm; C, 100 µm.
Figure 2.
Figure 2.
Alterations in brain BDNF levels during postnatal development. A, Sandwich ELISA analysis of relative BDNF protein levels (% of P20 hippocampus) shows a progressive increase of BDNF levels in all analyzed brain areas during the first 3 postnatal weeks. Anterior and posterior cortex shows the relatively highest increase in BDNF expression. Between P20 and P84, BDNF levels are downregulated in cortical and subcortical areas. B, BDNF-IR in hippocampal CA3 area of P21 (rows 1, 2) and P84 (rows 3, 4) mice. Single BDNF-expressing neurons are detected within the pyramidal cell layer in CA3 as well as in mossy fiber terminals at both ages. Voluntary physical activity in a running wheel leads to an increase in hippocampal BDNF-IR, which is more pronounced in 12-week-old animals compared with 3-week-old animals. Statistical analysis: A, One-way ANOVA, Tukey multiple comparison post-test (anterior CTX: F(3,9) = 36.18, p < 0.0001, ANOVA; posterior CTX: F(3,9) = 49.02, p < 0.0001, ANOVA; striatum: F(3,8) = 34.92, p < 0.0001, ANOVA; hippocampus: F(3,9) = 78.51; p < 0.0001, ANOVA). Data are presented as mean with SEM. n, number of independent animals. Raw data are provided in Extended Data Figure 2-1 and Table 2. Image type: B, maximum intensity projection. Scale bar: Hippocampus (CA3), 50 µm; CA3 (Detail), 25 µm. *p < 0.05; **p < 0.01; ***p < 0.001; ****p < 0.0001.
Figure 3.
Figure 3.
Tracing of corticostriatal projections. A, P21 mouse somatosensory cortex showing BDNF-IR in layers II/III, V, and VI. B, Representative coronal brain sections stained with DAPI. Images represent corticostriatal projections from prefrontal motor cortex (orange, boxed area represents the region depicted in D) to the dorsolateral striatum (green). C, Coronal brain section showing the injection site for fluorescent latex beads in the striatum. D, IHC staining of ipsilateral motor cortex (box in B), which corresponds to the region of highest tracer accumulation within corticostriatal projection neurons. Cux-1 and CTIP-2 label layers II/III and layers V/VI, respectively. Traced neurons were identified in layers II/III (top right) and upper layer V (bottom right). E, BDNF-IR in traced, Cux-1-positive neurons in layer II/III dorsal frontal cortex (top row, white arrow) and CTIP-2-positive neurons in layer V (bottom row, white arrow; see also Extended Data Fig. 3-1C,D; for statistics, see Extended Data Tables 4-1, 5-1). Not all BDNF-positive neurons contained retrograde tracer beads (yellow arrow). Raw data are provided in Table 2. Image type: A–C, 2D merged single-plane images; D, E, maximum intensity projection. Scale bars: D, Overview, 150 µm; Detail, 50 µm; E, Overview, 50 µm; Detail, 10 µm.
Figure 4.
Figure 4.
Physical activity increases BDNF expression in layers II/III of the motor cortex. A, BDNF-IR in layers II/III motor cortex (left column in A) shows same image as depicted in Figure 3E. P21 sedentary mice (column 1 from left) and runners (column 2); P84 sedentary (column 3) and runners (column 4; see also Extended Data Fig. 4-1). Number of retrogradely traced cortical neurons is shown in Extended Data Figure 4-2. B, Density of BDNF-IR-positive cells in layers II/III dorsal frontal cortex (see also Extended Data Figs. 4-1, 4-3A). P84 CTR mice show less BDNF-expressing neurons compared with P21 CTR animals. Physical activity leads to a significant increase in the number of BDNF-IR-positive cells at both ages (see Extended Data Figs. 4-1, 4-4A-C). C, BDNF-IR in traced corticostriatal neurons reveals a significant increase in the number of BDNF-positive neurons after physical activity (see Extended Data Fig. 4-1). D, Intensity of BDNF-IR per cell is decreased in layers II/III of P84 compared with P21 mice. Physical activity leads to a significant increase in BDNF-IR per cell at both ages compared with sedentary controls. E, The number of Cux-1-positive, layer II/III neurons and the number of traced neurons (see Extended Data Fig. 4-2A) are not affected by age or physical activity. Statistical analysis: one-way ANOVA, Tukey multiple comparison post-test (B: F(3,28) = 19.21, p < 0.0001, ANOVA; C: F(3,16) = 16.67, p < 0.0001, ANOVA; D: F(3,31) = 15.86, p < 0.0001, ANOVA; E: F(3,28) = 3.290, p = 0.0351, ANOVA). Data are presented as box and whiskers (Tukey). +, Mean. Vertical line indicates median. Black dots indicate outliers. n, number indicated below. Raw data are provided in Extended Data Figure 4-5 and Table 2. Image type: A, maximum intensity projection. Scale bars: A, 50 µm, Detail, 15 µm. *p < 0.05; **p < 0.01; ***p < 0.001; ****p < 0.0001.
Figure 5.
Figure 5.
Physical activity leads to minor changes in BDNF expression in layer V motor cortex. A, BDNF-IR in layer V motor cortex. P21 sedentary mice (column 1 from left) and runners (column 2; see also Extended Data Fig. 4-3B); P84 sedentary (column 3) and runners (column 4). B, Density of BDNF-IR-positive cells in layer V dorsal frontal cortex (see also Extended Data Figs. 4-4A,B,D, 5-1). P84 CTR mice show less BDNF-expressing neurons compared with P21 CTR animals. At P21, significant differences were only observed when high numbers of sections were analyzed (n = 45), whereas no significant increase was observed in the P84 group. C, BDNF-IR in traced corticostriatal neurons reveals a significant increase in the number of BDNF-expressing neurons after physical activity only in the P84 group (see Extended Data Fig. 5-1). D, Physical activity leads to a significant increase in the intensity of BDNF-IR per cell at P84, but not at P21, compared with sedentary controls. E, The number of CTIP-2-positive, layer V neurons and the number of traced neurons (see Extended Data Fig. 4-2B) are not affected by age or physical activity. Statistical analysis: one-way ANOVA, Tukey multiple comparison post-test (B: F(3,28) = 11.69, p < 0.0001, ANOVA; C: F(3,16) = 11.01, p = 0.0004, ANOVA; D: F(3,31) = 3.474, p = 0.0277, ANOVA; E: F(3,28) = 0.3743, p = 0.7722, ANOVA). Data are presented as box and whiskers (Tukey). +, Mean. Vertical line indicates median. Black dots indicate outliers. n, number indicated below. Raw data are provided in Extended Data Figure 5-2 and Table 2. Image type: A, maximum intensity projection. Scale bars: A, 50 µm, Detail, 15 µm. *p < 0.05.
Figure 6.
Figure 6.
BDNF expression in somatosensory cortex layer VI during postnatal development and after physical activity. A, BDNF-IR in layer VI somatosensory cortex compared in sedentary and exercised animals at P21 (column 1, 2 from left in A) and P84 (column 3, 4 in A). B, Relative number of BDNF-expressing cells per area in somatosensory cortex layer VI is not changed by physical exercise in a running wheel at P21 or P84. C, Quantification of BDNF-IR intensity per cell reveals no significant effect of age or physical activity. The number of CTIP-2-positive, layer VI neurons is not affected by age or physical activity (see Extended Data Fig. 4-2C). Statistical analysis: one-way ANOVA, Tukey multiple comparison post-test (B: F(3,32) = 2.531, p = 0.0746, ANOVA; C: F(3,24) = 0.5629, p = 0.6447, ANOVA). Data are presented as box and whiskers (Tukey). +, Mean. Vertical line indicates median. Black dots indicate outliers. n, number indicated below. Raw data are provided in Extended Data Figure 6-1 and Table 2. Scale bars: A, 50 µm, Detail, 15 µm.
Figure 7.
Figure 7.
BDNF is enriched in glutamatergic corticostriatal presynaptic terminals. A, Confocal (top) and SIM (bottom) microscopic images showing BDNF-IR in the same section in glutamatergic (left) versus dopaminergic terminals (right) in the dorsal striatum. B, BDNF-IR is present in VGluT1-positive terminals (magenta arrows). Single BDNF-IR signals overlap with TH (white arrows). VGluT1- and TH-positive terminals reside in direct regional proximity but do not overlap. C, Quantification of BDNF signals in VGluT1-positive terminals and TH-positive terminals. True colocalization between BDNF/VGluT1 was confirmed by Costes p value (Costes p > 0.95) but not between BDNF/TH (Costes p ≪ 0.95). D, Representative Western blots showing recombinant BDNF (lanes 1, 2) versus endogenous BDNF derived from anterior cortex or striatum of P21 NFL-Cre BDNFfl/ko mice (lane 3), P21 sedentary mice (lanes 4, 5), and P21 runners after 72 h voluntary running-wheel exercise (lanes 6, 7); 30 µg of protein lysate was loaded for each sample. BDNF levels were normalized to cytochrome C. Band intensities were determined from extracts of 9 independent mice and presented in % of P21 sedentary mice. Statistical analysis reveals significant increase in BDNF protein levels in both brain areas after running-wheel exercise. Statistical analysis: unpaired t test (anterior CTX: t = 5,312, p < 0.0001; striatum: t = 2,784, p = 0.0133). E, SIM images showing BDNF-IR in VGluT1-positive terminals in the dorsal striatum in sedentary mice (top row) and after 72 h of voluntary running-wheel exercise (bottom row). Data are presented as box and whiskers (Tukey). +, Mean. Vertical line indicates median. Black dots indicate outliers. n, number indicated below. Raw data are provided in Extended Data Figure 7-1 and Table 2. Scale bars: A, 2.5 µm; B, 1.5 µm; E, Overview, 2 µm; Detail, 1 µm. *p < 0.05; ****p < 0.0001.
Figure 8.
Figure 8.
Behavioral analysis of NFL-Cre BDNFfl/wt mice. A, B, Open Field test: Quantification of distance traveled (A) or time spent (B) in center (n, number indicated below). C, Y-Maze test: Quantification of spontaneous alternations between WT and NFL-Cre BDNFfl/wt mice during an 8 min run. D, E, Y-Maze test: Quantification of spatial reference memory by analysis of distance traveled (D) and number of arm entries (E) into unknown versus known arm during the first minute after entering the maze (individual tracks depicted in Extended Data Fig. 8-1). F, G, Rotarod test with 8-week-old mice: Mean latency spent on rod comparing BDNF wt with NFL-Cre BDNFfl/wt mice (F). Mean latency spent on rod on individual days comparing BDNF wt with NFL-Cre BDNFfl/wt mice (G). H, I, Rotarod test with 34-week-old mice. Mean latency spent on rod comparing BDNF wt with NFL-Cre BDNFfl/wt mice (H). Mean latency spent on rod on individual days comparing BDNF wt with NFL-Cre BDNFfl/wt mice (I). n, number indicated below. Data are presented as box and whiskers (Tukey). +, Mean. Vertical line indicates median. Black dots indicate outliers (A–F,H) or mean ± SEM (G,I). Statistical analysis: A, B, unpaired t test (A: t = 0.1225, p = 0.9055, unpaired t test; B: t = 0.5981, p = 0.5663, unpaired t test). C, Mann–Whitney test (Mann–Whitney U = 11.000, p = 0.1454). D, E, Unpaired t test (D: CTR t = 3.559, p = 0.0026; NFL-Cre BDNFfl/wt t = 2.873, p = 0.0207; E: CTR t = 2.718, p = 0.0152; NFL-Cre BDNFfl/wt t = 2.111, p = 0.0678). F, H, Unpaired t test (F: t = 0.2778, p = 0.7863; H: 0.09904, p = 0.9235). G, Two-way ANOVA, Friedman test (non-normal data distribution) revealed no significant improvement in rotarod test comparing day 1 with any of the following days within each group (Friedman statistic CTR: 5.957, p = 0.1137; NFL-Cre BDNFfl/wt 1.696, p = 0.6798). One-way ANOVA, Kruskal–Wallis test revealed no difference between WT and NFL-Cre BDNFfl/wt mice on any of the days tested (Kruskal–Wallis statistic 1.592, p = 0.9790). I, One-way ANOVA, Tukey test (normal data distribution WT F(2.264,9.057) = 0.8161, p = 0.4861, ANOVA) or Friedman test (non-normal distribution NFL-Cre BDNFfl/wt Friedman statistic: 1.938, p = 0.6255) revealed no significant improvement in rotarod test comparing day 1 with any of the following days within each group. One-way ANOVA, Kruskal–Wallis test revealed no difference between WT and NFL-Cre BDNFfl/wt mice on any of the days tested (Kruskal–Wallis statistic 3.119, p = 0.8738). Raw data are provided in Extended Data Figure 8-2 and Table 2. *p < 0.05; **p < 0.01; ***p < 0.001.
Figure 9.
Figure 9.
Motor learning is impaired in mice with reduced BDNF in cortical pyramidal neurons. A, D, Mean score values of 3-month-old mice from 5 runs at days 1 and 2 on an irregular ladder rung walking task (unpaired t test, A: t = 5.170, p = 0.0003; Mann–Whitney test, D: Mann–Whitney U 5.500, p = 0.0476). B, E, Mean score value of individual runs in the irregular ladder rung walking task on day 1 and 2. Asterisks indicate significant difference in mean score value between the individual run and the first run of the particular day of either CTR or NFL-Cre BDNFfl/wt mice. Dashed lines indicate mean score value of first run (data points indicated as mean ± SEM). Two-way-ANOVA, Bonferroni's multiple comparison test: B: F(4,44) = 1.769, p = 0.1522; ANOVA, E: F(4,40) = 4.515, p = 0.0042; ANOVA. C, F, Learning effect indicated as difference in score value between first and last run on the particular day (unpaired t test, C: t = 3.174, p = 0.0089, F: t = 3.536, p = 0.0054). Data are presented as box and whiskers (Tukey). +, Mean. Vertical line indicates median. Black dots indicate outliers. n, number indicated below. Raw data are provided in Extended Data Figure 9-1 and Table 2. *p < 0.05; **p < 0.01; ***p < 0.001.

References

    1. Alexander GE, DeLong MR, Strick PL (1986) Parallel organization of functionally segregated circuits linking basal ganglia and cortex. Annu Rev Neurosci 9:357–381. 10.1146/annurev.ne.09.030186.002041 - DOI - PubMed
    1. Altar CA, Cai N, Bliven T, Juhasz M, Conner JM, Acheson AL, Lindsay RM, Wiegand SJ (1997) Anterograde transport of brain-derived neurotrophic factor and its role in the brain. Nature 389:856–860. 10.1038/39885 - DOI - PubMed
    1. Arlotta P, Molyneaux BJ, Chen J, Inoue J, Kominami R, Macklis JD (2005) Neuronal subtype-specific genes that control corticospinal motor neuron development in vivo. Neuron 45:207–221. 10.1016/j.neuron.2004.12.036 - DOI - PubMed
    1. Baquet ZC, Gorski JA, Jones KR (2004) Early striatal dendrite deficits followed by neuron loss with advanced age in the absence of anterograde cortical brain-derived neurotrophic factor. J Neurosci 24:4250–4258. 10.1523/JNEUROSCI.3920-03.2004 - DOI - PMC - PubMed
    1. Baquet ZC, Bickford PC, Jones KR (2005) Brain-derived neurotrophic factor is required for the establishment of the proper number of dopaminergic neurons in the substantia nigra pars compacta. J Neurosci 25:6251–6259. 10.1523/JNEUROSCI.4601-04.2005 - DOI - PMC - PubMed

Publication types

Substances

LinkOut - more resources