. 2020 Oct;79(10):1349-1361.
doi: 10.1136/annrheumdis-2019-216312. Epub 2020 Jul 10.

Quantitative planar array screen of 1000 proteins uncovers novel urinary protein biomarkers of lupus nephritis

Affiliations

Quantitative planar array screen of 1000 proteins uncovers novel urinary protein biomarkers of lupus nephritis

Kamala Vanarsa et al. Ann Rheum Dis. 2020 Oct.

Abstract

Objective: The goal of these studies is to discover novel urinary biomarkers of lupus nephritis (LN).

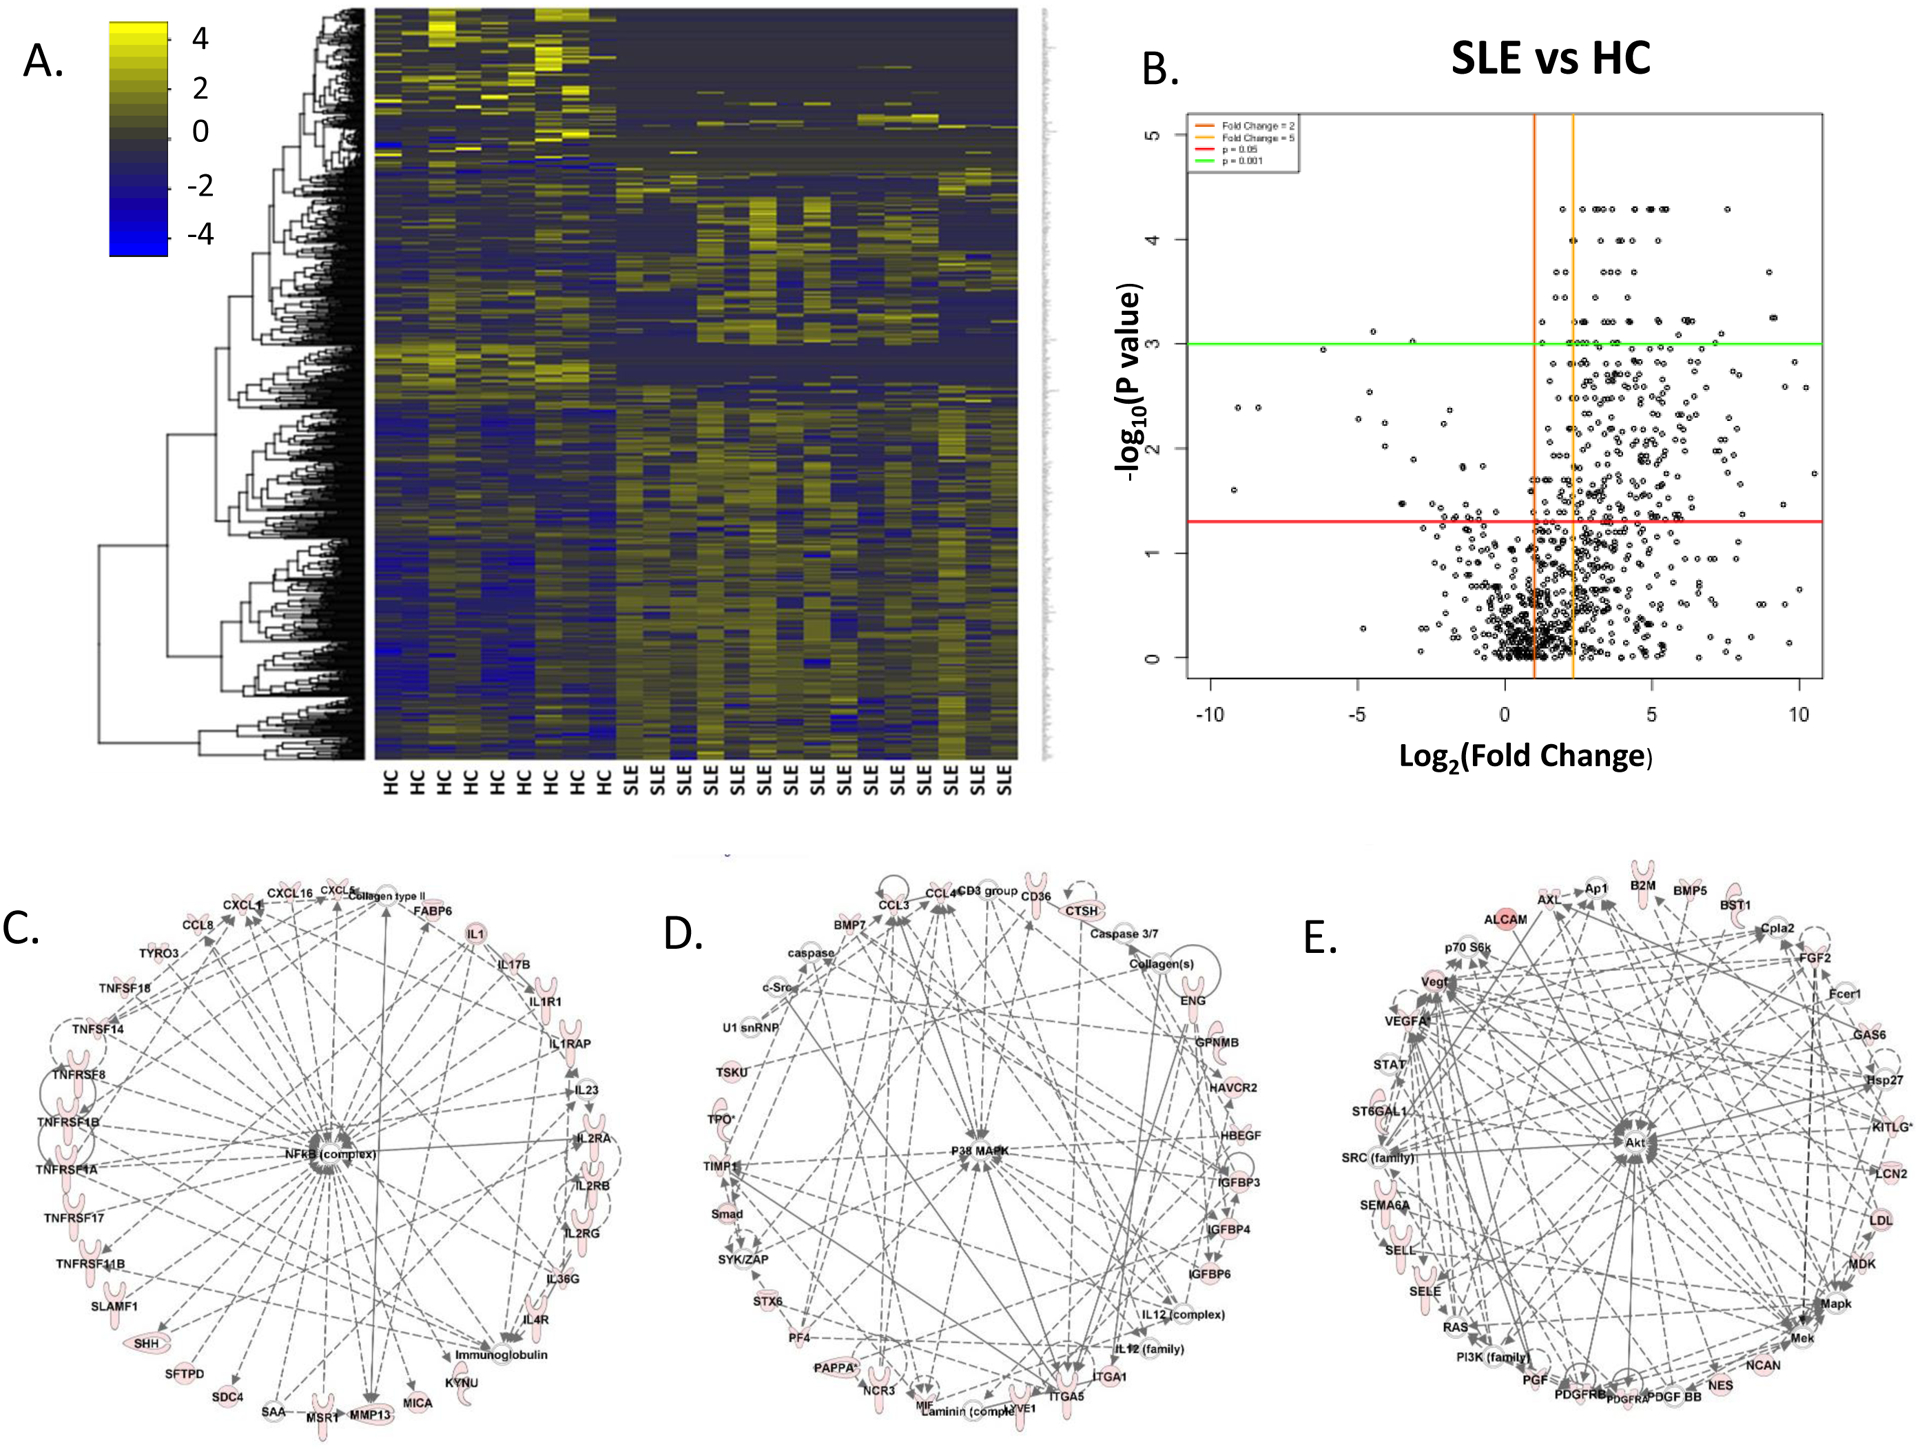
Methods: Urine from systemic lupus erythematosus (SLE) patients was interrogated for 1000 proteins using a novel, quantitative planar protein microarray. Hits were validated in an independent SLE cohort with inactive, active non-renal (ANR) and active renal (AR) patients, in a cohort with concurrent renal biopsies, and in a longitudinal cohort. Single-cell renal RNA sequencing data from LN kidneys were examined to deduce the cellular origin of each biomarker.

Results: Screening of 1000 proteins revealed 64 proteins to be significantly elevated in SLE urine, of which 17 were ELISA validated in independent cohorts. Urine Angptl4 (area under the curve (AUC)=0.96), L-selectin (AUC=0.86), TPP1 (AUC=0.84), transforming growth factor-β1 (TGFβ1) (AUC=0.78), thrombospondin-1 (AUC=0.73), FOLR2 (AUC=0.72), platelet-derived growth factor receptor-β (AUC=0.67) and PRX2 (AUC=0.65) distinguished AR from ANR SLE, outperforming anti-dsDNA, C3 and C4, in terms of specificity, sensitivity and positive predictive value. In multivariate regression analysis, urine Angptl4, L-selectin, TPP1 and TGFβ1 were highly associated with disease activity, even after correction for demographic variables. In SLE patients with serial follow-up, urine L-selectin (followed by urine Angptl4 and TGFβ1) were best at tracking concurrent or pending disease flares. Importantly, several proteins elevated in LN urine were also expressed within the kidneys in LN, either within resident renal cells or infiltrating immune cells, based on single-cell RNA sequencing analysis.

Conclusion: Unbiased planar array screening of 1000 proteins has led to the discovery of urine Angptl4, L-selectin and TGFβ1 as potential biomarker candidates for tracking disease activity in LN.

Keywords: autoimmunity; cytokines; lupus nephritis; systemic lupus erythematosus.


Conflict of interest statement

Competing interests: None declared.

Figures

Figure 1:
Figure 1:. Interrogation of 1000 urinary proteins in SLE patients and healthy controls.
Urine samples from healthy controls and SLE patients (total=24; HC=9, SLE=15, all with active disease) were interrogated for the levels of 1000 proteins, using a quantitative array platform, and creatinine normalized. A: Heat map of patient-group-supervised clustering (the columns) reveals the landscape of protein expression across the 24 urine samples (HC vs SLE), as determined from the protein array. The yellow-blue color scheme indicates the expression of each of the 1000 proteins (each row representing one protein), with yellow indicating overexpression and blue indicating under expression, compared to the median expression level for that protein. B: Volcano plot showing expression differences of 1000 proteins in the urine, when comparing log2 fold change of protein expression vs the negative log10 P-value, i.e. biological significance vs statistical significance. Each dot represents a protein and its average value for that subset (SLE vs HC). Horizontal lines depict significance with p <0.05 (red) and <0.001 (green). Vertical lines depict fold change of 2 (orange) and 5 (yellow), comparing the levels in SLE to the corresponding levels in HC. All biomarker data was normalized by creatinine concentration and analyzed using a 2-tailed Mann-Whitney U test. C-E: Protein expression pathways encompassed by the 302 significantly upregulated urinary proteins in SLE vs health controls (FC>2, at p≤0.05) as determined using Ingenuity Pathway Analysis included molecular networks regulated by NFKB signaling, p38 mitogen-activated protein kinase (MAPK), and AKT signaling, depicted in C-E, respectively, as well as other pathways (not shown). Proteins that are colored red were upregulated in SLE urine, with the intensity of the redness being proportional to the fold change.
Figure 2:
Figure 2:. Elevated urine proteins in SLE, as ascertained by fold change, statistical significance, and machine learning algorithms, based on screening of 1000 proteins.
A: Horizontal dot plot depicting the top-most 64 proteins elevated in SLE urine, all of which exhibit a fold change > 5 in SLE urine, p<0.05, and an average concentration > 2000 pg/mg in SLE urine, based on the array-based screen of 1000 proteins. Blue dots indicate urine protein levels in healthy controls and red dots indicate levels in SLE patients. B: Radar chart depicting the top 20 urine proteins based on random forest analysis comparing urine from SLE and healthy controls, again based on the array-based screen of 1000 proteins in 15 SLE patients, all of whom had active disease. Each point in the graph indicates the FC of each protein in SLE versus HC.
Figure 3:
Figure 3:. ELISA validation of array-based screening studies in an independent cross-sectional cohort of SLE patients.
A cohort of 78 urine samples: 16 healthy controls (black), 17 inactive SLE (blue), 16 active non-renal (ANR, green), and 29 active renal (AR, red) were tested by ELISA for the levels of Angptl4, FOLR2, GPC-5, L-selectin, PDGF-RB, PRX2, TGFβ−1, TPP-1, and TSP-1. Patients in the AR and ANR groups had comparable SLEDAI scores. All data is creatinine normalized. The asterisks designate the level of significance: *=p<0.05, **=p<0.01, *** = p<0.001, **** = p<0.0001, using a Mann-Whitney U-test.
Figure 4:
Figure 4:. Urine L-selectin, Angptl4, TGFβ1, PDGF-Rb and TPP1 are best at discriminating active renal SLE from active non-renal SLE.
Receiver operating characteristic curves for distinguishing active non-renal SLE from active renal SLE (A) and inactive SLE from active renal SLE (B) using urine Angptl4, L-selectin or TPP-1, all determined using ELISA (as in Fig. 3), and the corresponding ROC curves for anti-DNA, C3, and C4. The 5 urine proteins that were most discriminatory of active renal SLE from active non-renal SLE were urine Angptl4, L-selectin, TPP1, TGFβ1, and TSP-1; the last two are not plotted; see Supplementary Table S6. The discriminatory abilities of proteins distinguishing inactive SLE from active renal SLE are demonstrated in supplementary Table S7. (C) When multiple proteins were combined into panels, to evaluate if any particular combination of urine proteins exhibited further improvement in diagnostic potential, using Lasso regression analysis, the indicated combination of urine proteins exhibited the best diagnostic potential, with an AUC of 0.97, in distinguishing AR from active non-renal SLE.
Figure 5:
Figure 5:. Graphical representation of correlations between clinically measured parameters and the 9 urine biomarkers, as assayed by ELISA.
(A) Multivariate regression analysis was performed to assess how well each assayed urine protein predicted SLEDAI, rSLEDAI, proteinuria and/or PGA, based on linear regression analysis, and active renal SLE vs active non-renal SLE disease status, by logistic regression analysis. 1: Indicated in each cell is the regression coefficient, with an indication of statistical significance (*, p<0.05; **, p<0.01; ***, p<0.001; ****, p<0.0001). If an association maintained statistical significance after adjusting for demographic variables, this is indicated using bolded entries. (B) Bayesian network analysis of urine biomarkers in LN. Directed Acyclic graph depicting correlation between variables, created by using Maximum Spanning Tree algorithm. Size of nodes depicts node force, which is an estimate of the impact of that variable on all other variables in this network. Numbers indicate correlation between neighboring nodes. Colors of nodes indicate type of variables: green is a clinical index, purple is a biomarker molecule, brown represents disease status, white is other. (C) Correlation plot of clinical/laboratory parameters with biomarkers (proteins). Each square represents a correlation. A darker background indicates a lower p-value, as determined by Pearson correlation. The size of the dot in each square represents the magnitude of the correlation, with a bigger dot representing higher correlation. Blue dots indicate negative/inverse correlation. Orange dots indicate positive/direct correlation. Plot was drawn in R using the ggplot and ggraster functions.
Figure 6:
Figure 6:. Performance of urine Angptl4, L-selectin, TGFβ1, and TPP1 in tracking disease activity during serial follow-up of LN patients.
The visit month is shown on the x-axis, while the disease activity index and biomarker levels are indicated on the left and right vertical axes, respectively. The serial tracking plots demonstrated the fluctuations of urine Angptl4, L-selectin, TGFβ1, and TPP1 along with SLEDAI, rSLEDAI, and urine protein to creatinine ratio over time. In some visits, these proteins elevated simultaneously (marked with “@”) with the increase of disease activity as reflected by the SLEDAI or rSLEDAI indices or UrPrCr ratio, and in other visits, these proteins preceded the clinical flares (marked using “p”). Statistical analyses of these data highlighted urine L-selectin, Angptl4, and TGFβ1 as proteins that best tracked disease activity over time, as detailed under Results.
Figure 7:
Figure 7:. Urine Angptl4, L-selectin, TGFβ1 and TPP1 in other CKD controls
Urine Angptl4, L-selectin, TGFβ1, and TPP1 were assayed in 47 CKD patients, including 14 patients with diabetic nephropathy (DN), 11 patients with hypertensive nephropathy (HN), 9 patients with focal segmental glomerulosclerosis (FSGS), and 13 with other causes of CKD. Shown in (B) are urine Angptl4 levels in the same CKD controls, parsed by CKD stage (stages 1 to 5). All data is creatinine normalized. The asterisks designate the level of significance: *=p<0.05, **=p<0.01, *** = p<0.001, **** = p<0.0001, using a Mann-Whitney U-test.
Figure 8:
Figure 8:. Violin plots of single-cell RNAseq data for the 9 candidate proteins in lupus nephritis renal tissue drawn from 45 LN biopsy tissues.
Renal single-cell RNAseq data obtained 21 LN biopsies (A) (18) and single-cell RNAseq data from renal-infiltrating immune cells from 24 independent LN biopsies (B) (19) were analyzed for the expression profile of each of the 9 biomarker proteins. Cells were divided into clusters based on the expression of canonical genes. Dots represent individual cells with their respective log expression level for each candidate biomarker. The profile for every cell type is shown for each biomarker. Each color represents a particular cell type, e.g., B-cells are purple, and mesangial cells are orange, in (A). For the renal-infiltrating cells in (B), the cluster annotations are as follows (19) - CM0: CD16+ macrophage, inflammatory; CM1: CD16+ macrophage, phagocytic; CM2: Tissue-resident macrophage; CM3: cDCs; CM4: CD16+ macrophage, M2-like; CT0a: Effector memory CD4+ T cells; CT0b: Central memory CD4+ T cells; CT1: CD56_dim CD16+ NK cells; CT2: CTLs; CT3a: Tregs; CT3b: TFH-like cells; CT4: GZMK+ CD8+ T cells; CT5a: Resident memory CD8+ T cells; CT5b: CD56_bright CD16- NK cells; CT6: ISG-high CD4+ T cells; CB0: Activated B cells; CB1: Plasma cells/Plasmablasts; CB2a: Naive B cells; CB2b: pDCs; CB3: ISG-high B cells; CD0: Dividing cells; CE0: Epithelial cells.

References

    1. Pisetsky DS. Anti-DNA antibodies — quintessential biomarkers of SLE. Nature Reviews Rheumatology 2016;12:102–10. - PubMed
    1. Bandyopadhyay S, Connolly SE, Jabado O, Ye J, Kelly S, Maldonado MA, et al. Identification of biomarkers of response to abatacept in patients with SLE using deconvolution of whole blood transcriptomic data from a phase IIb clinical trial. Lupus Science & Medicine 2017;4:e000206. - PMC - PubMed
    1. Soliman S, Chandra Mohan. Lupus nephritis biomarkers. Clinical Immunology 2017;185:10–20. - PubMed
    1. Rovin BH, Song H, Birmingham DJ, Hebert LA, Yu CY, Nagaraja HN. Urine Chemokines as Biomarkers of Human Systemic Lupus Erythematosus Activity. JASN 2005;16:467–73. - PubMed
    1. Schwartz N, Michaelson JS, Putterman C. Lipocalin-2, TWEAK, and Other Cytokines as Urinary Biomarkers for Lupus Nephritis. Annals of the New York Academy of Sciences 2007;1109:265–74. - PubMed

Publication types