. 2020 Sep 1;86(18):e01150-20.
doi: 10.1128/AEM.01150-20. Print 2020 Sep 1.

Oral or Topical Exposure to Glyphosate in Herbicide Formulation Impacts the Gut Microbiota and Survival Rates of Honey Bees

Affiliations

Oral or Topical Exposure to Glyphosate in Herbicide Formulation Impacts the Gut Microbiota and Survival Rates of Honey Bees

Erick V S Motta et al. Appl Environ Microbiol. .

Abstract

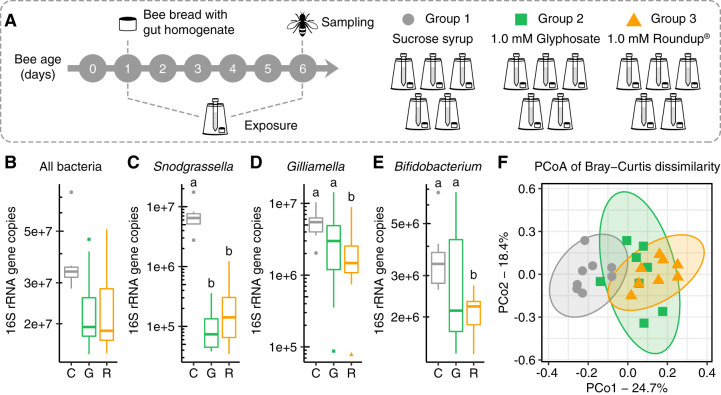
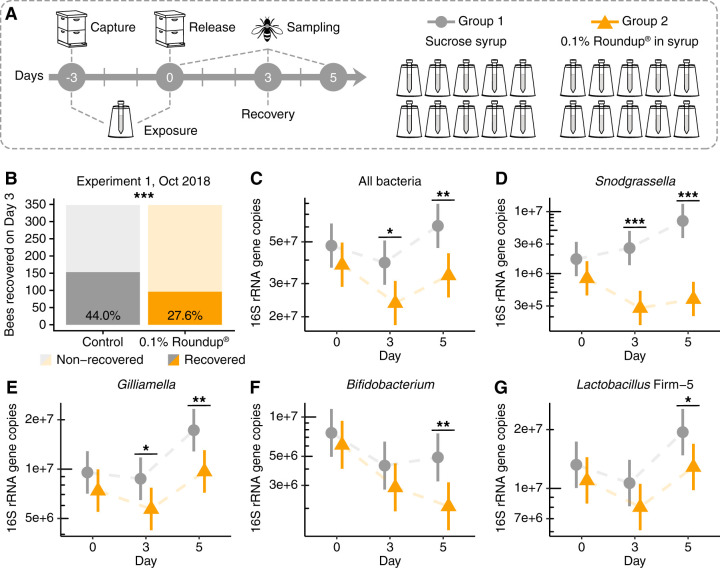
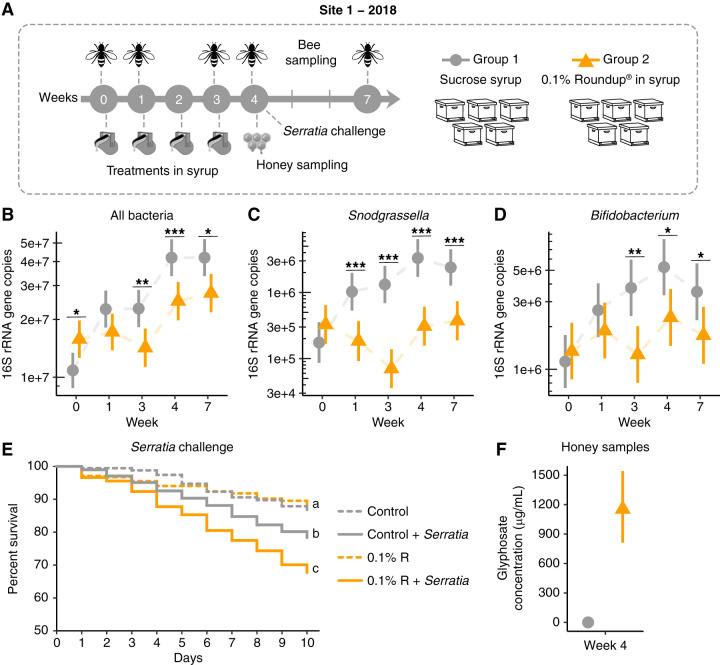
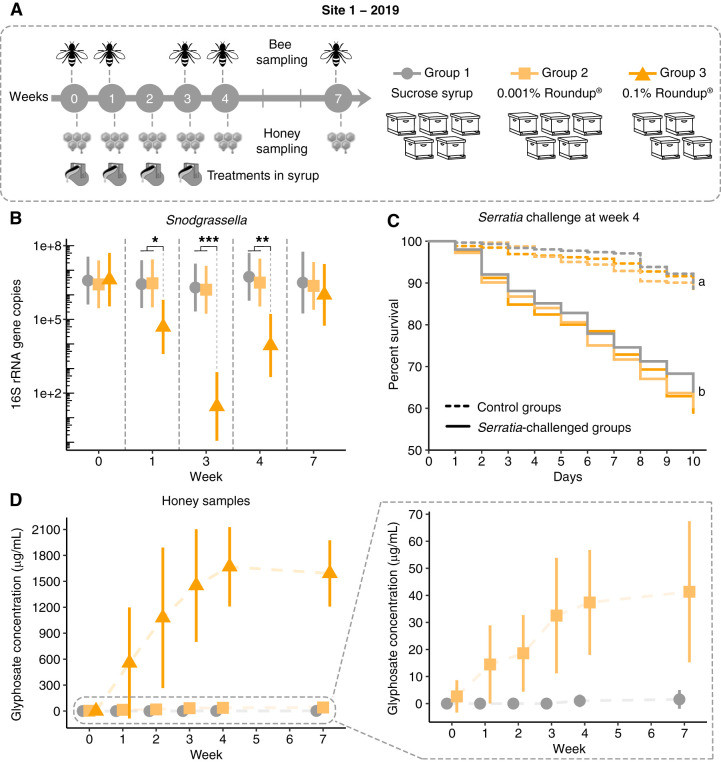
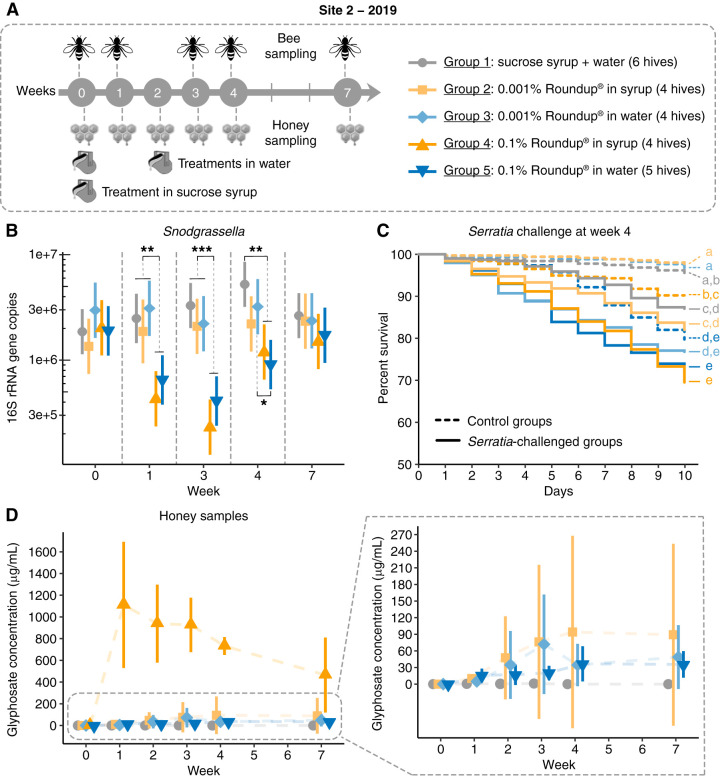
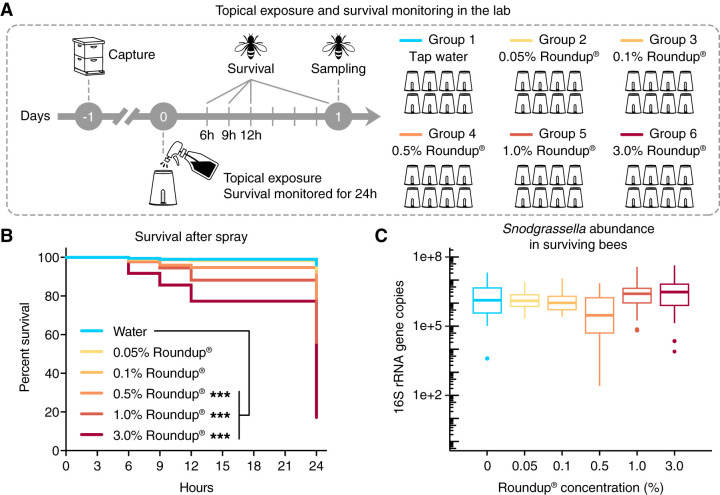
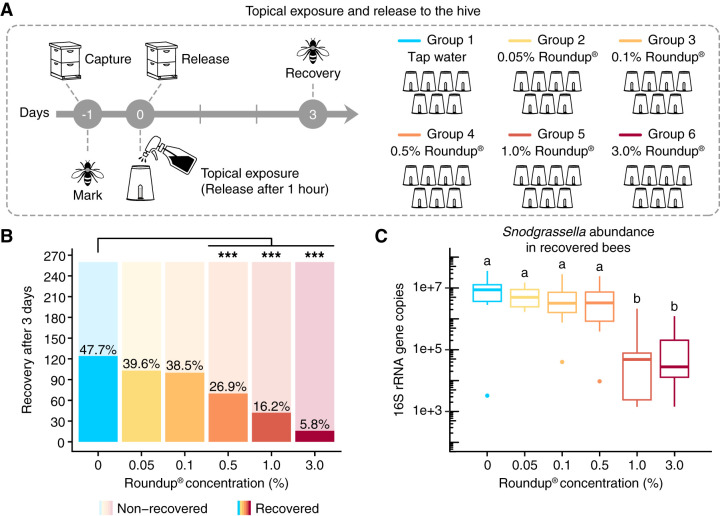
Honey bees are important agricultural pollinators that rely on a specific gut microbiota for the regulation of their immune system and defense against pathogens. Environmental stressors that affect the bee gut microbial community, such as antibiotics and glyphosate, can indirectly compromise bee health. Most of the experiments demonstrating these effects have been done under laboratory conditions with pure chemicals. Here, we investigated the oral and topical effects of various concentrations of glyphosate in a herbicide formulation on the honey bee gut microbiota and health under laboratory and field conditions. Under all of these conditions, the formulation, dissolved in sucrose syrup or water, affected the abundance of beneficial bacteria in the bee gut in a dose-dependent way. Mark-recapture experiments also demonstrated that bees exposed to the formulation were more likely to disappear from the colony, once reintroduced after exposure. Although no visible effects were observed for hives exposed to the formulation in field experiments, challenge trials with the pathogen Serratia marcescens, performed under laboratory conditions, revealed that bees from hives exposed to the formulation exhibited increased mortality compared with bees from control hives. In the field experiments, glyphosate was detected in honey collected from exposed hives, showing that worker bees transfer xenobiotics to the hive, thereby extending exposure and increasing the chances of exposure to recently emerged bees. These findings show that different routes of exposure to glyphosate-based herbicide can affect honey bees and their gut microbiota.IMPORTANCE The honey bee gut microbial community plays a vital role in immune response and defense against opportunistic pathogens. Environmental stressors, such as the herbicide glyphosate, may affect the gut microbiota, with negative consequences for bee health. Glyphosate is usually sprayed in the field mixed with adjuvants, which enhance herbicidal activity. These adjuvants may also enhance undesired effects in nontargeted organisms. This seems to be the case for glyphosate-based herbicide on honey bees. As we show in this study, oral exposure to either pure glyphosate or glyphosate in a commercial herbicide formulation perturbs the gut microbiota of honey bees, and topical exposure to the formulation also has a direct effect on honey bee health, increasing mortality in a dose-dependent way and leaving surviving bees with a perturbed microbiota. Understanding the effects of herbicide formulations on honey bees may help to protect these important agricultural pollinators.

Keywords: Apis mellifera; glyphosate; gut microbiome; herbicide.


Figures

FIG 1
FIG 1
The effects of glyphosate and Roundup formulation on the honey bee gut microbiota. (A) Newly emerged workers were exposed to 1.0 mM glyphosate in sucrose syrup, 1.0 mM Roundup in sucrose syrup, or only sucrose syrup for 5 days. (B to E) Box plots of absolute abundance of total bacteria (B), Snodgrassella alvi (C), Gilliamella spp. (D), and Bifidobacterium spp. (E) in the guts of bees sampled from control, glyphosate, and Roundup groups (n = 8 for each group). Groups with distinct letters are statistically different (P < 0.05, Kruskal-Wallis test followed by Dunn’s multiple-comparison test). (F) Principal coordinate analysis of Bray-Curtis dissimilarity of gut community compositions of control, glyphosate, and Roundup groups.
FIG 2
FIG 2
Recovery rates and gut microbial changes for honey bees returned to the hive after oral exposure to 0.1% Roundup formulation. (A) Experimental design. (B) Number of worker bees recovered from the hive at day 3 posttreatment (***, P < 0.001, chi-squared test). (C to G) Scatterplots of bacterial abundances in the guts of control and treatment bees sampled at days 0, 3, and 5 posttreatment (n = 15 for each group and time point), with error bars indicating 95% confidence intervals. Total 16S rRNA gene copies were estimated by qPCR and corrected for rRNA operon number per genome. Generalized linear mixed-effects models assuming Poisson regression were used to compare changes in bacterial abundances between control and treatment bees per sampling time. Mixed models were fitted using the package lme4 and followed by post hoc tests using package emmeans (86). *, P < 0.05; **, P < 0.01; and ***, P < 0.001.
FIG 3
FIG 3
Gut microbial changes and susceptibility to bacterial infections in honey bees from hives exposed to Roundup formulation in site 1 in 2018. (A) Field experiment performed in site 1 in 2018. Ten hives were split into 2 groups to be exposed to 0.5 liters of sucrose syrup or 0.1% Roundup formulation dissolved in sucrose syrup at weeks 0, 1, 2, and 3. Treatment was placed in a reservoir inside the hives to avoid cross-contamination. Bees were sampled at weeks 0, 1, 3, 4, and 7. Uncapped honey samples were collected at week 4. (B to D) Scatterplots showing abundances of total bacteria (B), Snodgrassella alvi (C), and Bifidobacterium spp. (D) in the guts of bees sampled from control (sucrose syrup) and treatment (0.1% Roundup in syrup) groups on weeks 0, 1, 3, 4, and 7, with error bars indicating 95% confidence intervals (n = 5 hives per group, 15 bees per hive) per sampling time. Generalized linear mixed-effects models assuming Poisson regression were used to compare changes in bacterial abundances between control and treatment groups. Mixed models were fitted using the package lme4 (85) and followed by post hoc tests using the package emmeans (86). *, P < 0.05; **, P < 0.01; and ***, P < 0.001. (E) Survival rates of worker bees after Serratia marcescens kz19 exposure, shown as a Kaplan-Meier survival curve. Worker bees were sampled from all hives at week 4 and exposed or not exposed to Serratia marcescens kz19 under laboratory conditions for 10 days (n = 5 hives per condition, 3 cup cages per hive, at least 25 bees per cup cage). *, P < 0.05; ***, P < 0.001 (Cox proportional hazards model implemented in the package “survival”). (F) Glyphosate concentration detected in uncapped honey samples from control and treatment groups (n = 5 hives per group) at week 4.
FIG 4
FIG 4
Gut microbial changes and susceptibility to bacterial infections in honey bees from hives exposed to Roundup formulation in site 1 in 2019. (A) Field experiment performed in site 1 in 2019. Fourteen hives were split into 3 groups to be exposed to 0.5 liters of sucrose syrup or 0.001% or 0.1% Roundup formulation dissolved in sucrose syrup at weeks 0, 1, 2, and 3. Treatment was placed in a reservoir inside the hives to avoid cross-contamination. Bees were sampled at weeks 0, 1, 3, 4, and 7. Uncapped honey samples were collected at weeks 0, 1, 2, 3, 4, and 7. (B) Scatterplot of Snodgrassella alvi abundance in the guts of bees sampled from control (sucrose syrup) and treatment (0.001% and 0.1% Roundup in syrup) groups on weeks 0, 1, 3, 4, and 7, with error bars indicating 95% confidence intervals. For group 1: n = 5 for weeks 0, 1, 3, and 4; n = 3 for week 7. For group 2: n = 5. For group 3: n = 4 for weeks 0 and 1; n = 3 for weeks 3, 4, and 7. Each hive is represented by 15 pooled bee guts. Generalized linear mixed-effects models assuming Poisson regression were used to compare changes in bacterial abundances between control and treatment hives per sampling time. Mixed models were fitted using the package lme4 (85) and followed by post hoc tests using the package emmeans (86). *, P < 0.05; **, P < 0.01; and ***, P < 0.001. (C) Survival rates of worker bees after Serratia marcescens kz19 exposure, shown as a Kaplan–Meier survival curve. Worker bees were sampled from representative hives from each group at week 4 and exposed or not exposed to Serratia marcescens kz19 under laboratory conditions for 10 days (n = 3 hives per condition, 3 cup cages per hive, at least 25 bees per cup cage). *, P < 0.05; ***, P < 0.001 (Cox proportional hazards model implemented in the package “survival”). (D) Glyphosate concentration detected in uncapped honey samples collected from control (n = 5, all weeks), 0.001% Roundup-treated (n = 5, all weeks), and 0.1% Roundup-treated (n = 4 for weeks 0, 1, and 2; n = 3 for weeks 3, 4, and 7) hives.
FIG 5
FIG 5
Gut microbial changes and susceptibility to bacterial infections in honey bees from hives exposed to Roundup formulation in site 2 in 2019. (A) Field experiment performed in site 2 in 2019. Twenty-three hives were split into 5 groups to be exposed to 0.001% or 0.1% Roundup formulation dissolved in sucrose syrup or water. Treatment in syrup (0.5 liters) was provided at week 0 in a reservoir inside each hive. Treatment in water (0.45 liters) was provided at weeks 0 and 2 in a glass bottle with a punched cap connected to a plastic boardman and attached to the hive entry. Bees were sampled at weeks 0, 1, 3, 4, and 7. Uncapped honey samples were collected at weeks 0, 1, 2, 3, 4, and 7. (B) Scatterplot of Snodgrassella alvi abundance in the guts of bees sampled from control and treatment groups on weeks 0, 1, 3, 4, and 7, with error bars indicating 95% confidence intervals. For group 1: n = 6 for weeks 0, 3, 4, and 7; n = 5 for week 1. For group 2: n = 4 for weeks 0, 3, 4, and 7; n = 3 for week 1. For groups 3 and 4: n = 4. For group 5: n = 5 for weeks 0, 1, 3, and 4; n = 4 for week 7 Each hive is represented by 15 pooled bee guts. Generalized linear mixed-effects models assuming Poisson regression were used to compare changes in bacterial abundances between control and treatment groups per sampling time. Mixed models were fitted using the package lme4 (85) and followed by post hoc tests using the package emmeans (86). *, P < 0.05; **, P < 0.01; and ***, P < 0.001. (C) Survival rates of worker bees after Serratia marcescens kz19 exposure, shown as a Kaplan-Meier survival curve. Worker bees were sampled from representative hives from each group at week 4 and exposed or not exposed to Serratia marcescens kz19 under laboratory conditions for 10 days (n = 3 hives per condition, 3 cup cages per hive, at least 25 bees per cup cage). *, P < 0.05; ***, P < 0.001 (Cox proportional hazards model implemented in the “survival” package in R). (D) Glyphosate concentration detected in uncapped honey samples collected from control (n = 6) and treatment (0.001% Roundup in syrup, n = 4; 0.001% Roundup in water, n = 4; 0.1% Roundup in syrup, n = 4; 0.1% Roundup in water, n = 5) groups at weeks 0, 1, 2, 3, 4, and 7.
FIG 6
FIG 6
Survival rates and gut microbial changes of honey bees topically exposed to Roundup formulation under laboratory conditions. (A) Worker bees were split into 6 groups to be sprayed with different concentrations of glyphosate in the herbicide formulation in water. Survivorship was monitored for 24 hours under laboratory conditions. (B) Survival rates of worker bees after topical exposure to a glyphosate-based formulation over a period of 24 hours, shown as a Kaplan-Meier survival curve (n = 10 cup cages per group, 38 to 40 bees per cup cage). ***, P < 0.001 (Cox proportional hazards model implemented in the package “survival”). (C) Box plots of Snodgrassella alvi abundance in the guts of survived bees 24 hours after spray, measured by qPCR (n = 15 bees per group). Box-and-whisker plots show high, low, and median values, with lower and upper edges of each box denoting first and third quartiles. No significant changes were observed by Kruskal-Wallis test.
FIG 7
FIG 7
Recovery rates and gut microbial changes of honey bees topically exposed to Roundup formulation under hive conditions. (A) Worker bees were split into 6 groups and marked on the thorax with different colors of paint. Groups were sprayed with different concentrations of a glyphosate-based formulation in water and released back to their hive. All marked bees were recovered on day 3 postspray. (B) Recovery rates of worker bees topically exposed to a glyphosate-based formulation on day 3 postspray (n = 7 replicates per group, 35 to 40 bees per replicate). ***, P < 0.001 (chi-squared test followed by Bonferroni’s correction). (C) Box plots of Snodgrassella alvi abundance in the guts of recovered bees on day 3 postspray, measured by qPCR (n = 15 bees per group). Box-and-whisker plots show high, low, and median values, with lower and upper edges of each box denoting first and third quartiles. Groups with distinct letters are statistically different (P < 0.001, Kruskal-Wallis test followed by Dunn’s multiple-comparison test).

Similar articles

Cited by

References

    1. Forsgren E. 2010. European foulbrood in honey bees. J Invertebr Pathol 103:S5–S9. doi:10.1016/j.jip.2009.06.016. - DOI - PubMed
    1. Genersch E. 2010. American foulbrood in honeybees and its causative agent, Paenibacillus larvae. J Invertebr Pathol 103:S10–S19. doi:10.1016/j.jip.2009.06.015. - DOI - PubMed
    1. Raymann K, Coon KL, Shaffer Z, Salisbury S, Moran NA. 2018. Pathogenicity of Serratia marcescens strains in honey bees. mBio 9:e01649-18. doi:10.1128/mBio.01649-18. - DOI - PMC - PubMed
    1. Burritt NL, Foss NJ, Neeno-Eckwall EC, Church JO, Hilger AM, Hildebrand JA, Warshauer DM, Perna NT, Burritt JB. 2016. Sepsis and hemocyte loss in honey bees (Apis mellifera) infected with Serratia marcescens strain Sicaria. PLoS One 11:e0167752. doi:10.1371/journal.pone.0167752. - DOI - PMC - PubMed
    1. McMenamin AJ, Genersch E. 2015. Honey bee colony losses and associated viruses. Curr Opin Insect Sci 8:121–129. doi:10.1016/j.cois.2015.01.015. - DOI - PubMed

Publication types