. 2020 Jul 28;117(30):17785-17795.
doi: 10.1073/pnas.2003499117. Epub 2020 Jul 10.

Pharmacologic induction of innate immune signaling directly drives homologous recombination deficiency

Affiliations

Pharmacologic induction of innate immune signaling directly drives homologous recombination deficiency

Lena J McLaughlin et al. Proc Natl Acad Sci U S A. .

Abstract

Poly(ADP ribose) polymerase inhibitors (PARPi) have efficacy in triple negative breast (TNBC) and ovarian cancers (OCs) harboring BRCA mutations, generating homologous recombination deficiencies (HRDs). DNA methyltransferase inhibitors (DNMTi) increase PARP trapping and reprogram the DNA damage response to generate HRD, sensitizing BRCA-proficient cancers to PARPi. We now define the mechanisms through which HRD is induced in BRCA-proficient TNBC and OC. DNMTi in combination with PARPi up-regulate broad innate immune and inflammasome-like signaling events, driven in part by stimulator of interferon genes (STING), to unexpectedly directly generate HRD. This inverse relationship between inflammation and DNA repair is critical, not only for the induced phenotype, but also appears as a widespread occurrence in The Cancer Genome Atlas datasets and cancer subtypes. These discerned interactions between inflammation signaling and DNA repair mechanisms now elucidate how epigenetic therapy enhances PARPi efficacy in the setting of BRCA-proficient cancer. This paradigm will be tested in a phase I/II TNBC clinical trial.

Keywords: DNA methyltransferase inhibitors; Fanconi anemia; homologous recombination deficiency; poly(ADP-ribose) polymerase inhibitors; stimulator of interferon signaling.


Conflict of interest statement

Competing interest statement: F.V.R. and S.B.B. are co-inventors on US Provisional Patent Application Number 61/929,680 for the concept of the combinatorial therapy.

Figures
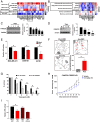
Fig. 1.
Fig. 1.
Low doses of DNMTi generate an HRD effect in BRCA-proficient TNBC and OC. (A and B) Heatmap of Z score based on fold change of relative RNA expression for a subset FA and HR genes in six TNBC (HCC1143, MDA-MB-468, HCC1806, BT549, MDA-MB-231, and SUM159PT) (A) and six OC (A2780, TykNu, OAW-42, OVCA429, PEO4, and EF027) (B) BRCA-proficient cell lines (qRT-PCR, day 10, 150 nM to 500 nM Aza). (C and D) Immunoblot for FANCD2 in MDA-MB-231 (C) and in A2780 (D) treated with 500 nM Aza for the indicated number of days relative to vehicle (M) with β-actin used as a loading control (n = 3). (E) Relative HR activity analysis of GFP+ cells by flow cytometry after transfection of I-SceI in TNBC cell lines MDA-MB-231 and SUM159, and OC cell line A2780 stably transfected with pDR-GFP reporter after treatment for 6 d (TNBC) or 10 d (OC) (500 nM Aza, n = 3). (F) Representative images (Upper Left, Upper Right, and Lower Left) and quantification (Lower Right) for cytogenetic analysis of chromosomal breaks and exchanges in vehicle or Aza-treated MDA-MB-231 ± mitomycin C (MMC). Red arrows indicate chromosomal abnormalities (50 ng/mL MMC, 500 nM Aza, day 6, n = 3). (G) Colony formation of MDA-MB-231-CRISPR-FANCD2 knockdown vs. MDA-MB-231-scramble control treated with increasing doses of Tal (0 nM to 100 nM, n = 3). (H) In vivo xenograft treatment measuring tumor volume (mm3) of bulk population CRISPR-Cas9 knockdown of FANCD2 in MDA-MB-231 treated with vehicle or Tal (0.3 mg/kg Tal, n = 8 per group). (I) Relative HR activity analysis of GFP+ cells by flow cytometry after transient transfection of I-SceI + empty vector (EV), I-SceI + FANCD2 overexpressing plasmid (D2), or I-SceI + K561R-FANCD2 overexpressing plasmid (D2mut) in MDA-MB-231:DR-GFP after treatment for 6 d (500 nM Aza, n = 3). All data are presented as mean ± SEM with statistical significance derived from two-tailed unpaired Student’s t test (or ANOVA). *Adjusted P value <0.05 after false discovery rate (FDR = 0.05) based multiple comparisons correction, two-stage linear step-up procedure of Benjamini, Kriegerm, and Yekutieli.
Fig. 2.
Fig. 2.
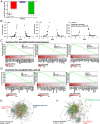
DNMTi and PARPi induce global perturbation of transcriptome providing a link between DNA repair and innate immune signaling pathways. (A) FANCD2 expression change in RNA-seq dataset for MDA-MB-231 day 10, y axis: Log2 fold change relative to mock, significance obtained by DESeq2 pairwise comparison: *P < 0.05 vs. mock, ^P < 0.05 vs. Tal, #P < 0.05 vs. Aza (500 nM Aza, 10 nM Tal, Combo: 500 nM Aza + 10 nM Tal; mock n = 4, Aza n = 4, Tal n = 4, Combo n = 3). (B) HALLMARK gene set normalized enrichment score (NES) volcano plot for MDA-MB-231 day 10 total transcriptome RNA-seq data DESeq2 analysis: (Left) 500 nM Aza, (Center) 10 nM Tal, (Right) Combo: 500 nM Aza + 10 nM Tal; x axis: NES, y axis: nominal P value. Each dot is a single HALLMARK pathway (50 total), red dots: TNFα/NF-κB gene set, blue dot: IFNαβ gene set, black dot: other pathway. (C) NES plots for MDA-MB-231 day 10 total transcriptome RNA-seq data HALLMARK IFNα response. For each plot: y axis: enrichment score (degree of overrepresentation of detected genes in ranked dataset), x axis: ranked gene list. Below each plot: heatmap based on Log2 fold change (color gradation white to red, low to high) detected for top 25 genes of leading-edge subset for each. NES plots are ordered as follows: (Left) 500 nM Aza, (Center) 10 nM Tal, (Right) Combo: 500 nM Aza + 10 nM Tal. (D) NES plots for MDA-MB-231 day 10 total transcriptome RNA-seq data HALLMARK TNFα via NF-κB. For each plot: y axis: enrichment score, x axis: ranked gene list. Below each plot: heatmap based on Log2 fold change (color gradation white to red, low to high) detected for top 25 genes of leading-edge subset for each. NES plots are ordered as follows: (Left) 500 nM Aza, (Center) 10 nM Tal, (Right) Combo: 500 nM Aza + 10 nM Tal. (E) STRING protein–protein interaction map of Fanconi anemia pathway vs. TNFα/NF-κB pathway-related genes. Gene sets depicted derived from MSigDB (Broad Institute). See SI Appendix, Fig. S2K for an expanded version. (F) STRING protein–protein interaction map of Fanconi anemia pathway vs. IFNαβ pathway-related genes. Gene sets depicted derived from MSigDB (Broad Institute). See SI Appendix, Fig. S2L for an expanded version.
Fig. 3.
Fig. 3.
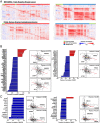
Basal, inverse correlation exists between pathogen response pathways and FA- related gene sets. (A, Top) Pearson correlation-based heatmaps for METABRIC TNBC samples (mRNA expression [microarray] Z scores). Clustering by one minus Pearson correlation, negative correlation, blue; positive correlation, red. (Left) Fanconi anemia pathway-related genes (green bar) vs. TNFα/NF-κB pathway-related genes (red bar). (Right) Fanconi anemia pathway-related genes (green bar) vs. IFNαβ pathway-related genes (blue bar). (A, Bottom) Pearson correlation-based heatmaps for TCGA serous ovarian cystadenocarcinoma (mRNA expression Z scores, RSEM [batch normalized]). Clustering by one minus Pearson correlation, negative correlation, blue; positive correlation, red. (Left) Fanconi anemia pathway-related genes (green bar) vs. TNFα/NF-κB pathway-related genes (red bar). (Right) Fanconi anemia pathway-related genes (green bar) vs. IFNαβ pathway-related genes (blue bar). (B) Bar plots of Pearson correlation coefficients for METABRIC TNBC samples (mRNA expression [microarray] Z scores). Genes selected based on absolute value greater than 0.20 and significant P value after multiple comparisons correction (FDR set at 0.01 to define P value threshold for discovery). Blue bar = negative correlation, red bar = positive correlation with FANCD2 (Left) or FANCC (Right). Representative scatterplots (x and y axes are the Z scores for genes contained, where each dot is representative of a single patient in dataset) are depicted immediately right of each bar plot. (C) Bar plots of Pearson correlation coefficients for TCGA serous ovarian cystadenocarcinoma (mRNA expression Z scores, RSEM [batch normalized]). Genes selected based on absolute value greater than 0.20 and significant P value after multiple comparisons correction (FDR set at 0.01 to define P value threshold for discovery). Blue bar = negative correlation, red bar = positive correlation with FANCD2 (Left) or FANCE (Right). Representative scatterplots (x and y axes are the Z scores for genes contained, where each dot is representative of a single patient in dataset) are depicted immediately right of each bar plot.
Fig. 4.
Fig. 4.
Acute TNFα and IFNβ cytokine treatment down-regulates BRCAness genes and induces HRD. (A and B) Relative RNA expression for a subset of TNFα inflammatory and FA/HR genes after stimulation with 8 to 12 h and 5 to 100 ng/mL TNFα in MDA-MB-231 (A) and A2780 (B). (qRT-PCR, n = 3). (C and D) Relative HR activity analysis of GFP+ cells by flow cytometry 72 h after transient transfection of I-SceI for 6 h, followed by 5 to 100 ng/mL TNFα treatment in MDA-MB-231:DR-GFP (C) and A2780:DR-GFP (D) cell lines (n = 3). (E and F) Relative RNA expression for a subset of IFNβ pathway and FA/HR genes after stimulation with 8 to 12 h and 100 ng/mL IFNβ in MDA-MB-231 (E) and A2780 (F). (qRT-PCR, n = 3). (G and H) Relative HR activity analysis of GFP+ cells by flow cytometry 72 h after 6 h transient transfection of I-SceI followed by 5 µM ruxolitinib, 100 ng/mL IFNβ, or 5 µM ruxolitinib + 100 ng/mL IFNβ, or after 6 h transient transfection of I-Sce1 + 0.5 to 1 mg/mL Poly(I:C) or I-Sce1 + 0.5 to 1 mg/mL Poly(dI:dC) in MDA-MB-231:DR-GFP (G) and A2780:DR-GFP (H) cell lines (n = 3). All data are presented as mean ± SEM with statistical significance derived from two-tailed unpaired Student’s t test (or ANOVA). *Adjusted P value <0.05 after (FDR = 0.05) based multiple comparisons correction, two-stage linear step-up procedure of Benjamini, Kriegerm, and Yekutieli.
Fig. 5.
Fig. 5.
DNMTi and PARPi induces chronic inflammatory and IFNαβ-related signaling. (A and B) Log2-based heatmaps depicting relative RNA expression over time for a subset of TNFα inflammatory pathway genes in MDA-MB-231 (A) treated with vehicle, 500 nM Aza, 10 nM Tal, or Combo: 500 nM Aza + 10 nM Tal, and A2780 (B) treated with vehicle, 150 nM Aza, 2.5 nM Tal, or Combo: 150 nM Aza + 2.5 nM Tal. (qRT-PCR, day 3, day 6, and day 10, n = 3). (C and D) Log2-based heatmaps depicting relative RNA expression over time for a subset of IFNβ pathway genes in MDA-MB-231 (C) treated with vehicle, 500 nM Aza, 10 nM Tal, or Combo: 500 nM Aza + 10 nM Tal, and A2780 (D) treated with vehicle, 150 nM Aza, 2.5 nM Tal, or Combo: 150 nM Aza + 2.5 nM Tal (qRT-PCR, day 3, day 6, and day 10, n = 3). (E) TransAM NF-κB activation (p50/p65) colorimetric ELISA for MDA-MB-231 day 4 (D4) and day 5 (D5) nuclear extracts (10 μg per condition) treated as follows: 500 nM Aza, 10nM Tal, or Combo: 500 nM Aza + 10 nM Tal . x axis, treatment and time point; y axis, fold change over mock optical density (OD) 450 nm. (n = 2). (F) TransAM NF-κB activation (p50/p65) colorimetric ELISA for A2780 D4 and D5 nuclear extracts (10 μg per condition) treated as follows: 150 nM Aza, 2.5 nM Tal, or Combo: 150 nM Aza + 2.5 nM Tal. x axis, treatment and time point; y axis, fold change over mock OD 450 nm. (n = 2) All data are presented as mean ± SEM with statistical significance derived from two-tailed unpaired Student’s t test or ANOVA * vs. mock, ^ vs. Tal, # vs. Aza for adjusted P value <0.05 after (FDR = 0.05) based on multiple comparisons correction, two-stage linear step-up procedure of Benjamini, Kriegerm, and Yekutieli.
Fig. 6.
Fig. 6.
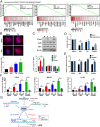
STING pathway augmentation by DNMTi and PARPi facilitates HRD through transcriptional repression of FANCD2. (A) KEGG cytosolic DNA-sensing pathway NES plots for MDA-MB-231 day 10 total transcriptome RNA-seq data. For each plot: y axis, enrichment score; x axis, compiled ranked genes. Below each plot: heatmap based on Log2 fold change (color gradation white to red) detected for leading edge gene subset in each panel. NES plots are ordered: (Left) 500 nM Aza, (Middle) 10 nM Tal, (Right) Combo: 500 nM Aza + 10 nM Tal. (B) Representative immunofluorescence images for dsDNA (Top) and quantified (Bottom) in MDA-MB-231 after vehicle, 500 nM Aza, 10 nM Tal, or Combo: 500 nM Aza + 10 nM Tal treatment (day 6, n = 3). (C) Immunoblot for STING, cGAS, and TBK1 in MDA-MB-231 treated with vehicle (M), 500 nM Aza (A), 10 nM Tal (T), or Combo: 500 nM Aza + 10 nM Tal (Co) with β-actin used as a loading control (Top) and quantified (Bottom) (day 6, n = 3). (D) Relative HR activity analysis of GFP+ cells by flow cytometry after 6-h transient transfection of I-SceI in 231:DR-GFP after 6-d treatment with vehicle, 500 nM Aza, 10 nM Tal, or Combo: 500 nM Aza + 10 nM Tal, ±10 µM STINGi for all conditions (n = 3). (E) Relative FANCD2 expression after transient knockdown using siSTING for 24 h followed by 6 d treatment of vehicle, 500 nM Aza, 10 nM Tal, or Combo: 500 nM Aza + 10 nM Tal (qRT-PCR, day 6, n = 3). (F) Relative CCL5 (Left), ISG15 (Middle), and IL-7R (Right) expression after transient knockdown using nontarget controls (NT) or siSTING (si) for 24 h followed by treatment of vehicle, 500 nM Aza, 10 nM Tal, or Combo: 500 nM Aza + 10 nM Tal (qRT-PCR, day 6, n = 3). (G) Schematic of a multifaceted inflammatory response, which leads to HRD in TNBC and OC. In the proposed model for the combination therapy, the DNMTi induction of viral mimicry via cytosolic dsRNA combined with the PARPi increase of cytosolic dsDNA, converge to the activation of a DNMTi reconstituted STING signaling pathway. This activated response leads to a transcriptional increase in IFNαβ and TNFα/NF-κB signaling, which facilitates the transcriptional repression of FA/HR DNA repair-associated genes in a STING-dependent manner. The overall drug-induced pathogen mimicry response creates a BRCAness phenotype and thus enhances sensitivity to PARPi in the BRCA-proficient setting. All data are presented as mean ± SEM with statistical significance derived from two-tailed unpaired Student’s t test (or ANOVA). * vs. mock and # as indicated for adjusted P value <0.05 after (FDR = 0.05) based on multiple comparisons correction, two-stage linear step-up procedure of Benjamini, Kriegerm, and Yekutieli.

References

    1. De Vos M., Schreiber V., Dantzer F., The diverse roles and clinical relevance of PARPs in DNA damage repair: Current state of the art. Biochem. Pharmacol. 84, 137–146 (2012). - PubMed
    1. Audebert M., Salles B., Calsou P., Involvement of poly(ADP-ribose) polymerase-1 and XRCC1/DNA ligase III in an alternative route for DNA double-strand breaks rejoining. J. Biol. Chem. 279, 55117–55126 (2004). - PubMed
    1. Gibson B. A., Kraus W. L., New insights into the molecular and cellular functions of poly(ADP-ribose) and PARPs. Nat. Rev. Mol. Cell Biol. 13, 411–424 (2012). - PubMed
    1. Mariano G. et al. ., PARP inhibitor ABT-888 affects response of MDA-MB-231 cells to doxorubicin treatment, targeting Snail expression. Oncotarget 6, 15008–15021 (2015). - PMC - PubMed
    1. Chevanne M. et al. ., Inhibition of PARP activity by PJ-34 leads to growth impairment and cell death associated with aberrant mitotic pattern and nucleolar actin accumulation in M14 melanoma cell line. J. Cell. Physiol. 222, 401–410 (2010). - PubMed

Publication types

MeSH terms