. 2020 Jul 28;117(30):17937-17948.
doi: 10.1073/pnas.1920988117. Epub 2020 Jul 10.

Epidemics as an adaptive driving force determining lifespan setpoints

Affiliations

Epidemics as an adaptive driving force determining lifespan setpoints

Peter V Lidsky et al. Proc Natl Acad Sci U S A. .

Abstract

Species-specific limits to lifespan (lifespan setpoint) determine the life expectancy of any given organism. Whether limiting lifespan provides an evolutionary benefit or is the result of an inevitable decline in fitness remains controversial. The identification of mutations extending lifespan suggests that aging is under genetic control, but the evolutionary driving forces limiting lifespan have not been defined. By examining the impact of lifespan on pathogen spread in a population, we propose that epidemics drive lifespan setpoints' evolution. Shorter lifespan limits infection spread and accelerates pathogen clearance when compared to populations with longer-lived individuals. Limiting longevity is particularly beneficial in the context of zoonotic transmissions, where pathogens must undergo adaptation to a new host. Strikingly, in populations exposed to pathogens, shorter-living variants outcompete individuals with longer lifespans. We submit that infection outbreaks can contribute to control the evolution of species' lifespan setpoints.

Keywords: aging; epidemics; evolution; lifespan.


Conflict of interest statement

The authors declare no competing interest.

Figures
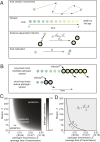
Fig. 1.
Fig. 1.
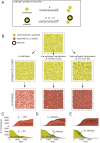
Model I. Length of lifespan controls the establishment and progression of epidemics. (A) Basic rules of the stochastic model I. Individuals are randomly moving across the experimental niche. Death is determined by the age of an individual and the species-specific lifespan setpoint (A). Infection depends on the distance between individuals (d) and on pathogen transmission efficiency (β). Reproduction depends on basal fecundity (B). In this model, neither fecundity nor longevity was affected by infection. Population limit was set arbitrarily to 5,000 individuals (see Methods for details). (B) Restriction of the lifespan results in inefficient spread of chronic low-transmissible pathogen. (C) Systemic analysis of pathogen prevalence dependence on A and β. Short lifespan inhibits low-transmissible pathogens (“no pathogen replication”) and reduces pathogens with moderate transmission. Here and below, the average time of transmission (in parentheses) was estimated experimentally as an average time required for a single infected host to infect a single susceptible host in uninfected population. It is expressed in the same units as lifespan (A). See Movie S1. (D) A simplistic analytic model of dependence of R0 on A and β. β stands for β corrected for the empirically estimated parameter for distance-dependent infection (Methods). For sample simulations, see Movie S1.
Fig. 2.
Fig. 2.
Model II. Zoonotic transmission, pathogen adaptation, and lifespan setpoints. (A) Schematic representation of pathogen adaptation in the context of zoonotic transmission. The model assumes that naive low-transmissible (βn) pathogens required 10 passages to reach its adapted state and increase transmission (βa). (B and C) Stochastic model showing a dependence of pathogen adaptation on A and β. If adaptation of the pathogen is required, the parametric space, where the shorter lifespan prevents increases in epidemics (Movie S2). The dotted line limits the domain of the adapted pathogen feasibility as in Fig. 1 C and D. (B) Pathogen shows high prevalence in all cases if it can adapt within the time of simulation (5,000 time units). (C) Time required for pathogen adaptation. (D) A simplistic deterministic model supports the conclusions of the stochastic model, showing an extended domain, where the short lifespan prevents the adaptation. The numeric differences between stochastic and deterministic models come from the differences in simulation of the infection and the stochastic nature of the adaptation process (see Methods for details).
Fig. 3.
Fig. 3.
Model III. Short lifespan facilitates pathogens clearance during critical declines in the host’s density or population bottlenecks. (A) Pathogen clearance after host migration to a new environment. Infected individuals of short lifespan died before the population reached a density sufficient for epidemics expansion. As a consequence, pathogens suffer severe bottlenecking and, therefore, are cleared from the population in the new niche. (B) Stochastic simulation reveals a region where the pathogen is cleared during the bottleneck. Bottleneck size was 25, maximum population number was 5,000, B = 0.05, and the number of replicates per data point was 10. The dotted line limits the domain of the pathogen feasibility as in SI Appendix, Fig. S1 C and D. See also Movie S3 for sample simulations. (C and D) Two examples of a deterministic simulation (Methods). B = 0.02, β = 0.04, bottleneck size was 25, and maximum population number 5,000. (C) A = 135, pathogen passes the bottleneck. (D) A = 90, pathogen does not pass the bottleneck (the number of infected animals goes below 1). (E) Deterministic model prediction of the clearance efficiency at different on A, B, and β. Clearance efficiency decreases with increase in B. Numeric differences between stochastic and deterministic models are due to differences in simulations of infection. See Methods for details.
Fig. 4.
Fig. 4.
Invasion of the long-lived mutant in uniformly mixed populations. (A) To account for disease-associated fitness cost we introduced a pathogen penalty P = 0.9 into model I (Fig. 1A). Thus, reproduction in infected animals is reduced 10-fold. (BE) In uniformly mixed populations of short-lived individuals (ASL = 90), long-lived mutants (ALL = 180) were winning in competitions if pathogens were absent (C) or have had low (β = 0.005; D) or high transmission rates (β = 0.01; E). See Methods and Movie S4 for sample simulations.
Fig. 5.
Fig. 5.
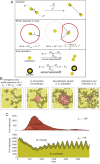
Model IV. Infection in viscous populations favors selection of short-lived hosts. (A) Modifications made to the model I to simulate viscosity. The maximum speed of individuals was limited, and the repulsion between individuals was introduced. Individual areas were calculated and used to find the dependence of fitness on local density (see Movie S5 for illustration of viscosity simulation and Movie S6 for epidemics progression in viscous populations). See Methods for details. (B) The principal stages of the selection scenario. After the initial expansion of the long-lived strain, the pathogen is encountered. Epidemics spread rapidly within long-lived individuals, resulting in its depression and extinction. (C) An example of simulation. β = 0.03, ASL = 90, ALL = 180, P = 0.9, B = 0.05, and R = 3 × 10⁵. See Movie S7.
Fig. 6.
Fig. 6.
Sensitivity analysis of the lifespan selection in infected viscous populations. (A) We varied the parameters in simulation model IV (Fig. 5) to find the crucial determinants of the lifespan evolution. The outcome of simulation was considered to be 1 if short-lived individuals were taking over the whole population and 0 if long-lived were prevailing. Each data point was an average of at least 20 simulations. The black lines (B, D, and F) are the simulations performed as in Fig. 5 with only one parameter varied. The combinations of parameters exactly corresponding to the simulation in Fig. 5 are shown with the red crosses. The colored lines correspond to the simulation series with additional parameters changed: different values of β (in D) and coinfection with multiple pathogens (in F). The descriptions of the modifications are shown with the same color as the line itself. In the heatmaps (C, E, G, and I), parameters are analyzed at different values of β, and the outcome is expressed by color (see the scale in C). (B) The effect of pathogen transmission. Long-lived individuals were prevailing at low (<0.025) and high (>0.07) values of β. (C and D) Birth rate (B) affected lifespan evolution. At low values of B, long-lived individuals can take over in population, but in the region of higher values of B, short-lived individuals can win in presence of pathogens with particular values of β. Interval between replication events is calculated for a sparse population of individuals, without taking into account their overlapping territories. (E and F) The sterilizing effect of the pathogen (P) defines the selection of the lifespan. In case of a single pathogen, the penalty of P < 0.85 is insufficient to promote extinction of long-lived variant (E). However, if several independent pathogens with similar β and P are present in the population (F), much lower sterilization effects per pathogen are sufficient to favor the evolution of limited lifespan. #pt are the numbers of pathogens coinfecting the population. (G) Repulsion between individuals (R) is here a parameter of population viscosity. It is a key parameter determining lifespan setpoint evolution. Low viscosity is associated with the evolution of longer lifespan. (H and I) Larger difference in the lifespan between SL and LL is associated with the increased success of the long-lived variant invasion. The lifespan of SL (ASL) and LL (ALL) are analyzed in H and I correspondingly. (J) The presence of equilibrium lifespan in our model. ALL was set to 180 t.u. as in H (black line) or to ASL + 10 t.u. (green line). Both approaches display similar shapes of curves pointing to an equilibrium lifespan setpoint in the region of 90 t.u. The variants of such lifespan are able to invade the populations of individuals with shorter lifespan (e.g., A = 80), and at the same time are capable of resisting invasions of more long-lived variants (e.g., A = 100). See also SI Appendix, Fig. S2 for more detailed sensitivity analysis.
Fig. 7.
Fig. 7.
Mechanism of selection favoring fixation of pleiotropic genes. (A) Two variants of SL with identical ASL = 90 are presented. Normal SL (dark yellow) is not capable of producing LL mutants (ALL = 180). With the short-lived individuals, the brown-color variant can generate long-lived ALL variant (short-lived paternal strain [SLps]). (B) We considered a region of SLps individuals surrounded by SL individuals. The LL mutant was introduced in the middle of this region. During initial invasion of LL variant, the SLps strain is efficiently displaced (see Movie S9 for a sample simulation). (C) Graphs represent the population dynamics of different variants in B (n = 50). (D) Replication success of SL individuals in simulations with LL invasion depends strongly on the distance from the initial LL locus. Individuals were labeled with respect to this distance, and these labels were consequently inherited by their progeny. By the end of simulation, the numbers of individuals were plotted against the initial positions of their ancestors. In uninfected populations in the absence of LL (light green line), underrepresented individuals are lost due to genetic drift, and this effect is slightly enhanced in the presence of the pathogen (dark green line). Introduction of LL (red line) in presence of pathogen results in a dramatic extinction of SL lineages in the proximity of the locus of introduction. Thus, not only the long lifespan per se but even the ability to produce long-lived mutant might be detrimental in viscous populations in the presence of pathogens. (E) A hypothetical mechanism for prevention of LL mutant emergence. Mutations in two genes X and Y are required to extend lifespan. Single mutants might express extended longevity but are compromised in fitness and do not accumulate in population, ensuring genetic stability of the aging program. Thus, genes X and Y behave as pleiotropic genes.

Similar articles

Cited by

References

    1. Anderson R. M., May R. M., The population dynamics of microparasites and their invertebrate hosts. Philos. Trans. R. Soc. Lond. B Biol. Sci. 291, 451–524 (1981). - PMC - PubMed
    1. Gladyshev V. N., Aging: Progressive decline in fitness due to the rising deleteriome adjusted by genetic, environmental, and stochastic processes. Aging Cell 15, 594–602 (2016). - PMC - PubMed
    1. Medawar P. B., An Unsolved Problem of Biology (H. K. Lewis, London, 1952).
    1. Kirkwood T. B., Holliday R., The evolution of ageing and longevity. Proc. R. Soc. Lond. B Biol. Sci. 205, 531–546 (1979). - PubMed
    1. Williams G. C., Pleiotropy, natural selection, and the evolution of senescence. Evolution 11, 398–411 (1957).

Publication types