. 2020 Jul 28;117(30):17913-17923.
doi: 10.1073/pnas.1909710117. Epub 2020 Jul 10.

Chemosensory mechanisms of host seeking and infectivity in skin-penetrating nematodes

Affiliations

Chemosensory mechanisms of host seeking and infectivity in skin-penetrating nematodes

Spencer S Gang et al. Proc Natl Acad Sci U S A. .

Abstract

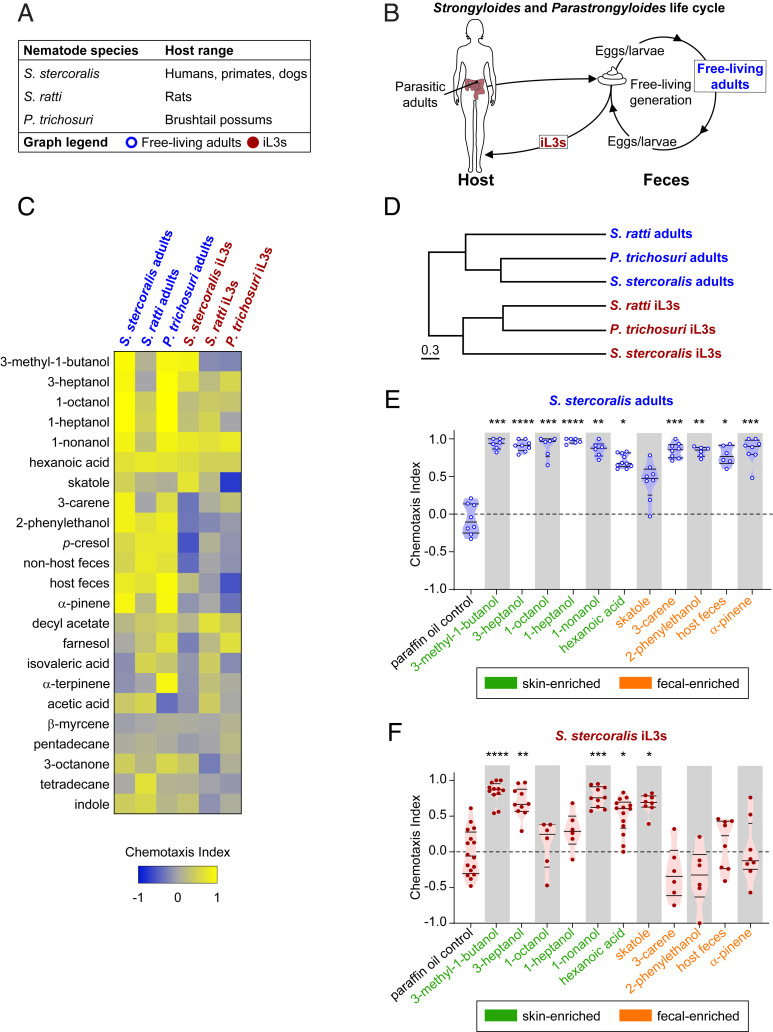
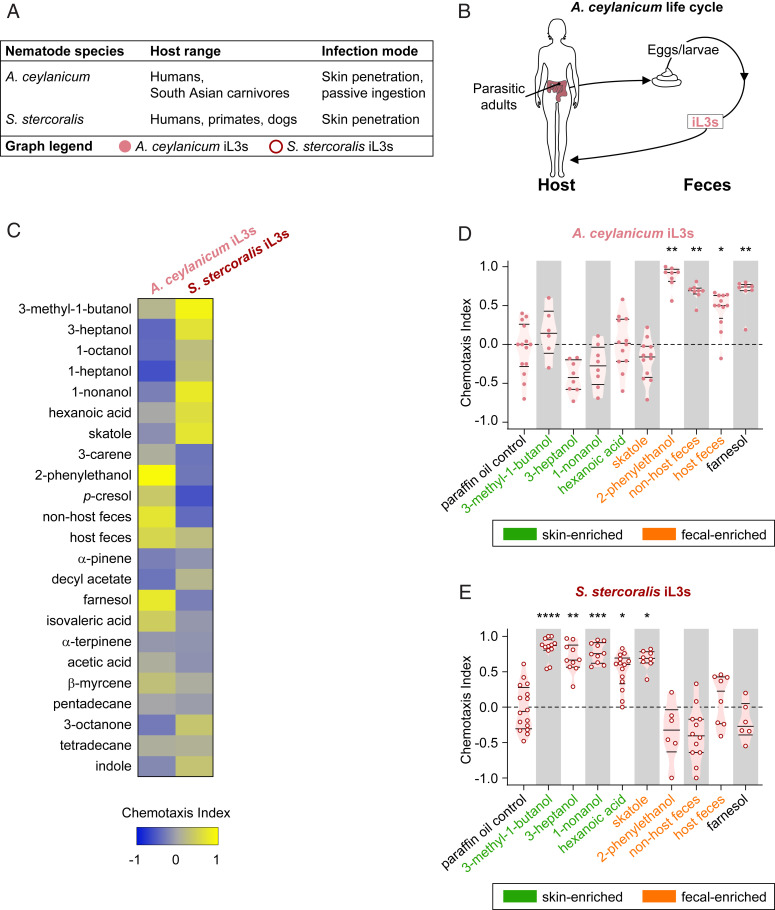
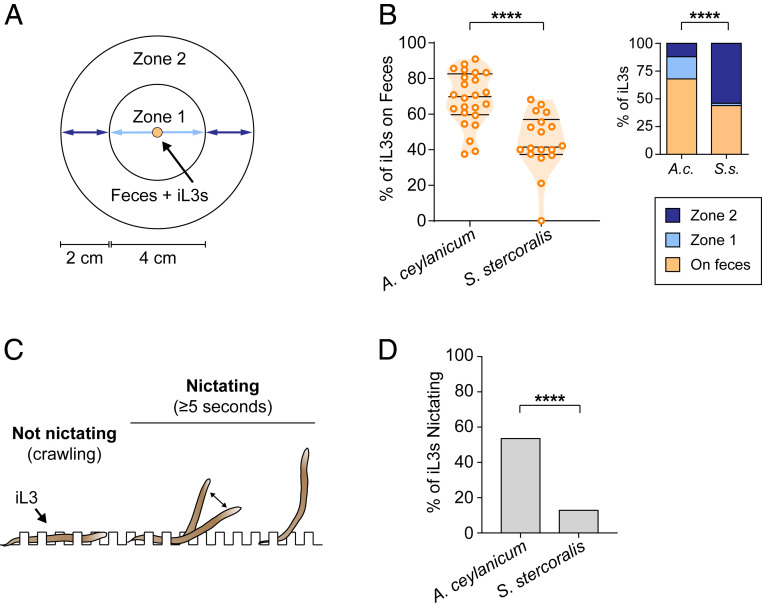
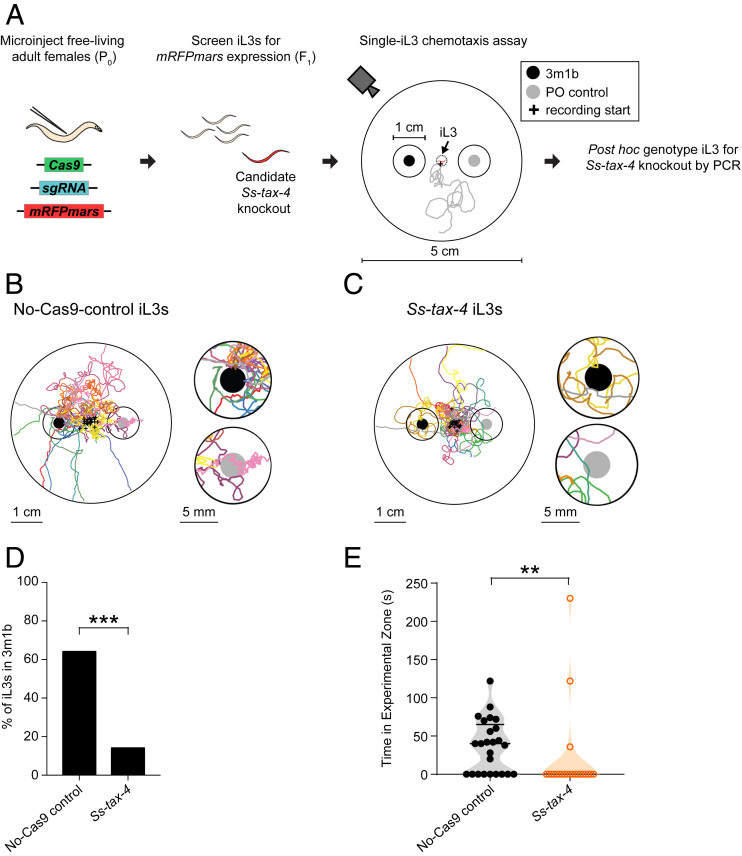
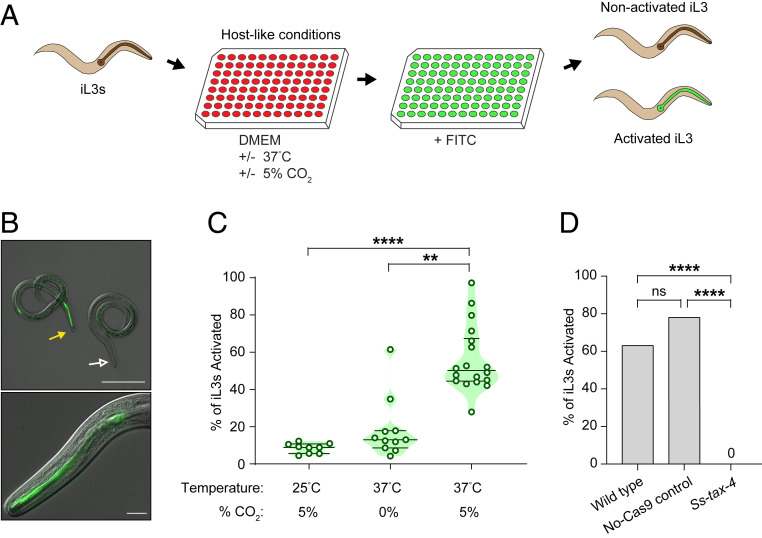
Approximately 800 million people worldwide are infected with one or more species of skin-penetrating nematodes. These parasites persist in the environment as developmentally arrested third-stage infective larvae (iL3s) that navigate toward host-emitted cues, contact host skin, and penetrate the skin. iL3s then reinitiate development inside the host in response to sensory cues, a process called activation. Here, we investigate how chemosensation drives host seeking and activation in skin-penetrating nematodes. We show that the olfactory preferences of iL3s are categorically different from those of free-living adults, which may restrict host seeking to iL3s. The human-parasitic threadworm Strongyloides stercoralis and hookworm Ancylostoma ceylanicum have highly dissimilar olfactory preferences, suggesting that these two species may use distinct strategies to target humans. CRISPR/Cas9-mediated mutagenesis of the S. stercoralis tax-4 gene abolishes iL3 attraction to a host-emitted odorant and prevents activation. Our results suggest an important role for chemosensation in iL3 host seeking and infectivity and provide insight into the molecular mechanisms that underlie these processes.

Keywords: Strongyloides stercoralis; chemosensation; host seeking; parasitic helminth; parasitic nematode.


Conflict of interest statement

The authors declare no competing interest.

Figures

Fig. 1.
Fig. 1.
Skin-penetrating nematodes display life-stage-specific olfactory preferences. (A) Summary of nematodes, their natural host ranges, and life stages tested. In AF, the life stages tested are color coded: blue: free-living adults and red: iL3s. (B) The life cycle and ecology of Strongyloides and Parastrongyloides. Parasitic adults live in the host’s intestinal tract and excrete eggs or young larvae in host feces. The larvae develop on host feces into free-living adult males and females. Progeny from free-living adults become iL3s that must infect a host to continue the life cycle. S. stercoralis and S. ratti can only undergo one free-living generation in the environment; all progeny from free-living adults become iL3s. P. trichosuri can cycle through multiple free-living generations in the environment while intermittently producing iL3s. (C) Responses of skin-penetrating nematodes to mammalian skin, sweat, and fecal odorants, as well as to host and nonhost fecal odors, across life stages. Sources of host and nonhost feces, respectively, for each species: S. stercoralis: dogs and rats; S. ratti: rats and dogs; P. trichosuri: brushtail possums and rats. Response magnitudes in the heatmap are color coded according to the scale shown below the heatmap. Odorants are ordered based on hierarchical cluster analysis. n = 6–20 trials for each odorant, species, and life stage combination. Each species and life stage responded differently to the odorant panel (****P < 0.0001, two-way ANOVA with Tukey’s posttest). A subset of the data for S. ratti and S. stercoralis is from Castelletto et al. (37). (D) Olfactory preferences of skin-penetrating nematodes reflect life stage rather than phylogeny. The behavioral dendrogram was constructed based on the odorant response profiles in C. Hierarchical clustering was performed using the unweighted pair group method with arithmetic mean. Euclidean distance was used as a similarity measure (cophenetic correlation coefficient = 0.88). (E and F) Responses of S. stercoralis free-living adults (E) and iL3s (F) to selected odorants and feces. *P < 0.05, **P < 0.01, ***P < 0.001, and ****P < 0.0001. n = 6–16 trials for each odorant. Significance was calculated relative to the paraffin oil (PO) control using the full panel shown in C, Kruskal–Wallis test with Dunn’s posttest. All odorant responses from the odorant panel that were significantly different from the PO control for either S. stercoralis adults or S. stercoralis iL3s are shown. Each dot represents an individual chemotaxis assay. Lines indicate medians and interquartile ranges. Odorants primarily considered human skin and sweat odorants are shaded green; odorants primarily considered human fecal odorants are shaded orange (SI Appendix, Table S1).
Fig. 2.
Fig. 2.
The human-infective species A. ceylanicum and S. stercoralis have distinct olfactory preferences. (A) Summary of natural host ranges, infection modes, and life stages tested for the hookworm A. ceylanicum and the threadworm S. stercoralis. In AE, the species are color coded: pink: A. ceylanicum iL3s and red: S. stercoralis iL3s. (B) The life cycle and ecology of A. ceylanicum. Parasitic adults excrete eggs in host feces. A. ceylanicum larvae can only develop into iL3s that must infect a new host each generation. (C) Responses of A. ceylanicum iL3s and S. stercoralis iL3s to mammalian skin, sweat, and fecal odorants, as well as to host and nonhost fecal odors. Sources of host and nonhost feces, respectively, for each species: A. ceylanicum: hamsters and gerbils; S. stercoralis: dogs and rats. Response magnitudes are color coded according to the scale shown below the heatmap. Odorants are shown in the same order as in Fig. 1. n = 6–16 trials for each odorant and species combination. A. ceylanicum and S. stercoralis responded differently to the odorant panel (****P < 0.0001, two-way ANOVA with Tukey’s posttest). (D and E) Responses of A. ceylanicum iL3s (D) and S. stercoralis iL3s (E) to selected odorants and fecal odor. *P < 0.05, **P < 0.01, ***P < 0.001, and ****P < 0.0001. n = 6–16 trials for each odorant for both A. ceylanicum and S. stercoralis iL3s. Significance was calculated relative to the PO control using the full panel shown in C, Kruskal–Wallis test with Dunn’s posttest. All odorant responses from the odorant panel that were significantly different from the PO control for either A. ceylanicum iL3s or S. stercoralis iL3s are shown. Each dot represents an individual chemotaxis assay. Lines indicate medians and interquartile ranges. Odorants primarily considered human skin and sweat odorants are shaded green; odorants primarily considered human fecal odorants are shaded orange (SI Appendix, Table S1). Data for S. stercoralis iL3s are reproduced from Fig. 1.
Fig. 3.
Fig. 3.
A. ceylanicum and S. stercoralis have distinct dispersal behaviors. (A) Diagram of the fecal dispersal assay for iL3s. iL3s were placed on fresh host feces (hamster feces for A. ceylanicum and gerbil feces for S. stercoralis) and were allowed to migrate for 1 h. The number of iL3s on feces, in zone 1, or in zone 2 was then quantified. The diagram was modified from Ruiz et al. (51). (B, Left) Percentage of iL3s remaining on feces at the end of the 1-h fecal dispersal assay for A. ceylanicum and S. stercoralis. S. stercoralis iL3s disperse off feces to a greater extent than A. ceylanicum iL3s. ****P < 0.0001, Mann–Whitney test. n = 18 trials for S. stercoralis and 24 trials for A. ceylanicum. Each dot represents an individual fecal dispersal assay. Lines indicate medians and interquartile ranges. (Right) Percentage of iL3s in each zone at the end of the 1-h fecal dispersal assay. The overall distribution of iL3s differed between species. ****P < 0.0001, χ2 test. Moreover, the distribution of iL3s on feces, in zone 1, and in zone 2 all significantly differed between A. ceylanicum and S. stercoralis iL3s (P < 0.001, Fisher’s exact test with Bonferroni correction). n = 367 iL3s for S. stercoralis and 605 iL3s for A. ceylanicum. (C) Diagram of the nictation assay for iL3s. iL3s were placed on near-microscopic agar posts where they could crawl between posts or nictate on the posts. Individual iL3s were monitored for a 2-min period. Any iL3 that raised at least half its body off the plate for ≥5 s was scored as nictating. The diagram was modified from Ruiz et al. (51). Post heights and the iL3 size shown are not to scale. (D) A. ceylanicum iL3s nictated more frequently than S. stercoralis iL3s. ****P < 0.0001, Fisher’s exact test. n = 62 iL3s for S. stercoralis and 71 iL3s for A. ceylanicum.
Fig. 4.
Fig. 4.
Ss-tax-4 is required for the attraction of S. stercoralis iL3s to a host odorant. (A) Strategy for CRISPR/Cas9-mediated targeted mutagenesis of the S. stercoralis tax-4 gene. Plasmid vectors encoding Cas9, the single guide RNA for Ss-tax-4, and a repair template for homology-directed repair encoding an mRFPmars reporter gene were introduced into S. stercoralis free-living adult females by gonadal microinjection. The iL3 progeny from microinjected females were screened for mRFPmars expression, indicative of possible disruption of Ss-tax-4. Individual mRFPmars-expressing iL3s were then live tracked in a chemotaxis assay where the iL3 could crawl freely on an agar surface in an odorant gradient. Black dot: placement area of a 5-μL drop of a 1:10 dilution of the attractive odorant 3m1b in PO; gray dot: placement area of a 5-μL drop of PO; black circles around the dots: the experimental or control zones surrounding the 3m1b or PO, respectively. Gray line: hypothetical reconstruction of the migratory path of an mRFPmars-expressing iL3 in the chemotaxis assay; the plus sign indicates the starting position of the iL3. iL3s were then PCR genotyped post hoc for homozygous disruption of Ss-tax-4 (SI Appendix, Fig. S10) as previously described (34, 40). (B) Tracks of no-Cas9-control iL3s migrating for ∼6 min or until the iL3 left the 5-cm assay arena in an odorant gradient. Each colored line indicates the migration of an independently tested iL3; the plus signs indicate the starting positions of the iL3s. The full assay arena is shown on the Left. An enlarged view of the scoring regions around the odorant and control are shown on the Right. Black dots, gray dots, and black circles are as defined above. (C) Tracks of Ss-tax-4 iL3s migrating for ∼6 min or until the iL3 left the 5-cm assay arena in an odorant gradient, shown as described in B. (D) The percentage of no-Cas9-control and Ss-tax-4 iL3s entering the 3m1b experimental zone; a larger percentage of no-Cas9-control iL3s enter the experimental zone than Ss-tax-4 knockout iL3s. ***P < 0.001, Fisher’s exact test. n = 22–25 iL3s for each assay condition. (E) The time spent by each iL3 in the experimental zone containing 3m1b for either no-Cas9-control iL3s or Ss-tax-4 iL3s. No-Cas9-control iL3s spend more time in the experimental zone than Ss-tax-4 iL3s. **P < 0.01, Mann–Whitney test. n = 22–25 iL3s for each assay condition.
Fig. 5.
Fig. 5.
Ss-tax-4 is required for S. stercoralis iL3 activation. (A) Schematic of an in vitro assay for iL3 activation. Developmentally arrested iL3s are incubated in hostlike conditions in DMEM culture medium at 37 °C with 5% CO2. After 21 h of incubation, fluorescein isothiocyanate (FITC) is added to the medium. Following a 3-h incubation with FITC, the iL3s are washed, anesthetized, plated, and screened for FITC in their pharynx. iL3s with FITC in their pharynx are scored as activated since ingestion of FITC is indicative of the resumption of feeding that occurs during activation. (B, Top) Representative DIC + epifluorescence overlay of an activated iL3 with FITC in the pharynx (closed yellow arrow) and an iL3 that failed to activate following 24 h of incubation (open white arrow). (Scale bar: 100 μm.) (Bottom) Magnified DIC + epifluorescence overlay of an activated iL3 with FITC in the pharynx. (Scale bar: 10 μm.) (C) Heat and CO2 are required for activation of S. stercoralis iL3s. **P < 0.01, ****P < 0.0001, Kruskal–Wallis test with Dunn’s posttest. n = 9–18 trials per condition. Percentage of iL3s activated = number of FITC-positive activated iL3s/total number of iL3s scored. Green dots: % activation for each trial, ∼100 iL3s scored per trial. Lines indicate medians and interquartile ranges. (D) Whereas wild-type and no-Cas9-control iL3s activate in hostlike conditions, CRISPR/Cas9-edited Ss-tax-4 iL3s do not. ****P < 0.0001, χ2 test with Bonferroni correction. n = 49 wild-type iL3s, 36 no-Cas9-control iL3s, and 30 Ss-tax-4 iL3s.

References

    1. Boatin B. A. et al. ., A research agenda for helminth diseases of humans: Towards control and elimination. PLoS Negl. Trop. Dis. 6, e1547 (2012). - PMC - PubMed
    1. Pullan R. L., Smith J. L., Jasrasaria R., Brooker S. J., Global numbers of infection and disease burden of soil transmitted helminth infections in 2010. Parasit. Vectors 7, 37 (2014). - PMC - PubMed
    1. Hotez P. J. et al. ., Helminth infections: The great neglected tropical diseases. J. Clin. Invest. 118, 1311–1321 (2008). - PMC - PubMed
    1. Page W., Judd J. A., Bradbury R. S., The unique life cycle of Strongyloides stercoralis and implications for public health action. Trop. Med. Infect. Dis. 3, 53 (2018). - PMC - PubMed
    1. Traub R. J., Ancylostoma ceylanicum, a re-emerging but neglected parasitic zoonosis. Int. J. Parasitol. 43, 1009–1015 (2013). - PubMed