. 2020 Jul 28;117(30):17656-17666.
doi: 10.1073/pnas.2006991117. Epub 2020 Jul 10.

The impact of COVID-19 on small business outcomes and expectations

Affiliations

The impact of COVID-19 on small business outcomes and expectations

Alexander W Bartik et al. Proc Natl Acad Sci U S A. .

Abstract

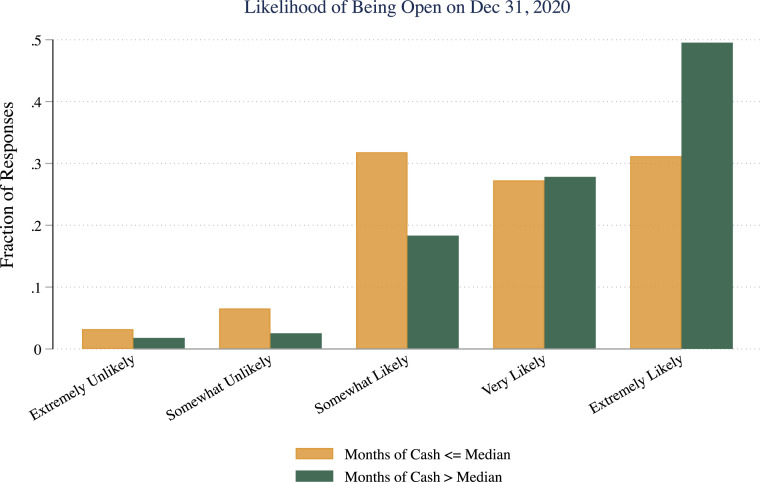
To explore the impact of coronavirus disease 2019 (COVID-19) on small businesses, we conducted a survey of more than 5,800 small businesses between March 28 and April 4, 2020. Several themes emerged. First, mass layoffs and closures had already occurred-just a few weeks into the crisis. Second, the risk of closure was negatively associated with the expected length of the crisis. Moreover, businesses had widely varying beliefs about the likely duration of COVID-related disruptions. Third, many small businesses are financially fragile: The median business with more than $10,000 in monthly expenses had only about 2 wk of cash on hand at the time of the survey. Fourth, the majority of businesses planned to seek funding through the Coronavirus Aid, Relief, and Economic Security (CARES) Act. However, many anticipated problems with accessing the program, such as bureaucratic hassles and difficulties establishing eligibility. Using experimental variation, we also assess take-up rates and business resilience effects for loans relative to grants-based programs.

Keywords: CARES Act; COVID-19; small businesses.


Conflict of interest statement

The authors declare no competing interest.

Figures

Fig. 1.
Fig. 1.
Firm size in the survey and Census. This figure plots the share of firms in each employment category for the 2017 Census of US Businesses and the survey respondents. The sample size for the survey is 4,873 responses, omitting 959 responses with missing employment data.
Fig. 2.
Fig. 2.
Average per capita payroll ($1,000s) in the survey and Census. This figure plots per-employee payroll in thousands of dollars by firm size for the 2017 Census of US Businesses aggregates and the survey respondents. The Census data only report annual payroll for W2 workers and the number of firms in an employment size category. To calculate payroll for the survey firms, we take the midpoint of categorical answers for monthly expenses, multiply by the fraction of expenses going toward payroll, and divide by total employees (we cannot distinguish between W2 employees and contractors).
Fig. 3.
Fig. 3.
Coverage by state. This figure plots shares of survey responses across different states.
Fig. 4.
Fig. 4.
Firm locations in the Census, downstream survey, and upstream presurvey Alignable poll. This figure plots the share of firms in each state for the 2017 Census of US Businesses, the survey respondents, and the respondents who took the upstream Alignable poll. Users who took the survey did so after taking the Alignable poll. They were then redirected to the Harvard Business School Qualtrics web link. Note that the upstream poll did not ask questions about firm size or payroll, so prior figures cannot check compositional differences based on firm size or pay.
Fig. 5.
Fig. 5.
Months of cash. This figure plots firms’ months of cash available as a multiple of January 2020 expenses. We compute this measure by taking the midpoint of categorical responses for the amount of cash on hand and dividing by the midpoint of the categorical response for typical monthly expenses prior to the crisis. The sample size is 4,176.
Fig. 6.
Fig. 6.
Mean and median months of cash split by monthly expenses ($1,000s). This figure plots means and medians of the months of cash available measure across the distribution of typical monthly expenses.
Fig. 7.
Fig. 7.
Cumulative distribution function of expected COVID end date. This figure plots the distribution function across respondents for the expected end date of COVID-related disruptions. The y axis represents the share of respondents who believe that COVID disruptions will end on or before the date given on the x axis.
Fig. 8.
Fig. 8.
Likelihood of remaining open or reopening by December. This figure displays the frequency of answers to a question about the likelihood of being open in December 2020. Responses are plotted based on whether the firm has more than the median number of months of cash on hand given their pre-COVID expenses.
Fig. 9.
Fig. 9.
Likelihood of remaining open or reopening by December 2020 as a function of beliefs about COVID end date. This figure plots the likelihood of being open in December, 2020 as a function of respondents’ expected COVID end date. Averages are plotted, and the shaded region is the CI. The opening likelihood is computed as the share of respondents who answered “Extremely likely” or “Very likely.”
Fig. 10.
Fig. 10.
Differences in policy take-up across loans versus CARES Act PPP split by hypothetical limits on borrowing amount. This figure displays policy take-up rates for loans versus the stylized PPP policy using a between-subjects design. The borrowing base was also randomized between subjects as a multiple of typical monthly expenses prior to the crisis. The text displayed for the PPP program was, “Imagine a policy where the government allows you to borrow up to [borrowing base] times your typical monthly expenses without posting any collateral. You could use this money to cover any of your business expenses. The loan will be forgiven by the amount spent on payroll, lease, rent, mortgage, and utility payments in the 8 weeks after origination (you can consider this amount to be a grant). The remainder of the loan (that is not spent on these items) will have deferred payments for 1 year. After that, the loan would have an annual interest rate of 4% (deferred for 1 year) and you would have up to 10 years to repay the loan. For example, if you borrow $50,000 and you have no qualifying expenses to offset the loan, the required monthly payment starting 1 year from today would be $506 per month for 10 years. If you borrow $50,000 and spend $40,000 to pay your employees during the first 8 weeks, you will have 10 years to pay the remaining $10,000 with monthly payments of $102.” Subjects in the loan condition saw the text, “Imagine the government offers a loan allowing you to borrow up to [borrowing base] times your typical monthly expenses without posting any collateral. You could use this money to cover any of your business expenses. The loan would have an annual interest rate equivalent of 4% and principal and interest payments would be deferred for 1 year. You would have up to 10 years to repay the loan. For example, if you borrow $50,000, the required monthly payment starting 1 year from today would be $506 per month for 10 years.” Pooled means for the loan and CARES Act responses are 0.59 and 0.72, respectively. The sample size is 2,610, and the pooled t-statistic on the difference between policies is 6.97.
Fig. 11.
Fig. 11.
Differences in policy effects on the propensity to remain open in December of 2020, split by hypothetical limits on borrowing amount. This figure plots differences in the propensity to remain open under different policies. The measure is computed using a follow-up question after policy information displayed, using the fraction that chose “Very likely” or “Extremely likely” to be open in December of 2020. See Fig. 10 legend for additional detail about the policy display. Pooled means for the loan and CARES Act are 0.805 and 0.848, respectively. The sample size is 2,550, and the pooled t-statistic on the difference between policies is 2.76.
Fig. 12.
Fig. 12.
Differences in policy effects on relative employment between December and January. This figure plots differences in the ratio of relative employment between December 2020 and January 2020 under different policies. The December 2020 employment measure is computed using a follow-up question after policy information displayed. See Fig. 10 legend for additional detail about the policy display. Pooled means for the loan and CARES act responses are 0.86 and 0.94, respectively. The sample size is 2,341, and the pooled t-statistic on the difference between policies is 2.42.
Fig. 13.
Fig. 13.
Reasons for not using the resources in the CARES Act. This figure contains the frequency of responses for reasons that respondents would not take up aid under the CARES Act policy condition; 383 respondents indicated they would not use the policy, and 382 answered this question. Respondents could select more than one option, so percentages need not sum to 100. Fifty percent of respondents selected an additional reason not displayed or filled in the free text entry for other.

References

    1. Faulkender M. W., Cash holdings among small businesses. 10.2139/ssrn.305179 (2 April 2002). - DOI
    1. La Rocca M., Staglianò R., La Rocca T., Cariola A., Skatova E., Cash holdings and sme performance in Europe: The role of firm-specific and macroeconomic moderators. Small Bus. Econ. 53, 1051–1078 (2019).
    1. Goldfarb A., Xiao M., Who thinks about the competition? Managerial ability and strategic entry in US local telephone markets. Am. Econ. Rev. 101, 3130–3161 (2011).
    1. DellaVigna S., Gentzkow M., Uniform pricing in us retail chains. Q. J. Econ. 134, 2011–2084 (2019).
    1. Strulov-Shlain A. S., More than a Penny’s Worth: Left-Digit Bias and Firm Pricing (University of California, Berkeley, 2018).

MeSH terms

LinkOut - more resources