. 2020 Jul 10;11(1):3460.
doi: 10.1038/s41467-020-17257-7.

Phasic dopamine reinforces distinct striatal stimulus encoding in the olfactory tubercle driving dopaminergic reward prediction

Affiliations

Phasic dopamine reinforces distinct striatal stimulus encoding in the olfactory tubercle driving dopaminergic reward prediction

Lars-Lennart Oettl et al. Nat Commun. .

Abstract

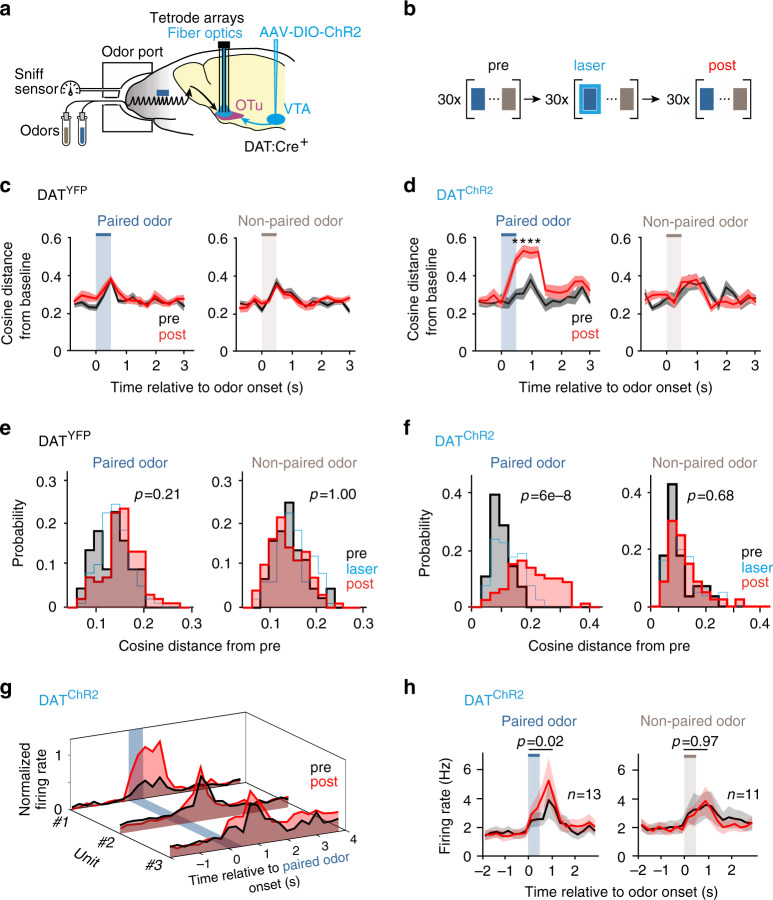
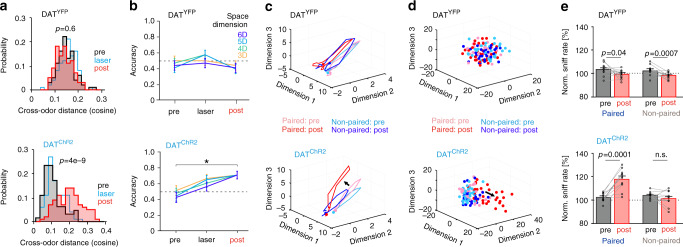
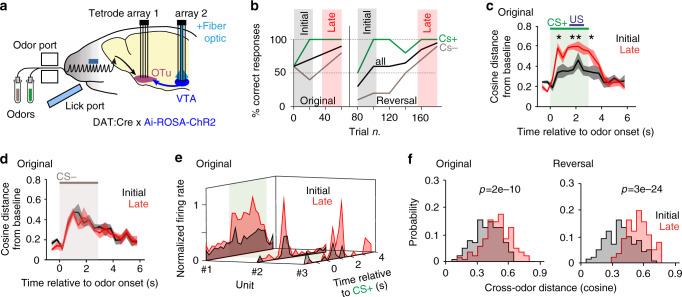
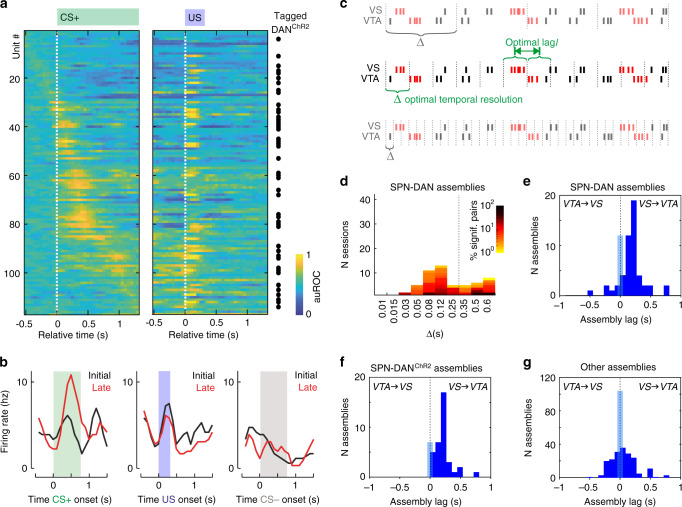
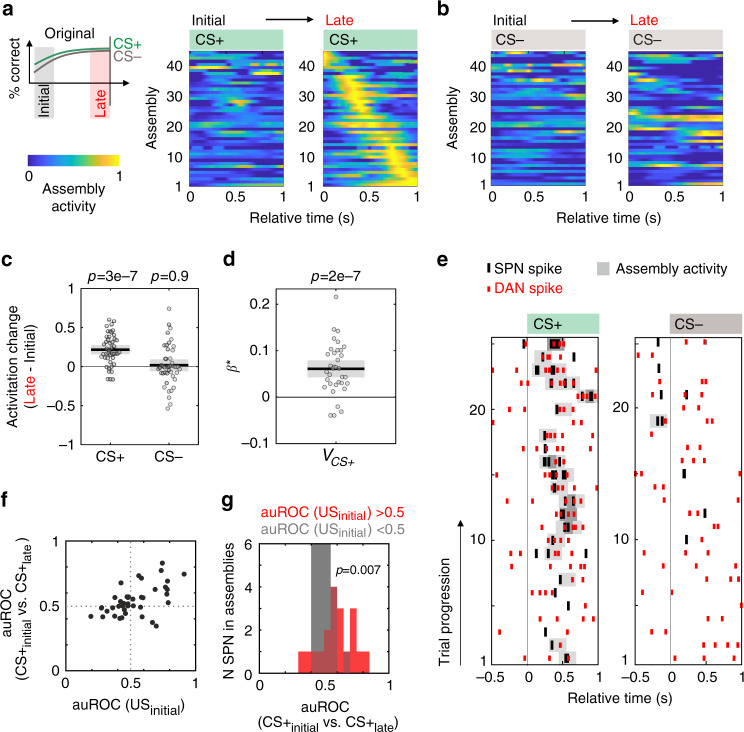
The learning of stimulus-outcome associations allows for predictions about the environment. Ventral striatum and dopaminergic midbrain neurons form a larger network for generating reward prediction signals from sensory cues. Yet, the network plasticity mechanisms to generate predictive signals in these distributed circuits have not been entirely clarified. Also, direct evidence of the underlying interregional assembly formation and information transfer is still missing. Here we show that phasic dopamine is sufficient to reinforce the distinctness of stimulus representations in the ventral striatum even in the absence of reward. Upon such reinforcement, striatal stimulus encoding gives rise to interregional assemblies that drive dopaminergic neurons during stimulus-outcome learning. These assemblies dynamically encode the predicted reward value of conditioned stimuli. Together, our data reveal that ventral striatal and midbrain reward networks form a reinforcing loop to generate reward prediction coding.


Conflict of interest statement

The authors declare no competing interests.

Figures

Fig. 1
Fig. 1. Phasic DA modifies striatal population encoding selectively of the paired odor.
a Two odors were applied for 0.5 s in pseudorandomized order to head-fixed DATChR2 or DATYFP mice. b During the ‘pairing’ phase, one odor was paired transiently with brief laser trains delivered to the recording site in the OTu to evoke phasic DA (pDA) release. c, d Cosine distance from baseline of the of the population vector for the two odors during the ‘pre’ and ‘post’ phases (displayed mean ± S.E.). Phasic DA pairing enhanced exclusively the paired odor response of (d) DATChR2, but not (c) DATYFP mice (two-sided t-test, asterisks mark significance at α = 0.05 with Benjamini–Hochberg correction). DATYFP: n = 10 trial-averages of three trials, respectively, for both ‘pre’ and ‘post’; DATChR2: n = 8/10 trial-averages of three trials, respectively, for ‘pre’/‘post’. e, f Distribution of cosine distances between response vectors within the ‘pre’ phase (black) and between the ‘pre’ and ‘post’ phase (red). Only the response to the paired odor of (f) DATChR2 mice changed after pDA pairing (three-way ANOVA; factors: cohort, phase, odor; interaction effect: F(1,498) = 8.0, p = 0.005; post hoc tests indicated, Tukey’s correction). g Example of the normalized peri-stimulus histograms (PSTH) for excitatory odor responses of 3 SPN in DATChR2 mice for ‘pre’ and ‘post’ phases. h Mean PSTH ± S.E. of SPN with excitatory responses to the paired (left) and non-paired (right) odor in DATChR2 mice (two-sided paired Wilcoxon signed-rank test of the averaged time bin from 0 to 1 s) (see also Supplementary Fig. 3e,f). Source data are provided as a Source data file. See also Supplementary Figs. 1–3.
Fig. 2
Fig. 2. Phasic DA increases the difference between the paired and non-paired odor encoding and improves decoding.
a Distribution of the cosine distance between the two odor responses during ‘pre’ and ‘post’ phases. After pDA pairing, cross-odor distance increased only in DATChR2 mice (two-way ANOVA; factors: cohort, odor; interaction effect: F(1,360) = 90.6, p = 3 × 10−19; post hoc comparisons indicated, Tukey’s correction). b Quadratic discriminant analysis between paired and non-paired odor responses. Only in DATChR2 mice, laser pairing improved the average accuracy (two-sided Fisher’s exact test between ‘pre’ vs ‘post’; multiple state space dimensions are tested to confirm the robustness, α = 0.05 with Benjamini–Hochberg correction on tests performed on all dimensions and cohorts, DATChR2: asterisk mark significance for all dimensions, DATYFP: no significance in any dimension. DATYFP: n = 60 accuracy values for all dimensions and phases; DATChR2: n = 52/62/62 accuracy values for all dimensions and for ‘pre’/’laser’/’post’ phases, resp.; displayed mean ± S.E.). c Averaged trajectories for paired and non-paired SPN odor responses visualized through factor analysis after time embedding (dots mark the beginning of the trial). Trajectories were jointly rotated to improve visualization. d Trial-specific odor responses visualized through multidimensional scaling. pDA pairing separated the paired odor representation from its original representation and from the one of the non-paired odor. e Mean sniff rate ± S.E. following odor onset normalized to baseline. The sniff rate increased only for the odor paired with pDA stimulation in DATChR2 mice (two-sided paired t-test). Source data are provided as a Source data file. See also Supplementary Figs. 4 and 5.
Fig. 3
Fig. 3. Value assignment to sensory stimuli in the ventral striatum during reversal learning.
a To assess how stimulus-triggered neuronal responses are modified during reversal learning, we performed recordings in head-fixed mice of VTA and OTu. ChR2-expression in DAN allowed for optogenetic tagging. b Exemplary performance of a mouse learning the go-/no-go task (original phase). Once criterion was reached, the odor-reward contingency was reversed (reversal phase) within the session. To reveal changes after learning, each phase was divided into an ‘initial’ phase (comprising the first 12 CS+ and 12 CS− trials) and a ‘late’ phase (last 12 CS+ and 12 CS− trials). c, d The cosine distance of the population vector from baseline changed for CS+ (but not CS−) from the initial to the late trials (two-sided t-test, asterisks mark significance at α = 0.05 with Benjamini–Hochberg correction). Displayed mean ± S.E., n = 4 trial-averages of three trials, respectively, for both ‘initial’ and ‘late’. e Examples of normalized PSTH of responses to CS+ in the initial and late trials in 3 SPN. f Distribution of cosine distances between CS+ and CS− representation in initial and late trials, respectively. During learning, CS+ and CS− representations diverged both in the original and reversal phase (two-sided t-test). Source data are provided as a Source data file. See also Supplementary Figs. 6-7.
Fig. 4
Fig. 4. SPN lead DAN activation.
a Response traces of putative DAN computed with a sliding-window auROC (response vs. baseline). The distribution of optogenetically tagged neurons supports the classification of DAN. b, Mean activity for the ‘initial’ 12 vs. ‘late’ 12 trials of the original phase of an exemplary DAN. The plots show an increase in firing at CS+ and decrease at US with learning (moving average smoothing over three adjacent bins). c Scheme illustrating assembly detection of interregional assembly (marked in red) with sequential activation. The lag (l) measures the delay between the activation of the units composing the assembly. The temporal resolution (Δ) captures the temporal precision/duration of unit activity when firing within the assembly. d Distribution of the temporal resolutions of the 359 detected SPN–DAN assemblies. The percentage of significant pairs of all possible pairs for each session is color-coded. SPN–DAN pairs had two characteristic time scales. eg Distribution of inter-unit activation lags of assemblies with Δ < 250 ms. Positive lags indicate that the VTA unit followed the activation of the VS unit (and vice versa). Directionality was observed for (e) the 63 SPN–DAN and (f) 43 SPN–DANChR2 assemblies, in contrast to (g) 296 assemblies composed of other cell types. Source data are provided as a Source data file. See also Supplementary Figs. 8.
Fig. 5
Fig. 5. SPN–DAN assemblies emerge with learning.
a, b Activity of directional SPN–DAN assemblies after CS+ and CS− onset. To capture learning, activity was separately averaged for the 12 initial and 12 late trials (original phase). Same normalization for each assembly across the four panels. c Difference in mean activity between late and initial trials of directional assemblies at CS (original phase, two-sided Wilcoxon test, n = 45, data displayed as mean ± S.E.). Throughout this figure: CS window = 0–0.7 s from CS onset. d Standardized and transformed β* coefficients of the Poisson regression of assembly activity at CS+ on the subjective value VCS+(t) assigned by the animal to CS+ at each trial of the original and reversal phase. VCS+ was estimated from the behavioral data with a Q-PHf reinforcement learning model (see Methods). β* coefficients were greater than zero (two-sided t-test), confirming a positive correlation between SPN–DAN assembly activity and value assignment. Regression performed on all SPN–DAN assemblies. Among the 31 assemblies with positive β*, 26 had lag>0. Only significant β* displayed (n = 35, data displayed as mean ± S.E.). e Peri-stimulus raster plot of a SPN and a DAN forming an assembly correlated with VCS+ (assembly activity shown in gray, darker = stronger activation). Assembly with Δ = 0.12 s and lag l=1Δ (SPN preceding DAN). f For SPN participating in SPN–DAN assemblies, the plasticity at CS+ (auROC(CS+initialvs.CS+late)) was compared with the initial activity of SPN at US (auROC(USinitial)). Each data point marks the mean auROC of spike counts in the original and reversal phase of one SPN. g Distributions of auROC(CS+initialvs.CS+late) for SPN with excitatory (auROC(USinitial)>0.5) or inhibitory (auROC(USinitial)<0.5) response to US. SPN with an excitatory response to US in the initial trials showed a reinforced response to CS+ in the late trials (two-sided Wilcoxon test). Source data are provided as a Source data file. See also Supplementary Figs. 9–11.

References

    1. Schultz W. Dopamine reward prediction-error signalling: a two-component response. Nat. Rev. Neurosci. 2016;17:183–195. - PMC - PubMed
    1. Schultz W. Multiple reward signals in the brain. Nat. Rev. Neurosci. 2000;1:199. - PubMed
    1. Fiorillo CD, Tobler PN, Schultz W. Discrete coding of reward probability and uncertainty by dopamine neurons. Science. 2003;299:1898–1902. - PubMed
    1. Seymour B, et al. Temporal difference models describe higher-order learning in humans. Nature. 2004;429:664–667. - PubMed
    1. Cohen JY, Haesler S, Vong L, Lowell BB, Uchida N. Neuron-type-specific signals for reward and punishment in the ventral tegmental area. Nature. 2012;482:85–88. - PMC - PubMed

Publication types

LinkOut - more resources