. 2020 Jul 10;11(1):3451.
doi: 10.1038/s41467-020-17287-1.

Mnemonic prediction errors bias hippocampal states

Affiliations

Mnemonic prediction errors bias hippocampal states

Oded Bein et al. Nat Commun. .

Erratum in

Abstract

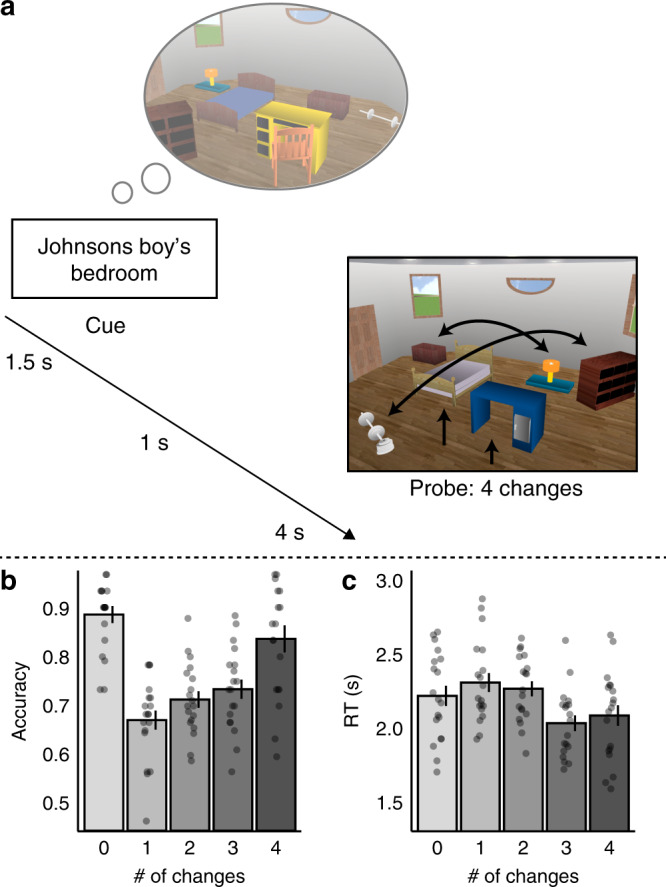
When our experience violates our predictions, it is adaptive to upregulate encoding of novel information, while down-weighting retrieval of erroneous memory predictions to promote an updated representation of the world. We asked whether mnemonic prediction errors promote hippocampal encoding versus retrieval states, as marked by distinct network connectivity between hippocampal subfields. During fMRI scanning, participants were cued to internally retrieve well-learned complex room-images and were then presented with either an identical or a modified image (0-4 changes). In the left hemisphere, we find that CA1-entorhinal connectivity increases, and CA1-CA3 connectivity decreases, with the number of changes. Further, in the left CA1, the similarity between activity patterns during cued-retrieval of the learned room and during the image is lower when the image includes changes, consistent with a prediction error signal in CA1. Our findings provide a mechanism by which mnemonic prediction errors may drive memory updating-by biasing hippocampal states.


Conflict of interest statement

The authors declare no competing interests.

Figures

Fig. 1
Fig. 1. Trial example and behavioral results.
a Trial example: participants were presented with a cue probing them to retrieve a room image that they had extensively learned prior to the scan. After a short delay, they saw a probe image that included 0–4 changes relative to the learned image (four changes here), and indicated whether the seen image matched the learned image (see Methods). b Accuracy and c reaction times (RTs) in the match task. N = 19. Data are presented as mean values, error bars reflect +/− SEM. Source data are provided as a Source Data file.
Fig. 2
Fig. 2. Functional connectivity with region CA1.
a Mnemonic prediction errors decreased CA1–CA3 interaction, while increasing CA1–entorhinal cortex interaction, potentially reflecting reduced processing of erroneous predictions, and upregulating processing of sensory evidence. b Functional connectivity of CA1 with region CA2/CA3/DG (blue). Dots in the dots plot reflect individual participants’ linear decrease contrast score, computed across all number of changes (the preferable contrast in this pair of regions, main text). c Functional connectivity of CA1 with entorhinal cortex (green). Dots in the dots plot reflect individual participants’ 0-changes (match) < average of 1–4 changes (mismatch; the preferable contrast in this pair of regions, main text). # of changes: number of changes. F-transformed beta-series correlation was our measure of functional connectivity. Data are from the left hemisphere (see main text). N = 19. Data in the bar graphs are presented as mean values, error bars reflect +/− SEM. ⊗ Interaction of # of changes by ROI in a repeated-measures ANOVA: P = 0.0003. **P = 0.01, ***P = 0.003, the results of a one-way repeated-measures ANOVA within each pair of ROIs. Source data are provided as a Source Data file.
Fig. 3
Fig. 3. Mnemonic prediction errors in CA1.
a Mnemonic prediction error was assessed by computing the pattern similarity between the cue and the probe parts of the trial. b CA1 similarity between the cue and the image decreased when changes were introduced in the images. Data in the bar graphs are presented as mean values, error bars reflect +/− SEM. **P < 0.01. The result depicted by the black lines above the bars reflect the 0-changes (match) > average of 1–4-changes (mismatch) contrast, tested against 0 with a one-sample two-tailed t test. The other significance marks reflect a paired-sample t test between 0-changes and a specific level of changes. c Dots in the dots plot reflect individual participants’ scores in the 0-changes > average of 1–4-changes contrast. N = 19. Source data are provided as a Source Data file.

References

    1. Bar M. The proactive brain: memory for predictions. Philos. Trans. R. Soc. Lond. B. Biol. Sci. 2009;364:1235–1243. - PMC - PubMed
    1. Lisman JE, Redish AD. Prediction, sequences and the hippocampus. Philos. Trans. R. Soc. Lond. B. Biol. Sci. 2009;364:1193–1201. - PMC - PubMed
    1. Stachenfeld KL, Botvinick MM, Gershman SJ. The hippocampus as a predictive map. Nat. Neurosci. 2017;20:1643–1653. - PubMed
    1. Duncan K, Sadanand A, Davachi L. Memory’s penumbra: episodic memory decisions induce lingering mnemonic biases. Science. 2012;337:485–487. - PMC - PubMed
    1. Hasselmo ME, Stern CE. Theta rhythm and the encoding and retrieval of space and time. Neuroimage. 2014;85:656–666. - PMC - PubMed

Publication types

MeSH terms