. 2020 Jul 10;11(1):3452.
doi: 10.1038/s41467-020-17285-3.

Raman image-activated cell sorting

Affiliations

Raman image-activated cell sorting

Nao Nitta et al. Nat Commun. .

Abstract

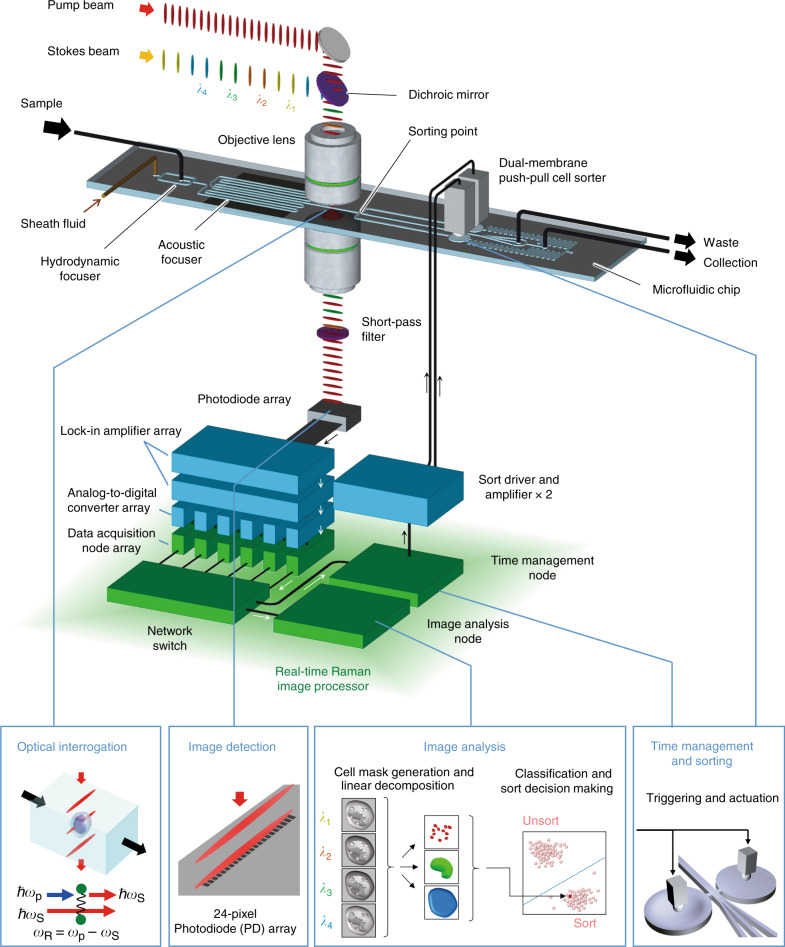
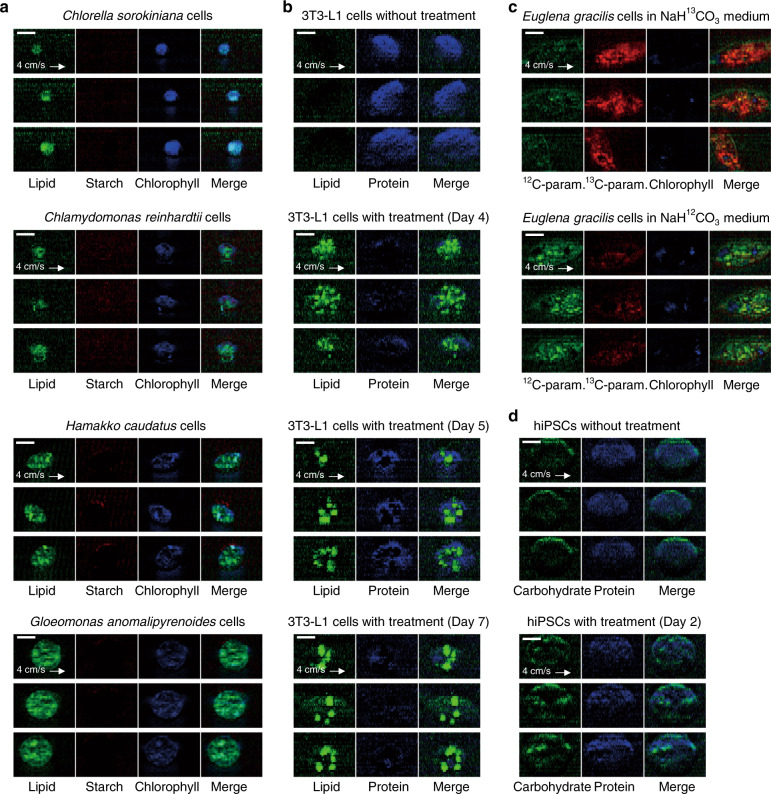
The advent of image-activated cell sorting and imaging-based cell picking has advanced our knowledge and exploitation of biological systems in the last decade. Unfortunately, they generally rely on fluorescent labeling for cellular phenotyping, an indirect measure of the molecular landscape in the cell, which has critical limitations. Here we demonstrate Raman image-activated cell sorting by directly probing chemically specific intracellular molecular vibrations via ultrafast multicolor stimulated Raman scattering (SRS) microscopy for cellular phenotyping. Specifically, the technology enables real-time SRS-image-based sorting of single live cells with a throughput of up to ~100 events per second without the need for fluorescent labeling. To show the broad utility of the technology, we show its applicability to diverse cell types and sizes. The technology is highly versatile and holds promise for numerous applications that are previously difficult or undesirable with fluorescence-based technologies.


Conflict of interest statement

Y.Su., Y.Oz., and K.G. are inventors of a patent application covering SRS imaging with a wavelength-switched laser. S.S., F.A., and T.Hay. are inventors of a patent application covering the dual-membrane push-pull cell sorter. N.N., T.Su., and K.G. are shareholders of CYBO. The remaining authors declare no competing interests.

Figures

Fig. 1
Fig. 1. Schematic of the RIACS.
Suspended cells injected into the RIACS are focused by the hydrodynamic and acoustic focusers into a single stream, detected by the event detector, imaged by the ultrafast multicolor SRS microscope, analyzed by the real-time Raman image processor, and sorted by the dual-membrane push-pull cell sorter triggered by decisions made by the real-time Raman image processor composed of multiple FPGAs, CPUs, and a network switch, all on a 10-Gbps all-IP network for high-speed digital image processing and decision making. The entire process is operated in a fully automated and real-time manner. Supplementary Fig. 1 shows pictures of the major components of the RIACS.
Fig. 2
Fig. 2. Basic performance of the RIACS.
a SRS spectra of PS and PMMA particles obtained by an SRS microscope. Four wavenumbers (2899, 2954, 3006, 3034 cm−1) were selected and used to decompose SRS images into two chemical species. b SRS images of PS and PMMA particles (representative of n = 9786 and n = 4063, respectively) at the four wavenumbers and decomposed images of the particles. Scale bar, 10 µm. c Scatter plot of the particles in PS and PMMA intensities per particle area (referred to as PS/PMMA densities) with the sort region (yellow). d Histograms of event rates in two sorting experiments (nominal throughput values: 50.2 eps, 85.6 eps). e Fluorescence images of sorted and unsorted particles in the collection and waste tubes, respectively (n = 2). The insets show enlarged images of the sorted and unsorted particles. Scale bar: 1 mm. f Theoretical estimation of the throughput-purity relation at various flow speed values together with our experimental verification (orange dots).
Fig. 3
Fig. 3. Various types of cells imaged by the RIACS.
Processing of the raw images was performed using ImageJ. Scale bars, 10 µm. a SRS images of various microalgal cells whose size ranges from 3 to 20 µm in cell diameter (n = 10,348 for Chlorella sorokiniana cells, n = 12,236 for Chlamydomonas reinhardtii cells, n = 11,050 for Hamakko caudatus cells, and n = 12,793 for Gloeomonas anomalipyrenoides cells). b SRS images of 3T3-L1 cells that gradually accumulated lipids in the cytoplasm over 7 days of treatment for inducing their differentiation into adipocyte-like cells (n = 11,159 for cells without treatment and n = 5,892, 10,359, and 10,114 for cells with 4, 5, and 7 days of treatment, respectively). c SRS images of Euglena gracilis cells with 12C/13C-isotope probing (n = 5679 and 2075, respectively). d SRS images of hiPSCs cultivated in two different culture media for the naïve pluripotent state (with 2 days of treatment, n = 1699) and the primed pluripotent state (without treatment, n = 1641).
Fig. 4
Fig. 4. Raman image-activated sorting of various types of cells with the RIACS.
a Procedure for sorting adipocyte-like cells. b Scatter plot of differentiated and undifferentiated 3T3-L1 cells in the spatial distribution of intracellular lipid droplets and the lipid intensity per cell area. 3T3-L1-derived adipocyte-like cells with a large spatial distribution of cytoplasmic lipid droplets (indicated by the yellow region) were sorted by the RIACS. The insets show representative SRS images of cells in the sort (n = 108) and unsort regions (n = 11,068). Scale bar: 10 µm. c Procedure for sorting Chlamydomonas sp. cells. d Scatter plot of Chlamydomonas sp. mutant cells in cell area and lipid density. Highly lipid-rich, but rare (only 0.3% of the total population) Chlamydomonas sp. mutants (indicated by the yellow region) were sorted by the RIACS. The inset shows representative SRS images of cells in the sort (n = 26) and unsort regions (n = 7760). Scale bar: 10 µm. e Procedure for sorting Euglena gracilis cells. f Scatter plot of the 50/50 mixture of Euglena gracilis cells cultured in NaH12CO3 and NaH13CO3 in 12C- and 13C-paramylon intensity per cell area. Euglena gracilis cells cultured in NaH13CO3 (indicated by the yellow region) were sorted by the RIACS. The inset shows representative SRS images of cells in the sort (n = 2075) and unsort regions (n = 13,669). Scale bar: 10 µm.

References

    1. Nitta N, et al. Intelligent image-activated cell sorting. Cell. 2018;175:266–276. - PubMed
    1. Isozaki A, et al. A practical guide to intelligent image-activated cell sorting. Nat. Protoc. 2019;14:2370–2415. - PubMed
    1. Gu Y, et al. Machine learning based real-time image-guided cell sorting and classification. Cytometry. 2019;95:499–509. - PMC - PubMed
    1. Ogunniyi AO, Story CM, Papa E, Guillen E, Love JC. Screening individual hybridomas by microengraving to discover monoclonal antibodies. Nat. Protoc. 2009;4:767–782. - PMC - PubMed
    1. Jin A, et al. A rapid and efficient single-cell manipulation method for screening antigen-specific antibody-secreting cells from human peripheral blood. Nat. Med. 2009;15:1088–1092. - PubMed

Publication types