. 2020 Jul 10;11(1):3458.
doi: 10.1038/s41467-020-17281-7.

Searching large-scale scRNA-seq databases via unbiased cell embedding with Cell BLAST

Affiliations

Searching large-scale scRNA-seq databases via unbiased cell embedding with Cell BLAST

Zhi-Jie Cao et al. Nat Commun. .

Abstract

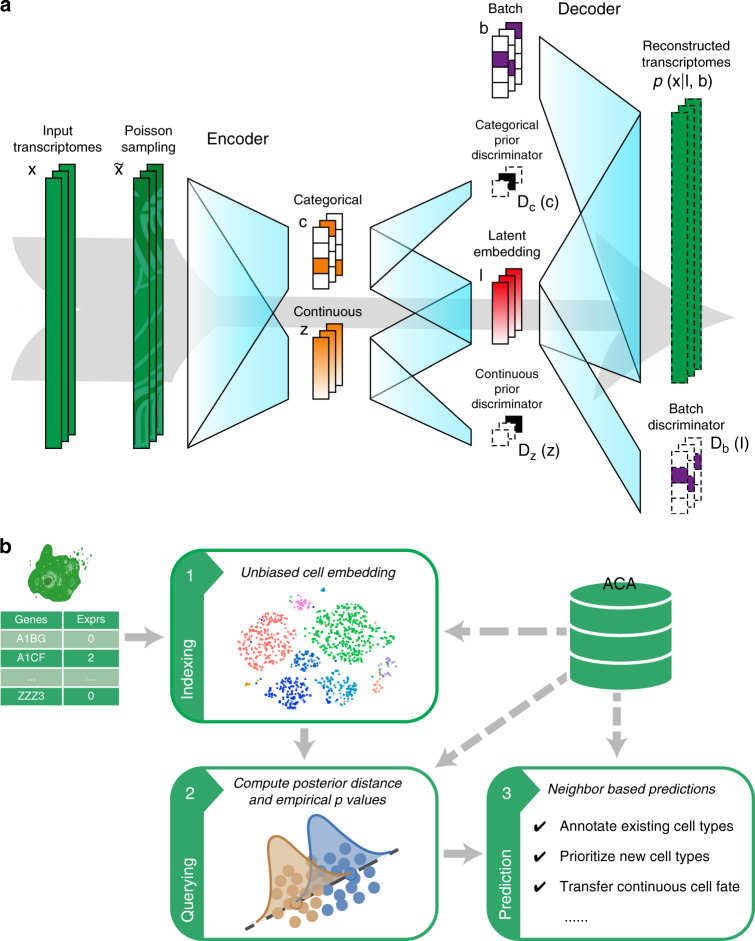
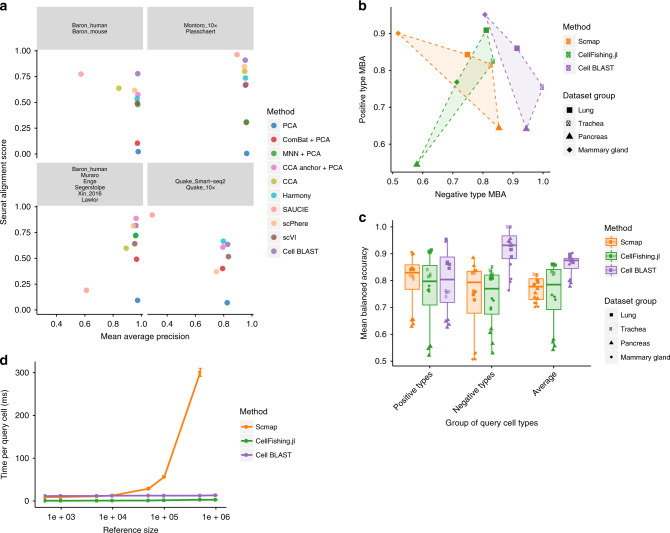
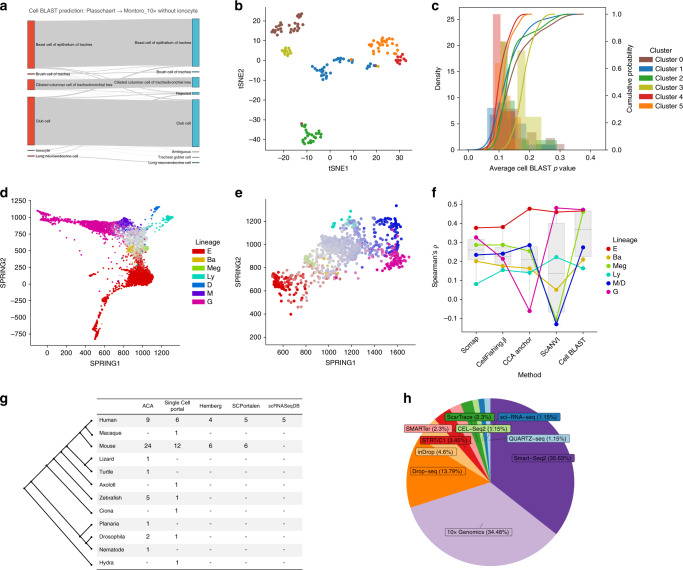
Single-cell RNA-seq (scRNA-seq) is being used widely to resolve cellular heterogeneity. With the rapid accumulation of public scRNA-seq data, an effective and efficient cell-querying method is critical for the utilization of the existing annotations to curate newly sequenced cells. Such a querying method should be based on an accurate cell-to-cell similarity measure, and capable of handling batch effects properly. Herein, we present Cell BLAST, an accurate and robust cell-querying method built on a neural network-based generative model and a customized cell-to-cell similarity metric. Through extensive benchmarks and case studies, we demonstrate the effectiveness of Cell BLAST in annotating discrete cell types and continuous cell differentiation potential, as well as identifying novel cell types. Powered by a well-curated reference database and a user-friendly Web server, Cell BLAST provides the one-stop solution for real-world scRNA-seq cell querying and annotation.


Conflict of interest statement

The authors declare no competing interests.

Figures

Fig. 1
Fig. 1. Cell BLAST model and workflow.
a Structure of the generative model used by Cell BLAST. b Overall Cell BLAST workflow.
Fig. 2
Fig. 2. Cell BLAST benchmarking.
a Extent of dataset mixing as measured by Seurat alignment score, versus cell-type resolution, as measured by mean average precision, after batch effect correction in four groups of datasets. Both scores range between 0 and 1. Specifically, a high Seurat alignment score indicates that local neighborhoods consist of cells from different datasets uniformly rather than from the same dataset only, i.e., different datasets mix well. Meanwhile, mean average precision can be thought of as a generalization to nearest-neighbor accuracy, with larger values indicating higher cell-type resolution. It is reported to ensure that dataset mixing does not blur the true biological signal. CCA and MNN failed in the last dataset due to memory errors. b MBA of query-based cell typing on positive versus negative queries. Points of the same method are outlined for clarity. As CellFishing.jl does not come with a query-based prediction method, we used the same strategy as Cell BLAST, with Hamming distance = 120 as cutoff determined from grid searching for best balance between correctly predicting positive types and rejecting negative types across all four datasets (see “Methods” and Supplementary Fig. 8a, c for more details). c MBA of query-based cell typing on positive and negative queries as well as their arithmetic average (n = 16 experiments across four query groups for each method). Box plots indicate the median (center lines), 1st and 3rd quartiles (hinges), minimal and maximal point within 1.5 times the interquartile range starting from the hinges (whiskers). d Querying speed on reference datasets of different sizes subsampled from the 1.3 M mouse brain dataset (n = 4 independent experiments for each method at each reference size). Error bars indicate mean ± s.d.
Fig. 3
Fig. 3. Cell BLAST application.
a Sankey plot comparing Cell BLAST predictions and original cell-type annotations for the “Plasschaert” dataset. b tSNE visualization of Cell BLAST-rejected cells, colored by unsupervised clustering. c Average Cell BLAST empirical P-value (“Methods”) distribution of each cluster in (b). d SPRING visualization of cell embeddings learned on the “Tusi” dataset, colored by cell fate. Each of the seven terminal cell fates (E erythroid, Ba basophilic or mast, Meg megakaryocytic, Ly lymphocytic, D dendritic, M monocytic, G granulocytic neutrophil) is assigned a distinct color. The hue of each cell is then determined by the lineage with largest probability, while the saturation of each cell is determined by the entropy of cell fate distribution, i.e., terminally committed cells have more vibrant colors while undifferentiated cells appear to be gray. e SPRING visualization of the “Velten” dataset, colored by Cell BLAST predicted cell fate. f Spearman correlation between predicted cell fate probabilities and expression of known lineage markers in the “Velten” dataset (n = 6 lineages, where M and D are merged as they are indistinguishable in “Velten” according to the original publication). Box plots indicate the median (center lines), 1st and 3rd quartiles (hinges), minimum and maximum (whiskers). g Number of organs covered in each species for different single-cell transcriptomics databases, including the Single Cell Portal (https://singlecell.broadinstitute.org/single_cell), Hemberg collection, SCPortalen, and scRNASeqDB. h Composition of different single-cell sequencing platforms in ACA.

References

    1. Altschul SF, Gish W, Miller W, Myers EW, Lipman DJ. Basic local alignment search tool. J. Mol. Biol. 1990;215:403–410. - PubMed
    1. Kiselev VY, Yiu A, Hemberg M. scmap: projection of single-cell RNA-seq data across data sets. Nat. Methods. 2018;15:359–362. - PubMed
    1. Srivastava D, Iyer A, Kumar V, Sengupta D. CellAtlasSearch: a scalable search engine for single cells. Nucleic Acids Res. 2018;46:W141–W147. - PMC - PubMed
    1. Sato K, Tsuyuzaki K, Shimizu K, Nikaido I. CellFishing.jl: an ultrafast and scalable cell search method for single-cell RNA sequencing. Genome Biol. 2019;20:31. - PMC - PubMed
    1. Tung PY, et al. Batch effects and the effective design of single-cell gene expression studies. Sci. Rep. 2017;7:39921. - PMC - PubMed

Publication types