. 2020 Jul 10;10(1):11462.
doi: 10.1038/s41598-020-67314-w.

Group structure and kinship in beluga whale societies

Affiliations

Group structure and kinship in beluga whale societies

Greg O'Corry-Crowe et al. Sci Rep. .

Abstract

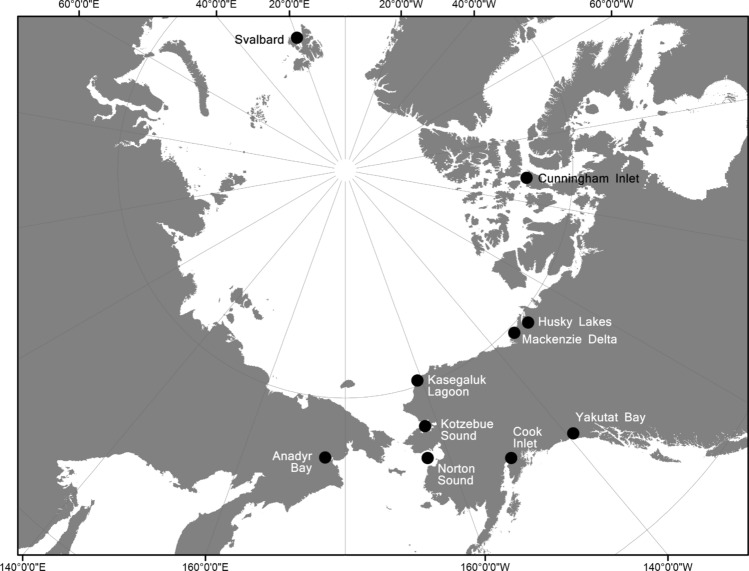
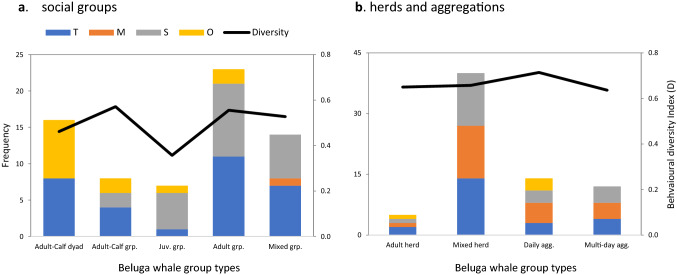
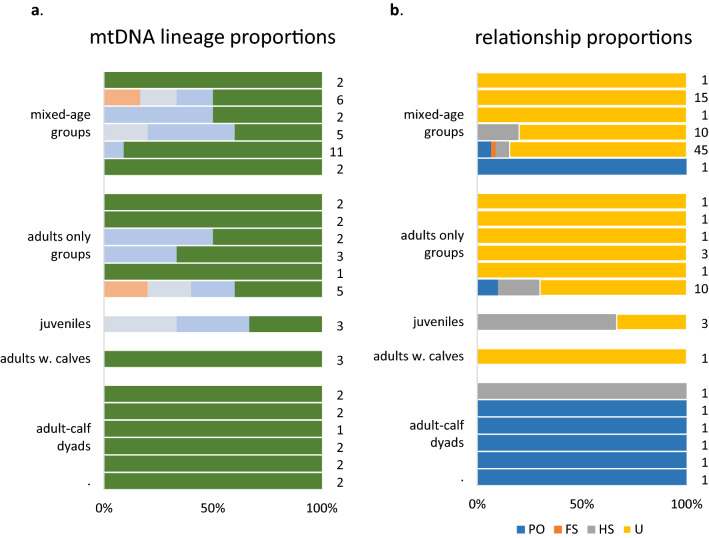
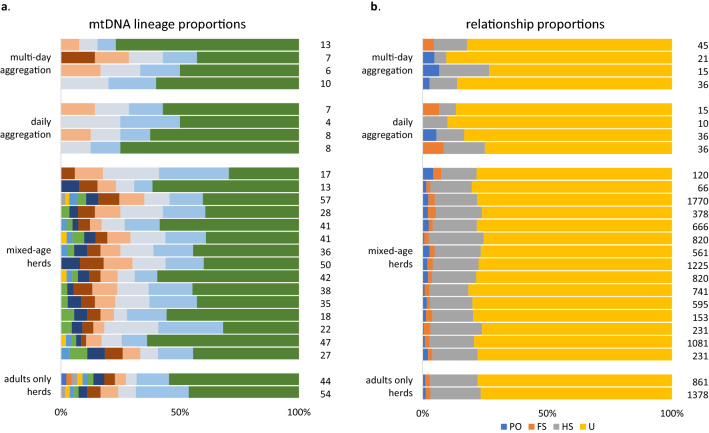
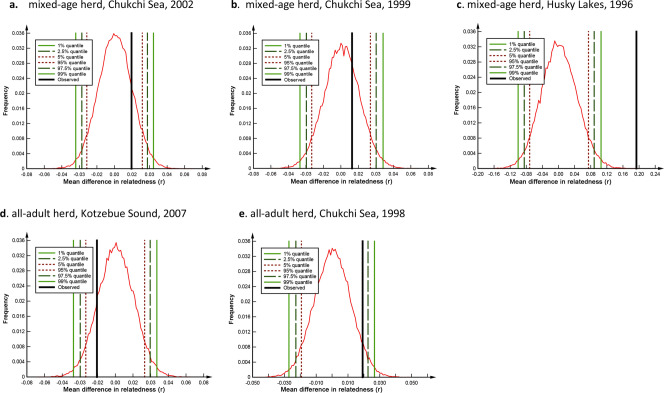
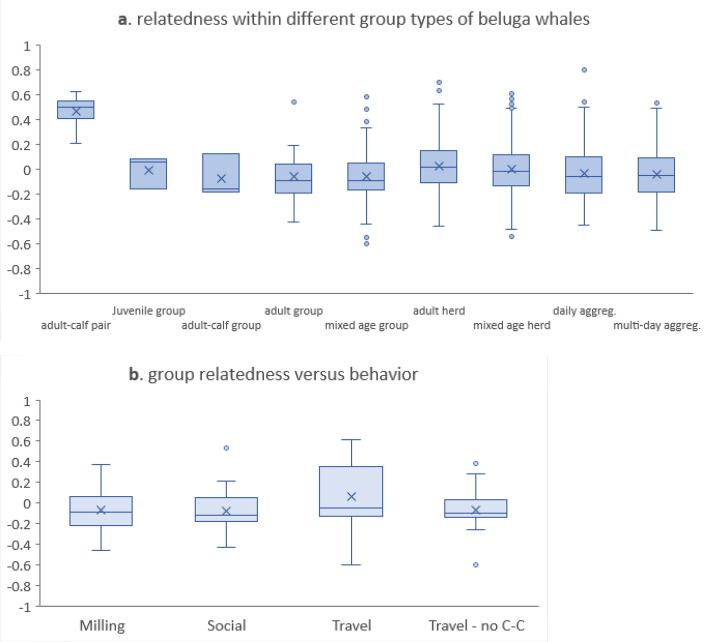
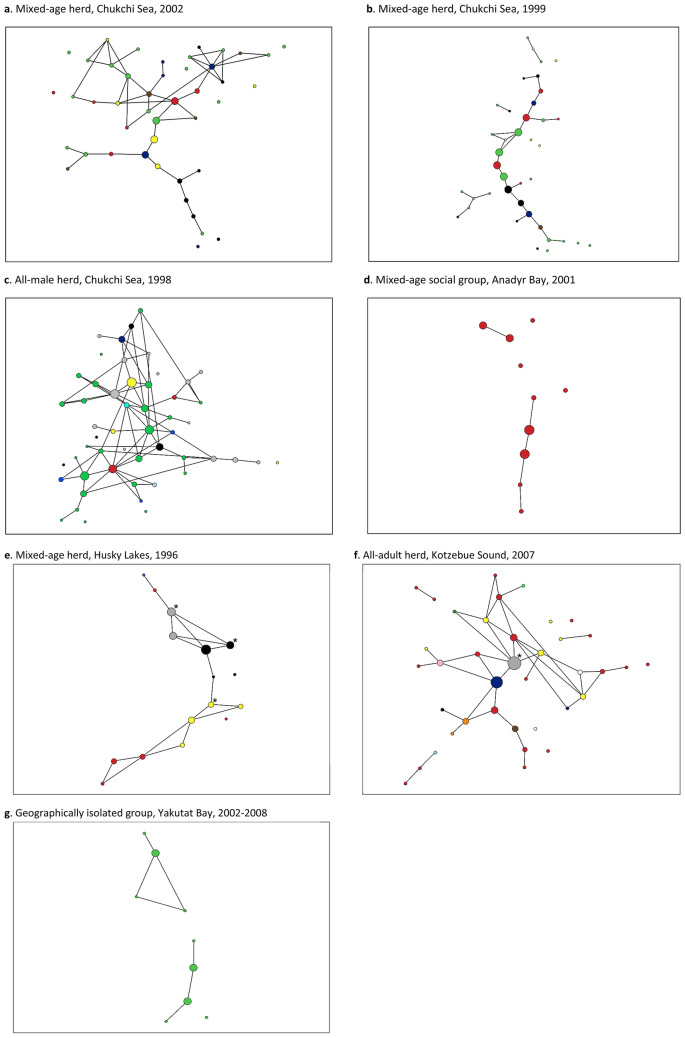
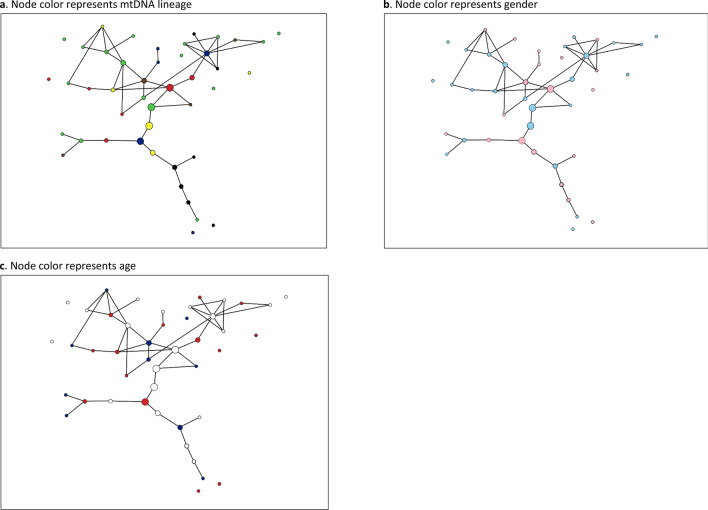
Evolutionary explanations for mammalian sociality typically center on inclusive-fitness benefits of associating and cooperating with close kin, or close maternal kin as in some whale societies, including killer and sperm whales. Their matrilineal structure has strongly influenced the thinking about social structure in less well-studied cetaceans, including beluga whales. In a cross-sectional study of group structure and kinship we found that belugas formed a limited number of distinct group types, consistently observed across populations and habitats. Certain behaviours were associated with group type, but group membership was often dynamic. MtDNA-microsatellite profiling combined with relatedness and network analysis revealed, contrary to predictions, that most social groupings were not predominantly organized around close maternal relatives. They comprised both kin and non-kin, many group members were paternal rather than maternal relatives, and unrelated adult males often traveled together. The evolutionary mechanisms that shape beluga societies are likely complex; fitness benefits may be achieved through reciprocity, mutualism and kin selection. At the largest scales these societies are communities comprising all ages and both sexes where multiple social learning pathways involving kin and non-kin can foster the emergence of cultures. We explore the implications of these findings for species management and the evolution of menopause.


Conflict of interest statement

The authors declare no competing interests.

Figures

Figure 1
Figure 1
Map of the Arctic showing the ten locations across the beluga whales’ range where group structure, behavior, dynamics and kinship were investigated. In some locations only limited field data was collected. The map was generated based on a publicly available ArcMap polar projection document using ArcGIS 10.1 (www.esri.com).
Figure 2
Figure 2
A bar chart showing the frequency and diversity of behaviours observed in beluga whale social groups and herds. Behavior is grouped into four broad categories: (T) Travel, (M) Mill, (S) Social, and (O) Other. Frequencies are indicated by stacked columns scaled to the primary y-axis. The behavioural diversity index, D, (see text) is indicated by a line scaled to the secondary y-axis. Panel (a) summarizes findings for beluga whale social groups, panel (b) for the herds and aggregations.
Figure 3
Figure 3
A horizontal bar chart showing the proportion of the different mtDNA lineages observed, and of the four pairwise genealogical relationships estimated, within beluga whale social groups. Each horizontal bar represents an individual social group where multiple individuals (n ≥ 2) were sampled. (a) Each colour represents a unique mtDNA lineage, and the number of samples successfully sequenced appear on the right; (b) colours represent the proportions of parent–offspring (PO), full-sib (FS), half-sib and grandparent–grandchild (HS), and unrelated (U) pairings, and the number of pairwise comparisons appears on the right. Note, in the case of the mtDNA results that the occurrence of the same colour across groups does not necessarily indicate that the same lineage was found in both.
Figure 4
Figure 4
A horizontal bar chart showing the proportion of different mtDNA lineages observed and the proportion of four pairwise genealogical relationships estimated within beluga whale herds and aggregations. Each horizontal bar represents an individual herd/aggregation where multiple individuals (n ≥ 5) were sampled. (a) Each colour represents a unique mtDNA lineage, and the number of samples successfully sequenced appear at the right; (b) Colours represent the proportions of parent–offspring (PO), full-sib (FS), half-sib and grandparent–grandchild (HS), and unrelated (U) pairings, and the number of pairwise comparisons appear at the right. Note, in the case of the mtDNA results that the occurrence of the same colour across groups does not necessarily indicate that the same lineage was found in both.
Figure 5
Figure 5
A series of graphs sumamrizing the outcomes of tests of differences in mean relatedness, r, within matrilines compared to mean r between matrilines in beluga whale groupings using COANCESTRY v. 1.01.10. Results from a subset of herds with multiple mtDNA haplotypes are shown using the moment estimator rQG of Queller and Goodnight (1989). If the observed difference (black line) falls outside the 90% (dotted lines), 95% (dashed lines), and 99% (green solid lines) confidence intervals from the bootstrap analysis distribution the difference is adjudged to be significant.
Figure 6
Figure 6
Box and whisker plots showing the patterns of relatedness within and between beluga whale group types and behaviors. The median (horizontal bar) not the mean was used as the central tendency. Boxes encompass the inter-quartile range (IQR) around the median, and the whiskers capture the range that is 1.5 times the IQR. Values outside this range were identified as outliers. (a) Observed pairwise r across group types; (b) observed r by behavioral category. Travel was assessed for all group types including adult–calf dyads (labelled ‘Travel’), as well as for all group types excluding the adult–calf dyads (labelled ‘Travel—no C–C’).
Figure 7
Figure 7
Networks of beluga whale social groups and herds based on pairwise genetic relatedness. Node size reflects betweenness centrality, node colour represents mtDNA lineage. Percolation thresholds were set to the point where links among unrelated pairs of whales were excluded. Calves in the Husky Lakes network are indicated by asterisks. The lone female in the Kotzebue Sound network is indicated by an asterisk. The Yakutat network is a compilation of the majority of individuals in a small geographically isolated group of whales (Nmin ≈ 12) sampled across 7 years. Networks were constructed using EDENetworks v. 2.18.
Figure 8
Figure 8
Network of a mixed-age beluga whale herd from the Chukchi Sea based on pairwise genetic relatedness. Node size reflects betweenness centrality. (a) node colour represents mtDNA lineage; (b) node colour represents sex: male (blue), and female (pink); (c) node colour represents age: juvenile (blue), young adult (white), old adult (red). Networks were constructed using EDENetworks v. 2.18.
Figure 9
Figure 9
Network of the beluga whales that were biopsy sampled in Cunningham Inlet in the summer of 1998 based on pairwise genetic relatedness. Node and edge size are fixed, and percolation thresholds were set to the point where links among unrelated pairs of whales were excluded. (a) Nodes with the same colour indicate whales that were in the same social group when sampled. For example, the three dark blue nodes indicate three individuals from an all-juvenile group, while the six red nodes indicate individuals from a mixed-age group. (b) Nodes with the same shading indicate whales that were in the same daily aggregation when sampled. White coloured nodes indicate whales that were not sampled in a social group or within a daily aggregation, respectively. Networks were constructed using EDENetworks v. 2.18.

References

    1. Hamilton WD. The genetical evolution of social behavior I. J. Theor. Biol. 1964;7:1–6. - PubMed
    1. Trivers RL. The evolution of reciprocal altruism. Q. Rev. Biol. 1971;46:35–57.
    1. Axelrod R, Hamilton WD. The evolution of cooperation. Science. 1981;211:1390–1396. - PubMed
    1. Maynard Smith J. Game theory and the evolution of cooperation. In: Bendall DS, editor. Evolution from Molecules to Men. Cambridge: Cambridge University Press; 1983. pp. 445–456.
    1. Clutton-Brock T. Cooperation between non-kin in animal societies. Nature. 2009;462:51–57. - PubMed

Publication types