. 2020 Sep;26(9):1422-1427.
doi: 10.1038/s41591-020-0998-x. Epub 2020 Jul 10.

Rapid isolation and profiling of a diverse panel of human monoclonal antibodies targeting the SARS-CoV-2 spike protein

Affiliations

Rapid isolation and profiling of a diverse panel of human monoclonal antibodies targeting the SARS-CoV-2 spike protein

Seth J Zost et al. Nat Med. 2020 Sep.

Abstract

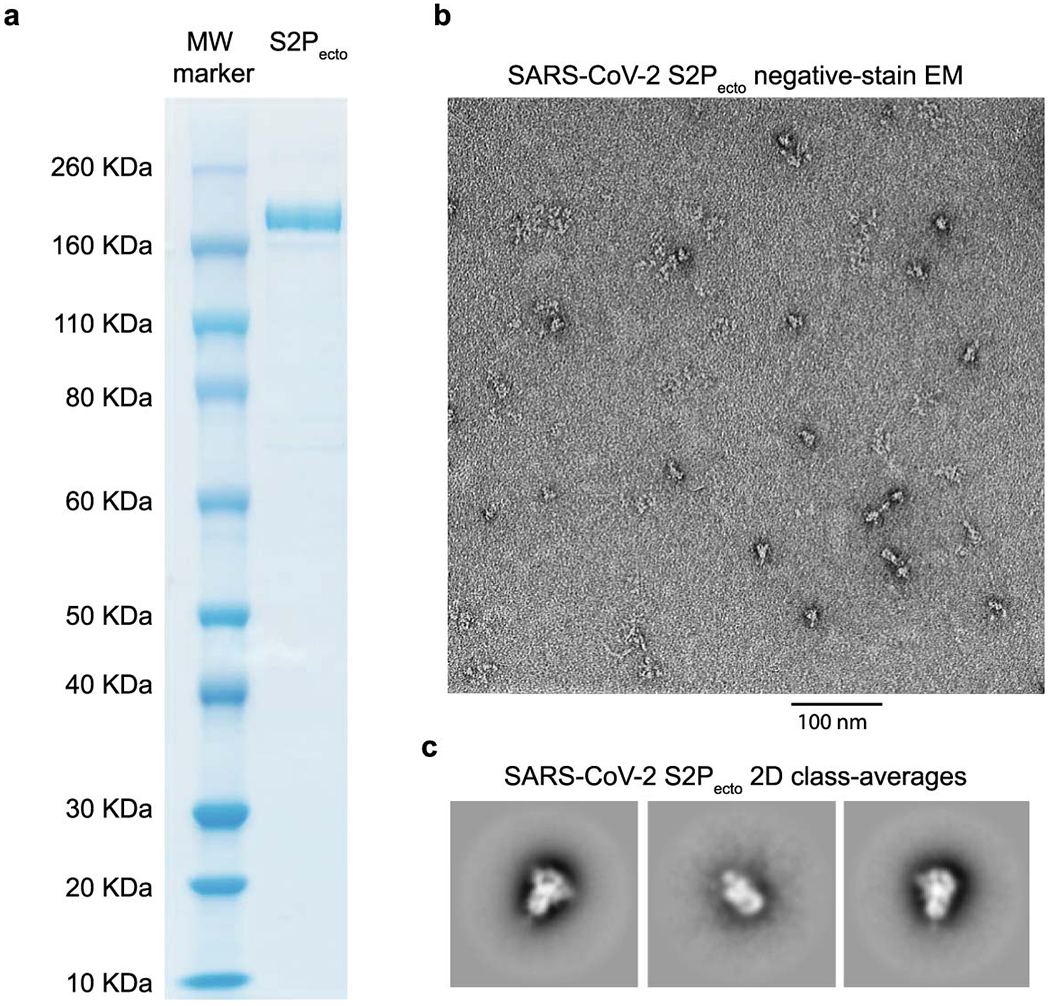
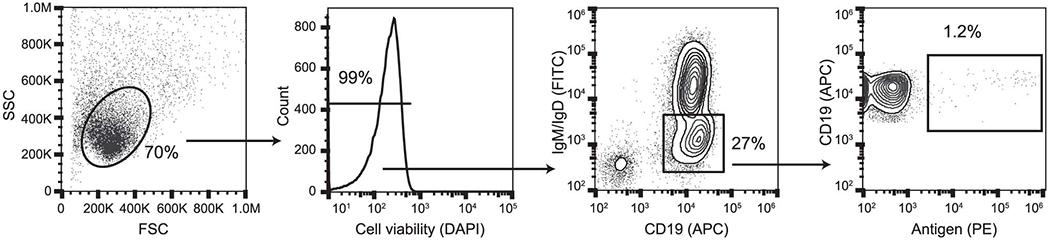
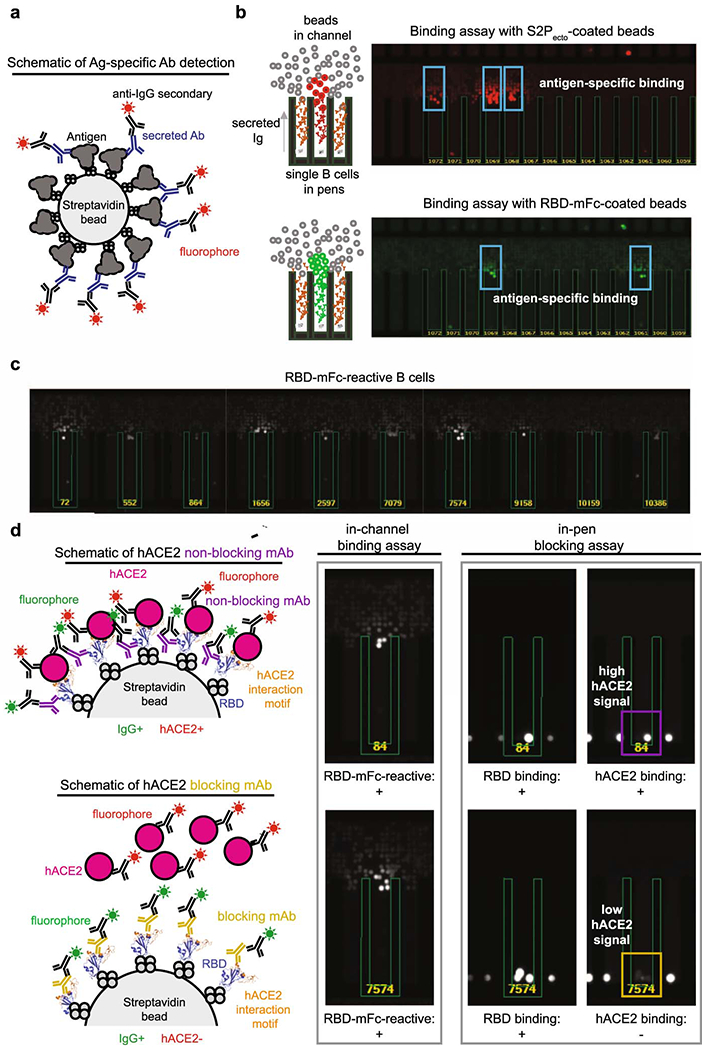
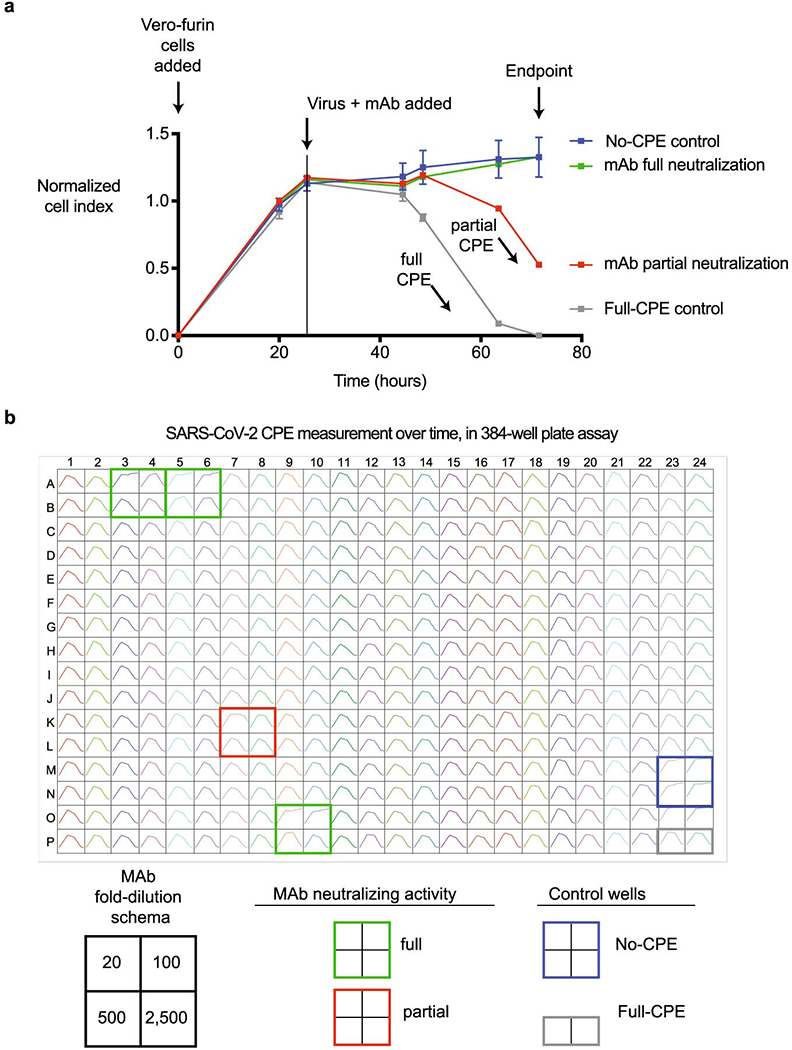
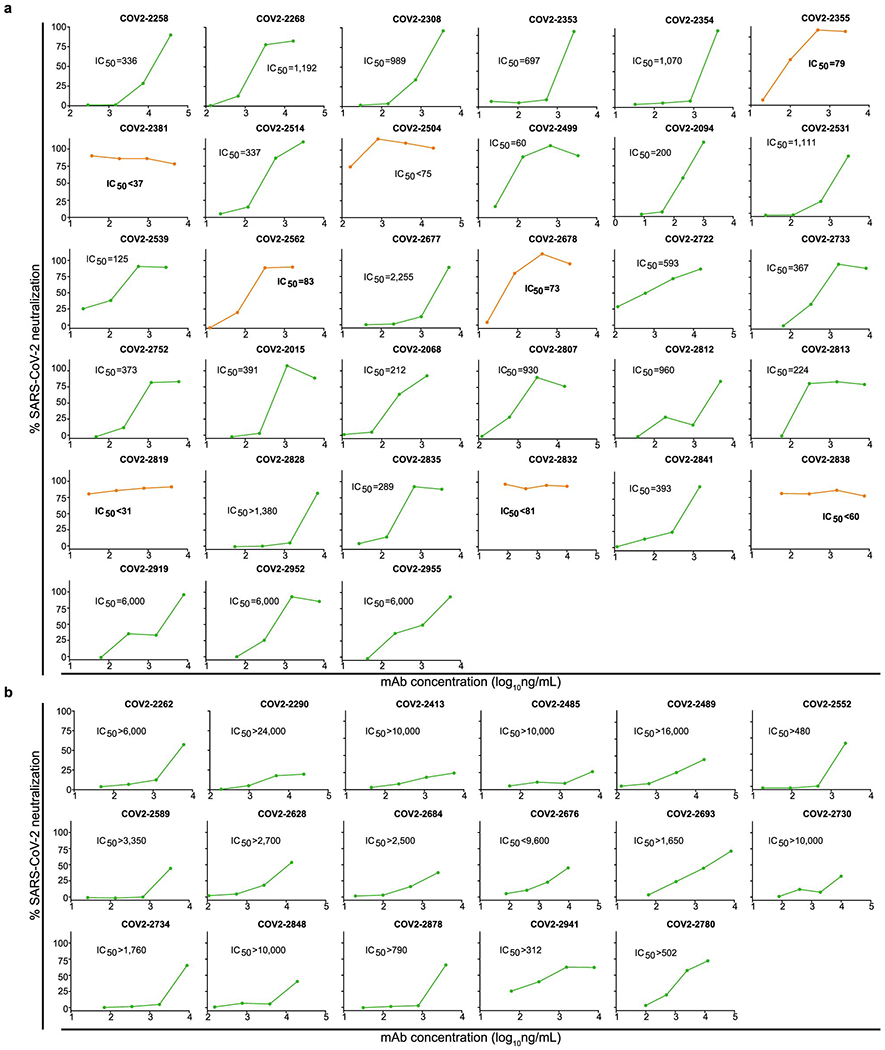
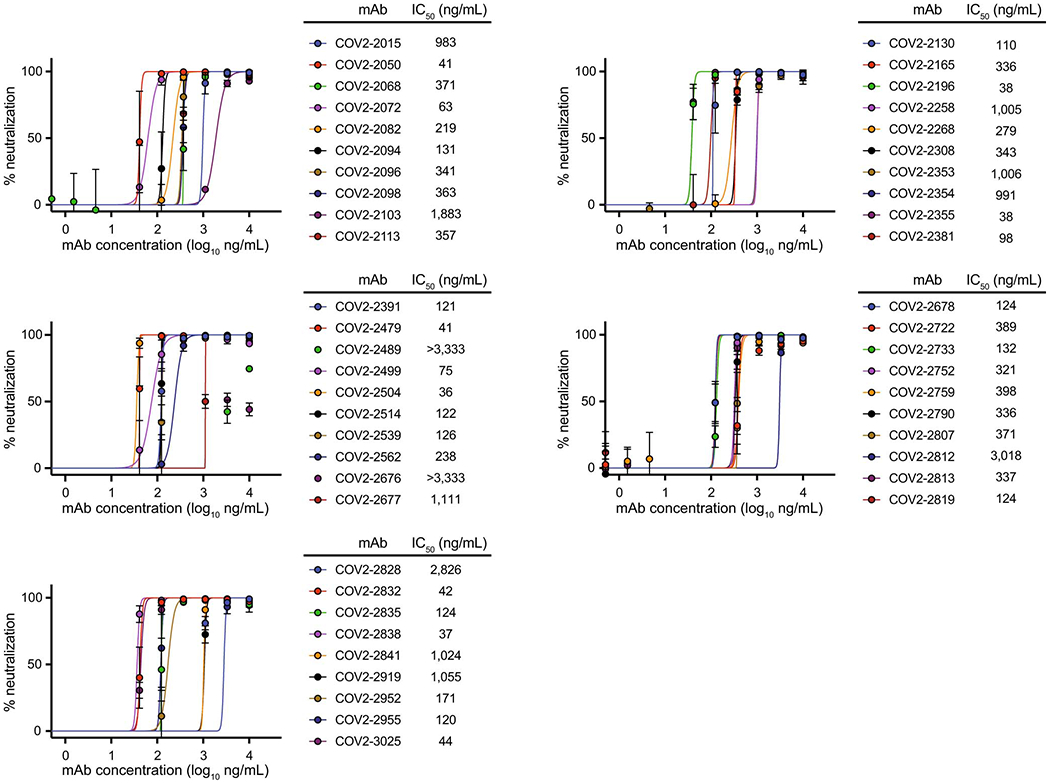
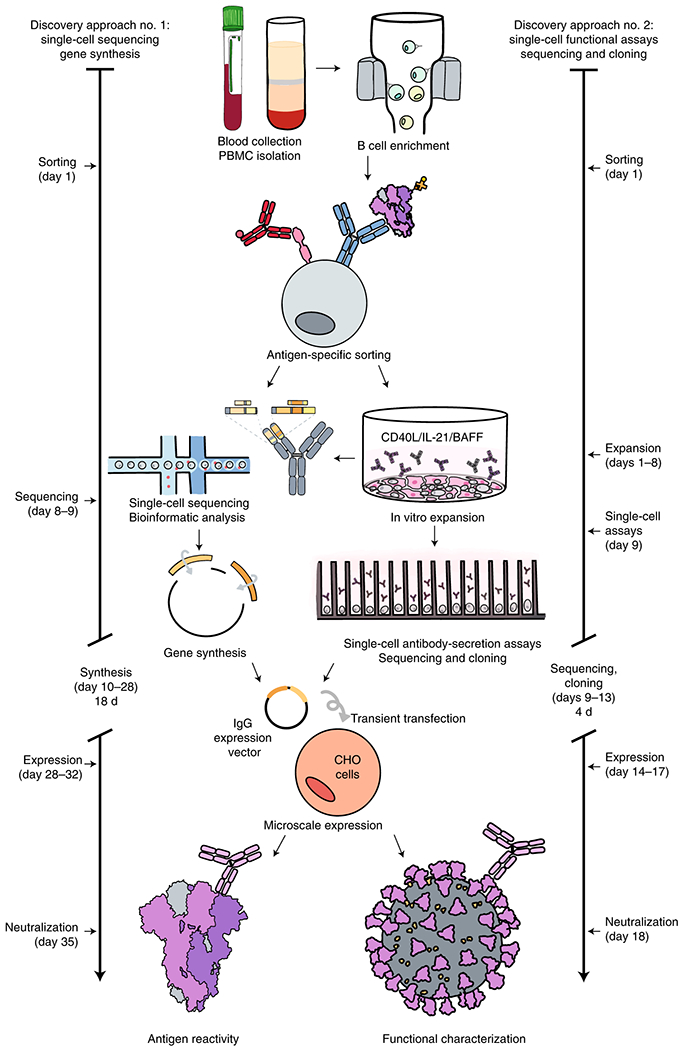
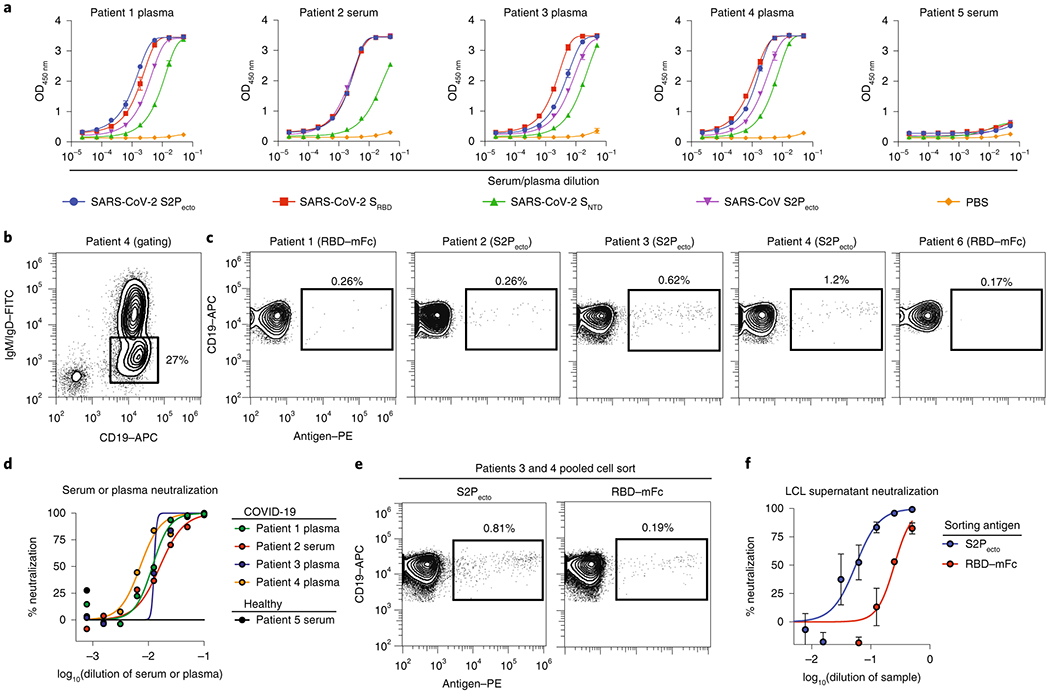
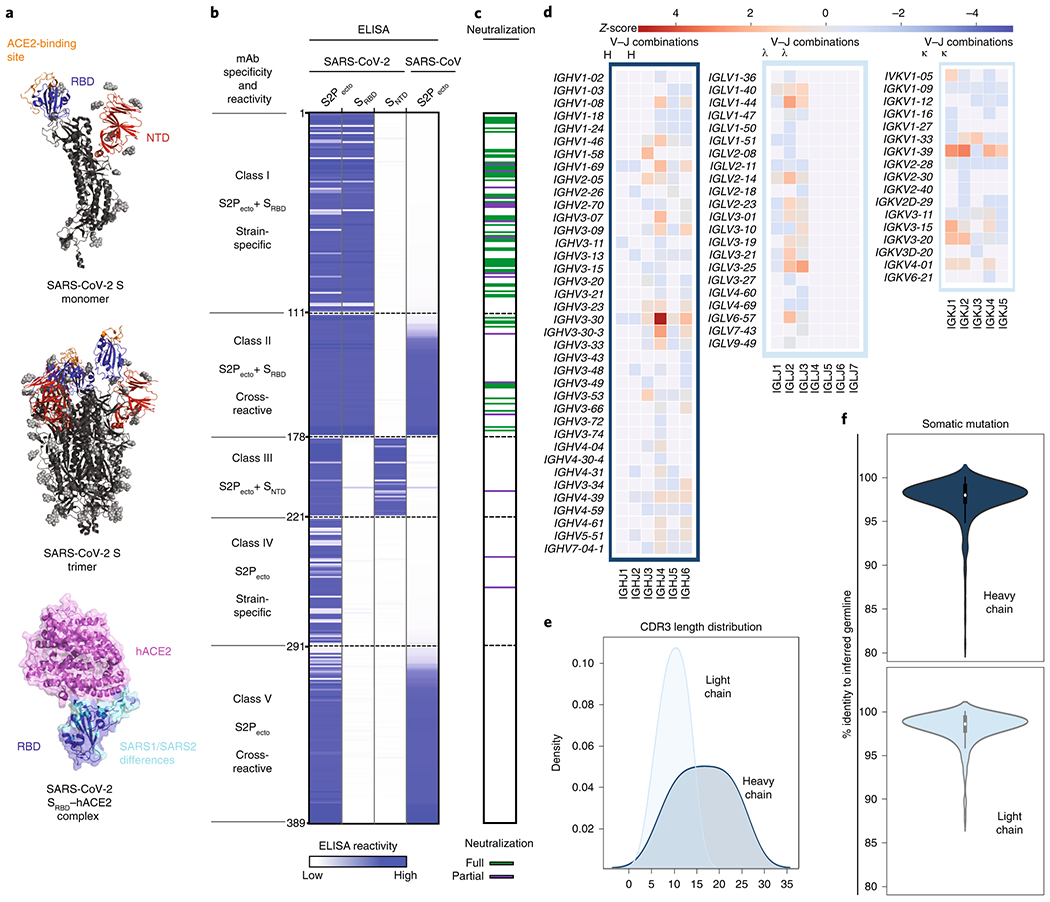
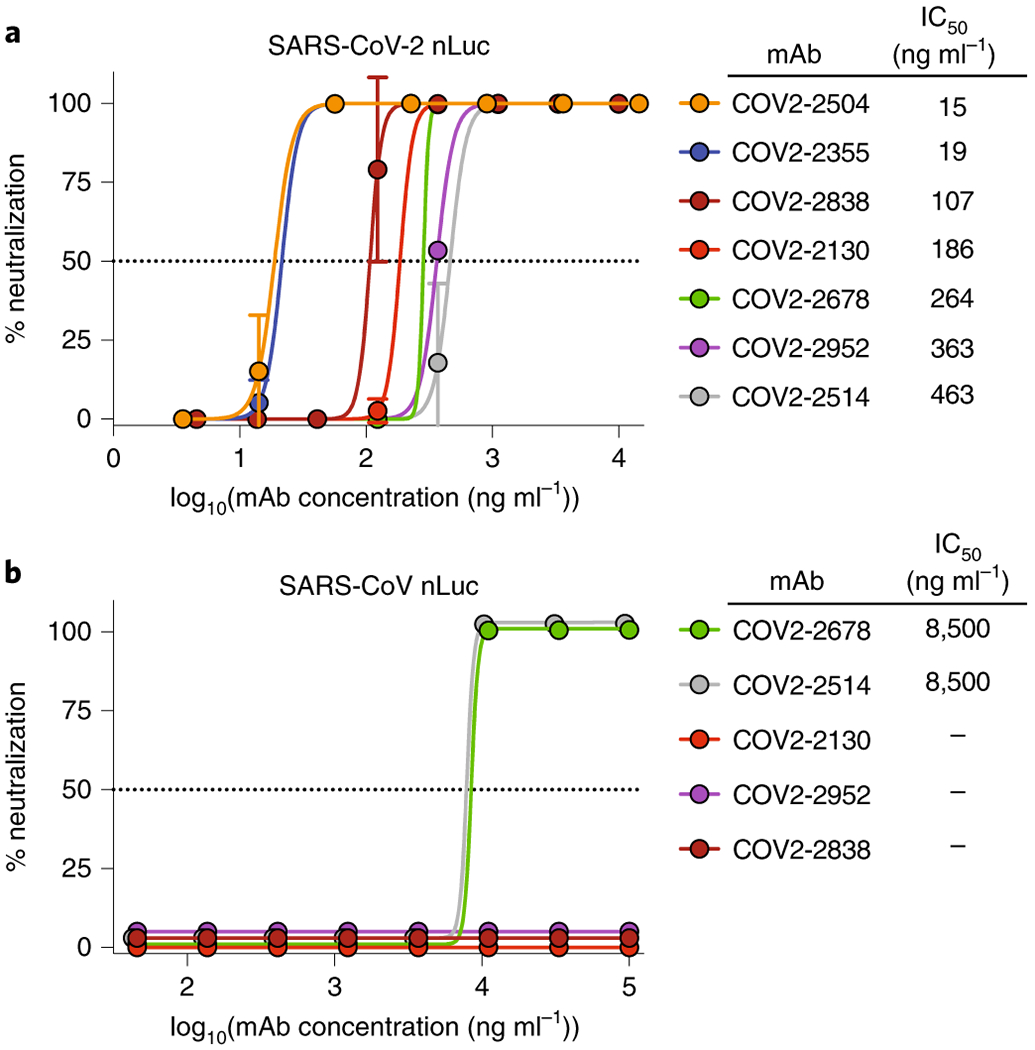
Antibodies are a principal determinant of immunity for most RNA viruses and have promise to reduce infection or disease during major epidemics. The novel coronavirus SARS-CoV-2 has caused a global pandemic with millions of infections and hundreds of thousands of deaths to date1,2. In response, we used a rapid antibody discovery platform to isolate hundreds of human monoclonal antibodies (mAbs) against the SARS-CoV-2 spike (S) protein. We stratify these mAbs into five major classes on the basis of their reactivity to subdomains of S protein as well as their cross-reactivity to SARS-CoV. Many of these mAbs inhibit infection of authentic SARS-CoV-2 virus, with most neutralizing mAbs recognizing the receptor-binding domain (RBD) of S. This work defines sites of vulnerability on SARS-CoV-2 S and demonstrates the speed and robustness of advanced antibody discovery platforms.


Figures

Extended Data Fig. 1.
Extended Data Fig. 1.. Expression and validation of prefusion-stabilized SARS-CoV-2 S2Pecto protein.
a. Reducing SDS-PAGE gel indicating S2Pecto protein migrating at approximately 180 KDa. One representative protein preparation is shown. b. Representative micrograph of negative-stain electron microscopy with S2Pecto protein preparation. Scale bar denotes 100 nm. c. 2D class-averages of S2Pecto protein in the prefusion conformation. The size for each box is 128 pixels. Detailed information on image collection is available in Extended Data Table 1.
Extended Data Fig. 2.
Extended Data Fig. 2.. Representative gating strategy for antigen-specific cell sorting.
Representative gating strategy for profiling of antigen-specific B cell frequency for donors. Subject 4 is shown, and phenotypic markers are shown on plot axes. Arrows indicate cell populations derived from gates.
Extended Data Fig. 3.
Extended Data Fig. 3.. Functional assays from single antigen-reactive B cells.
a. Schematic of detection of antigen-specific antibody. Biotinylated antigen (dark grey) was coupled to a streptavidin-conjugated polystyrene bead (light grey). Antibodies (blue) are secreted by single B cells loaded into individual NanoPens on the Berkeley Lights Beacon optofluidic device. Antibody binding to antigen was detected with a fluorescent anti-human IgG secondary Ab (black). b. Left: Schematic of fluorescing beads in the channel above a pen containing an individual B cell indicates antigen-specific reactivity. Top right: False-color still image of positive wells with B cells secreting S2Pecto-reactive antibodies. Reactive antibody diffusing out of a pen is visualized as a plume of fluorescence. Bottom right: False-color still image of positive wells with B cells secreting RBD-mFc-reactive antibodies. c. Representative images of RBD-mFc reactive B cells from a single-B-cell secretion assay d. Identification of mAbs with hACE2-blocking activity using single-cell functional screening. Left: Schematic illustrating detection of secreted Ab and hACE2 binding on an RBD-mFc-coated streptavidin bead. Ab binding was detected in one fluorescent channel, while hACE2 binding was detected in another fluorescent channel. The top panel illustrates an RBD-binding, non-blocking mAb, where the bead is positive for both Ab and hACE2 signals, while the bottom panel illustrates an RBD-binding mAb that competes with hACE2 for binding, where the bead is positive for only Ab signal. Right: Representative images of a B cell secreting non-blocking Abs (top) and a B cell secreting hACE2-blocking mAbs (bottom). Streptavidin beads are loaded into the same pens as B cells. The fluorescence of the streptavidin beads in the same pen as the B cell secreting hACE2-blocking Abs is reduced relative to adjacent wells, indicating hACE2-blocking activity.
Extended Data Fig. 4.
Extended Data Fig. 4.. Real-time cell analysis assay to screen for neutralization activity.
a. Representative sensograms for neutralizing mAbs. Curves for fully neutralizing mAb (green) and partially neutralizing mAb (red) by monitoring of CPE in Vero-furin cells that were inoculated with SARS-CoV-2 and pre-incubated with the respective mAb. Uninfected cells (blue) and infected cells without antibody addition (grey) served as controls for intact monolayer and full CPE, respectively. Data represent a single well measurement for each mAb at the highest tested concentration, mean ± SD values of technical duplicates for the positive CPE control, and mean ± SD values of technical quadruplicates for the no-CPE controls. b. Example sensograms from individual wells of 384-well E-plate analysis showing rapid identification of SARS-CoV-2 neutralizing mAbs. Neutralization was assessed using micro-scale purified mAbs and each mAb was tested in four 5-fold dilutions as indicated. Plates were measured every 8-12 hrs for a total of 72 hrs as in (a).
Extended Data Fig. 5.
Extended Data Fig. 5.. Real-time cell analysis assay to quantify neutralization potency.
Dose-response curves showing activity of neutralizing mAbs that were identified by rapid screening using the RTCA assay, as in Extended Data Fig. 4. Each mAb was tested in four sequential five-fold dilutions from micro-scale purified samples in which mAbs concentrations were not normalized but quantified. Neutralization was calculated as the percent of maximal cell index in control wells without virus minus cell index in control (virus-only) wells that exhibited maximal CPE at 40 to 48 hrs after applying virus-antibody mixture to the cells. a. Representative neutralizing mAbs that fully prevented CPE at the lowest tested dilution (corresponding to the highest tested mAb concentration) are shown. IC50 values estimated from each curve are indicated. Curves for potently neutralizing mAbs (IC50<100 ng/mL) are shown in orange, from which mAbs COV2–2355 and COV2–2381 are genetically related. b. Representative neutralizing mAbs that partially prevented CPE at the lowest tested dilution (corresponding to the highest tested mAb concentration) are shown.
Extended Data Fig. 6.
Extended Data Fig. 6.. Quantitative neutralization assays of VSV-SARS-CoV-2
Dose-response neutralization of VSV-SARS-CoV-2 by neutralizing mAbs. IC50 values are indicated for each mAb. Data shown are the mean of two technical replicates from a single experiment, and error bars denote the standard deviation for each point.
Fig. 1.
Fig. 1.. Workflows and timelines.
a. Overview of rapid monoclonal antibody discovery workflows. The overall scheme is shown, representing the several specific workflows conducted in parallel (specified in Supplemental Table 1). Blood was collected and white blood cells separated, B cells were enriched from PBMCs by negative selection using magnetic beads, antigen-specific cells were isolated by flow cytometric sorting, then processed for direct B cell selection and sequencing or in vitro expansion/activation. Cultured B cells were loaded on a Beacon instrument (Berkeley Lights) for functional screening (Extended Data Fig. 3, Supplemental Movie 1) or in a Chromium device (10X Genomics) followed by RT-PCR, sequence analysis, cDNA gene synthesis and cloning into an expression vector, and microscale IgG expression in CHO cells by transient transfection. Recombinant IgG was tested by ELISA for binding to determine antigen reactivity and by a high-throughput neutralization screening assay (xCelligence; ACEA) (Extended Data Fig. 4) with authentic virus in a BSL3 laboratory for functional characterization.
Fig. 2.
Fig. 2.. Characterization of SARS-CoV-2 immune donor samples.
a. Serum or plasma antibody reactivity for the four SARS-CoV-2 immune subjects or one non-immune control, in ELISA using SARS-CoV-2 S2Pecto, SRBD, SNTD, SARS-CoV S2Pecto or PBS. b. Gating for memory B cells in total B cells enriched by negative selection using magnetic beads for subject 4; Cells were stained with anti-CD19 antibody conjugated to allophycocyanin (APC) and anti-IgM and anti-IgD antibodies conjugated to fluorescein isothiocyanate (FITC). c. Analytical flow cytometric analysis of B cells for subjects 1 to 4, compared to a healthy subject (subject 6). Plots show CD19+IgDIgM population using gating strategy as in b. Cells labeled with biotinylated S2Pecto or RBD-mFc antigens were detected using phycoerythrin (PE)-conjugated streptavidin. d. Plasma or serum neutralizing activity against the WA1/2020 strain SARS-CoV-2 for subjects 1 to 4 or a healthy donor (subject 6). % neutralization is reported. e. FACS isolation of S2Pecto or RBD-mFc-reactive B cells from pooled B cells of subject 3 and 4. Plots show CD19+IgDIgM population using gating strategy as in b, and antigen-reactive B cells were identified as in c. f. Lymphoblastoid cell line (LCL) supernatant neutralization. Neutralization of the WA1/2020 strain SARS-CoV-2 by supernatant collected from cell cultures of S2Pecto- or RBD-mFc-sorted memory B cells that had been stimulated in bulk in vitro on feeder layers expressing CD40L and secreting IL-21 and BAFF. The supernatants were tested in a ten-point dilution series in the FRNT, and % neutralization is reported. Values shown are the mean ± SD of technical duplicates.
Fig. 3.
Fig. 3.. Reactivity and functional activity of 389 human mAbs.
a. Structures of SARS-CoV-2 spike antigen. Top panel: S protein monomer of SARS-CoV-2 highlighting RBD (blue) and NTD (red) subdomains that were expressed as recombinant proteins. The ACE2 binding site on RBD is shown in orange. Known glycans are shown as light grey spheres (PDB 6VYB). Middle panel: the structure of trimeric SARS-CoV-2 spike with one RBD in the “head up” conformation. Bottom panel: structure (PDB 6M0J) of SARS-CoV-2 RBD (blue) and hACE2 (pink) highlighting differences between RBDs of SARS-CoV-2 and SARS-CoV (cyan). b. MAbs binding to each of four S proteins or subdomains. The figure shows a heatmap for binding of 389 mAbs expressed recombinantly, representing optical density (O.D.) values collected at 450 nm for each antigen (range 0.035 to 4.5). White indicates lack of detectable binding, while blue indicates binding, with darker blue indicating higher O.D. values. c. Screening test for neutralizing activity. Each mAb was tested by RTCA neutralization test (Extended Data Figs. 4,5) that was based on measurement of rapid cytopathic effect in Vero-furin cells caused by an authentic SARS-CoV-2 (strain WA1/2020) in a BSL3 laboratory. Green indicates full protection of cells (full neutralization), purple indicates partial protection of cells, (partial neutralization), and white indicates neutralizing activity was not detected. Based on both binding and neutralization, we grouped the mAbs into classes. Class I mAbs bind to both S2Pecto and SRBD proteins and are SARS-CoV-2 specific; Class II mAbs also bind to both S2Pecto and SRBD proteins and cross-react with SARS-CoV; Class III mAbs bind to both S2Pecto and SNTD proteins and are mostly SARS-CoV-2 specific; Class IV mAbs bind only to S2Pecto protein and are SARS-CoV-2 specific; Class V mAbs bind only to S2Pecto protein and cross-react with SARS-CoV. d. Heatmap showing usage of antibody variable gene segments for variable (V) and joining (J) genes. Of the 389 antibodies tested in (b) and (c) above, 324 were found to have unique sequences, and those unique sequences were analyzed for genetic features. The frequency counts are derived from the total number of unique sequences with the corresponding V and J genes. The V/J frequency counts then were transformed into a z-score by first subtracting the average frequency, then normalizing by the standard deviation of each subject. Red denotes more common gene usage, while blue denotes less common gene usage. e. CDR3 amino acid length distribution. The CDR3 of each sequence was determined using PyIR software. The amino acid length of each CDR3 was counted. The distribution of CDR3 amino acid lengths for heavy or light chains then was plotted as a histogram and fitted using kernel density estimation for the curves. f. Divergence from inferred germline gene sequences. The number of mutations of each mAb relative to the inferred germline variable gene was counted for each clone. These numbers then were transformed into percent values and plotted as violin plots. For the heavy chain values range from 81-100, with a median of 98, 25th quartile of 97.3 and 75th quartile of 99. For the light chain, values range from 87.5-100, with a median of 98.6, 25th quartile of 97.9 and 75th quartile of 99.3.
Fig. 4.
Fig. 4.. Neutralizing activity of potent mAbs against SARS-CoV-2 and SARS-CoV.
a. Dose-response neutralization of SARS-CoV-2 luciferase reporter virus by representative potently neutralizing mAbs that were identified by rapid RTCA screening assay. IC50 values are indicated for each mAb. Data shown are the mean of two technical replicates from one of two independent experiments, and error bars denote the standard deviation for each point. b. Neutralization of SARS-CoV-luciferase reporter virus by cross-reactive mAbs COV2-2678 and COV2-2514. IC50 values are indicated for each mAb, with “-” indicating mAbs that did not neutralize SARS-CoV. Data shown are the mean ± SD of two technical replicates from one of two independent experiments.

Update of

References

    1. Zhou P, et al. A pneumonia outbreak associated with a new coronavirus of probable bat origin. Nature 579, 270–273 (2020). - PMC - PubMed
    1. Zhu N, et al. A novel coronavirus from patients with pneumonia in China, 2019. N. Engl. J. Med 382, 727–733 (2020). - PMC - PubMed
    1. Sui J, et al. Potent neutralization of severe acute respiratory syndrome (SARS) coronavirus by a human mAb to S1 protein that blocks receptor association. Proc. Natl. Acad. Sci. USA 101, 2536–2541 (2004). - PMC - PubMed
    1. ter Meulen J, et al. Human monoclonal antibody as prophylaxis for SARS coronavirus infection in ferrets. Lancet 363, 2139–2141 (2004). - PMC - PubMed
    1. ter Meulen J, et al. Human monoclonal antibody combination against SARS coronavirus: synergy and coverage of escape mutants. PLoS Med. 3, e237 (2006). - PMC - PubMed

Methods References

    1. Mukherjee S, et al. Enhancing dengue virus maturation using a stable furin over-expressing cell line. Virology 497, 33–40 (2016). - PMC - PubMed
    1. Ohi M, Li Y, Cheng Y & Walz T Negative staining and image classification - Powerful tools in modern electron microscopy. Biol Proced Online 6, 23–34 (2004). - PMC - PubMed
    1. Mastronarde DN Automated electron microscope tomography using robust prediction of specimen movements. J Struct Biol 152, 36–51 (2005). - PubMed
    1. Punjani A, Rubinstein JL, Fleet DJ & Brubaker MA cryoSPARC: algorithms for rapid unsupervised cryo-EM structure determination. Nat Methods 14, 290–296 (2017). - PubMed
    1. Bepler T, Noble AJ, and Berger B Topaz-Denoise: general deep denoising models for cryoEM. . bioRxiv. (2019). - PMC - PubMed

Publication types

MeSH terms

Substances