. 2020 Oct;140(4):549-567.
doi: 10.1007/s00401-020-02187-x. Epub 2020 Jul 11.

Interleukin-1 promotes autoimmune neuroinflammation by suppressing endothelial heme oxygenase-1 at the blood-brain barrier

Affiliations

Interleukin-1 promotes autoimmune neuroinflammation by suppressing endothelial heme oxygenase-1 at the blood-brain barrier

Judith Hauptmann et al. Acta Neuropathol. 2020 Oct.

Abstract

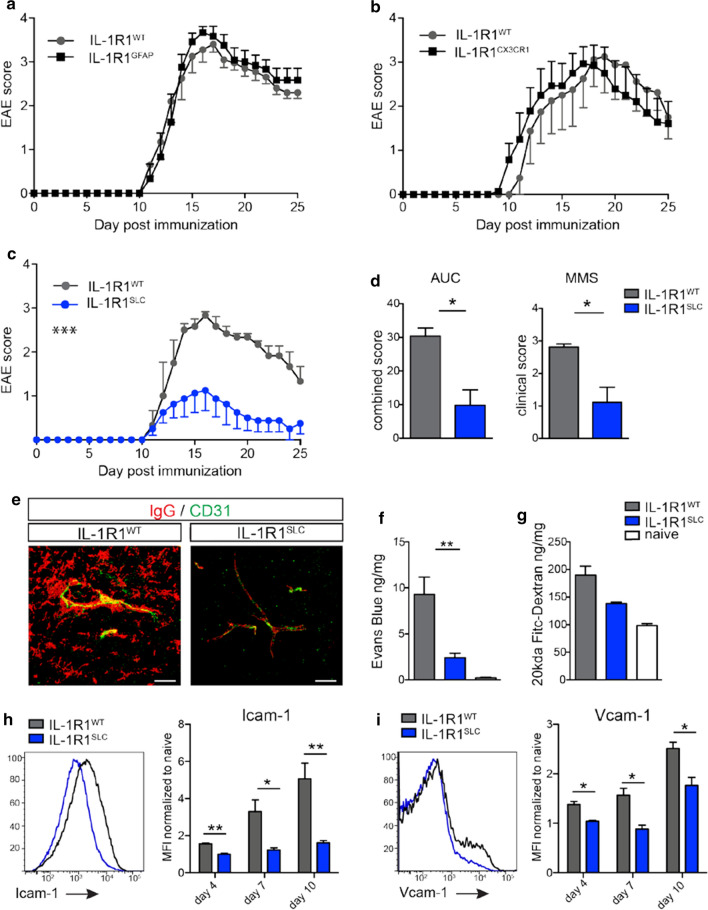
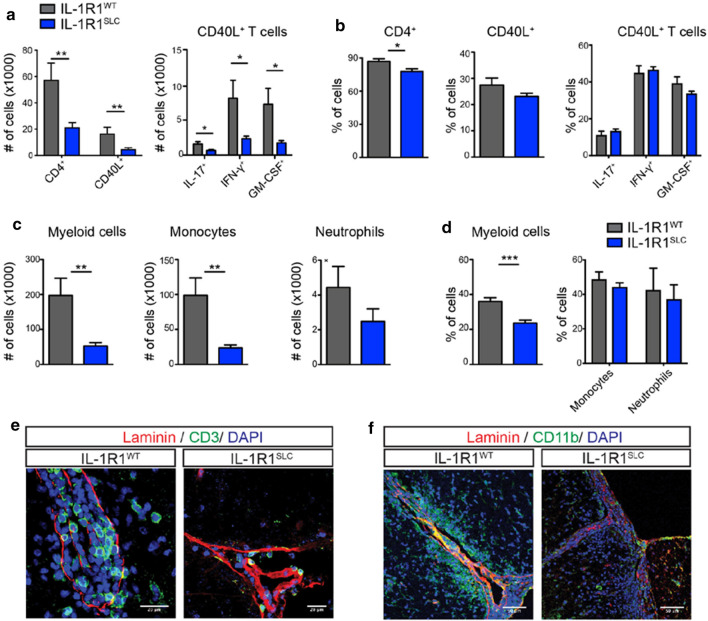
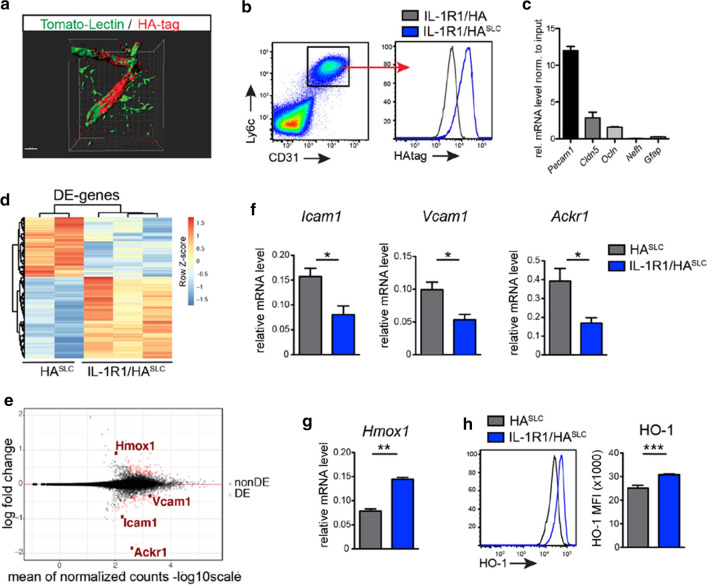
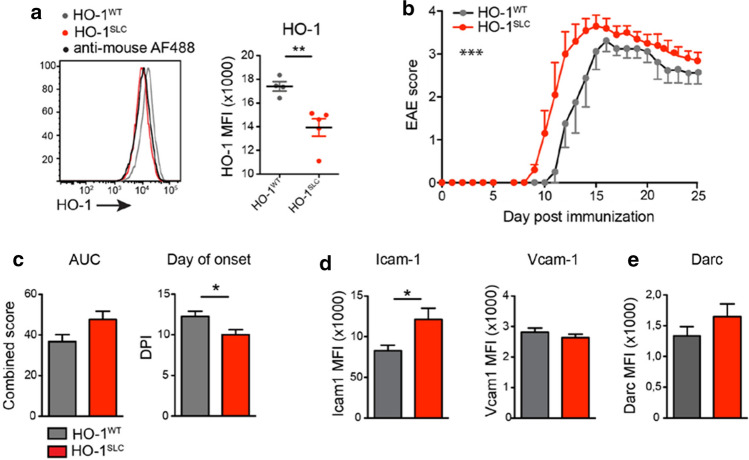
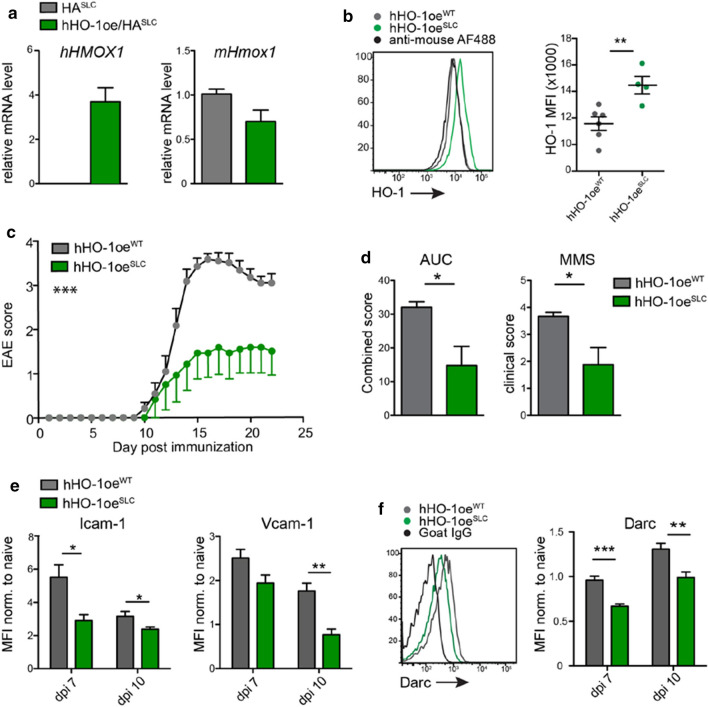
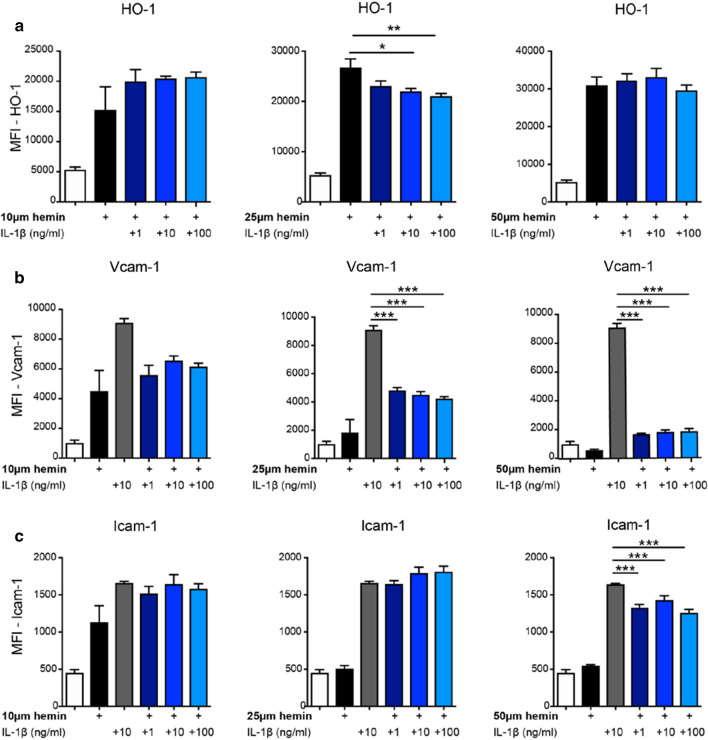
The proinflammatory cytokine interleukin 1 (IL-1) is crucially involved in the pathogenesis of multiple sclerosis (MS) and its animal model experimental autoimmune encephalomyelitis (EAE). Herein, we studied the role of IL-1 signaling in blood-brain barrier (BBB) endothelial cells (ECs), astrocytes and microglia for EAE development, using mice with the conditional deletion of its signaling receptor IL-1R1. We found that IL-1 signaling in microglia and astrocytes is redundant for the development of EAE, whereas the IL-1R1 deletion in BBB-ECs markedly ameliorated disease severity. IL-1 signaling in BBB-ECs upregulated the expression of the adhesion molecules Vcam-1, Icam-1 and the chemokine receptor Darc, all of which have been previously shown to promote CNS-specific inflammation. In contrast, IL-1R1 signaling suppressed the expression of the stress-responsive heme catabolizing enzyme heme oxygenase-1 (HO-1) in BBB-ECs, promoting disease progression via a mechanism associated with deregulated expression of the IL-1-responsive genes Vcam1, Icam1 and Ackr1 (Darc). Mechanistically, our data emphasize a functional crosstalk of BBB-EC IL-1 signaling and HO-1, controlling the transcription of downstream proinflammatory genes promoting the pathogenesis of autoimmune neuroinflammation.

Keywords: Autoimmunity; Blood–brain barrier; Experimental autoimmune encephalomyelitis (EAE); Heme oxygenase-1 (HO-1); Interleukin-1.


Figures

Fig. 1
Fig. 1
BBB-EC IL-1 signaling drives EAE and promotes Icam-1 and Vcam-1 expression. Disease course of IL-1R1WT and IL-1R1GFAP (a) or IL-1R1WT and IL-1R1CX3CR1 (b) mice. Data in a and b is representative for three individual experiments with at least n = 6 per group. Disease course (c) and area under the curve (AUC) and mean maximum score (MMS) (d) of IL-1R1SLC and IL-1R1WT mice. Data in c and d is representative for three individual experiments with at least n = 5 per group. e Representative 3D-images of immunohistochemistry staining from spinal cord sections at EAE onset stained for IgG (red) and CD31 (green). Indicated scale bar = 20 μm. f Extravasation of Evans Blue into spinal cords at EAE onset. Quantification was performed 6 h after intravenous injection of the dye. Data in f is representative for three individual experiments with at least n = 5 per group. g FITC-dextran (20 kDa) was applied intravenously into mice at day 10 post-immunization and tracer accumulation in spinal cord tissue was quantified 15 min later. Data in g is representative for three individual experiments with at least n = 4 per group. Flow cytometry analysis of CNS tissue at days 4, 7 and 10 post-immunization showing mean fluorescence intensity (MFI) of Icam-1 (h) and Vcam-1 (i) on BBB-ECs (gated as CD45CD11bCD31+Ly6c+ living single cells) normalized to naïve (unimmunized) mice. Data in h and i is representative for three individual experiments with at least n = 4 per group. Data in a–d and f–i is shown as mean ± SEM and analyzed using two-tailed unpaired Student’s t test (d, h, i) or two-way ANOVA (ac, fg). *p < 0.05, **p < 0.01, ***p < 0.001
Fig. 2
Fig. 2
BBB-EC IL-1 signaling promotes leukocyte migration. a, b Spinal cords of IL-1R1SLC and control mice at peak of EAE disease were isolated and single cell suspensions were subjected to MOG antigen recall assay. Flow cytometry analysis was quantified and shows the absolute cell number (a) and frequency (b) of the indicated T cell populations. Note that CD40L+ cells are considered to be specific for the MOG antigen. c, d Single cell suspensions from spinal cords of peak EAE mice were analyzed by flow cytometry for CNS-infiltrating myeloid cells. The quantification of this analysis shows the absolute cell number (c) and frequency (d) of living CD45+CD11bhigh myeloid cells, further gated on Ly6chigh monocytes and Ly6c+Ly6G+ neutrophils. Data in ad is representative for at least three individual experiments with a minimum of n = 5 per group. Data is shown as mean ± SEM and analyzed using two-tailed unpaired Student’s t test. *p < 0.05, **p < 0.01, ***p < 0.001. Immunofluorescence analysis of spinal cord tissue at EAE onset showing CD3+ T cells (e) and CD11b+ myeloid cells (f) infiltrating the CNS parenchyma. Spinal cord sections were stained for CD3 (green, in e, scale bar = 20 μm), CD11b (green, in f, scale bar = 50 μm) and DAPI (blue) together with pan-laminin staining (red)
Fig. 3
Fig. 3
IL-1R1-deficient BBB-ECs show increased HO-1 expression before onset of EAE. a 3D reconstruction of confocal images from spinal cord sections of IL-1R1/HASLC mice stained for HA-tag (red) and Lectin (green). Images were generated with Imaris software. b Flow cytometry analysis of HA-tag expression by BBB-ECs (gated as CD45CD11bCD31+Ly6c+ living single cells) from mice of the indicated genotypes. c Quantification of the indicated genes by qRT-PCR of immunoprecipitated (IP) mRNA from spinal cord tissue of HASLC mice. Expression levels are shown as log fold change normalized to input fraction. Data is representative for two individual experiments with at least n = 3 per group and shown as mean ± SEM. d Heat map of RNA sequencing data comparing IPs obtained from spinal cords of HASLC (n = 2) and IL-1R1/HASLC (n = 3) mice at day 10 after EAE induction. Each column represents one individual mouse. Color-coded z-scores for the regularized logarithm (rlog) transformed expression values are displayed. e MA-plot displaying expression change (in log2 scale) versus mean expression values. Each dot represents one gene with differentially expressed (DE) genes in red. f, g qRT-PCR validation showing top downregulated genes Icam1, Vcam1, Ackr1 (f) and the top upregulated gene Hmox1 (g), as obtained from the RNA sequencing analysis. Data in f and g is representative for two individual experiments with at least n = 3 per group. h Flow cytometry analysis of BBB-ECs showing mean fluorescence intensity (MFI) of HO-1. Data in h is representative for two individual experiments with at least n = 4 per group. Data in f–h is shown as mean ± SEM and analyzed using two-tailed unpaired Student’s t test. *p < 0.05, **p < 0.01, ***p < 0.001
Fig. 4
Fig. 4
Increased EAE severity in mice lacking HO-1 expression in BBB-ECs. a Flow cytometry analysis from CNS tissue of the indicated mice afflicted with EAE, showing mean fluorescence intensity (MFI) of HO-1 in BBB-ECs (gated as CD45CD11bCD31+Ly6c+ living single cells) at day 10 post-immunization. Data are representative for two individual experiments with at least n = 4 per group. b, c The indicated mice were immunized for EAE induction and the disease course monitored (b) as well as the area under the curve and day of onset quantified (c). Data in ac is representative for two individual experiments with at least n = 4 per group. d, e Quantification of flow cytometry analysis from CNS tissue showing mean fluorescence intensity (MFI) of Icam-1 and Vcam-1 (d) and Darc (e) expression in BBB-ECs at day 10 post-immunization. Data in d and e is representative for three individual experiments with at least n = 3 per group. Data in ae is shown as mean ± SEM. Data in a, ce was analyzed using two-tailed unpaired Student’s t test. Data in b was analyzed using two-way ANOVA. *p < 0.05, **p < 0.01, ***p < 0.001
Fig. 5
Fig. 5
HO-1 overexpression by BBB-ECs reduces the expression of IL-1β target genes and EAE severity. a qRT-PCR for human hHMOX1 (left) and mouse mHmox1 (right) from RNA immunoprecipitated from spinal cords of the indicated mice (n = 3 per group). b Flow cytometry analysis of CNS tissue from EAE mice showing mean fluorescence intensity (MFI) of HO-1 expression by BBB-ECs (gated as CD45CD11bCD31+Ly6c+ living single cells) at day 10 post-immunization. Data is representative for two experiments with at least n = 4 per group. c, d The indicated mice were immunized for EAE induction and the disease course monitored (c) as well as the area under the curve and mean maximum score quantified (d). Data in c and d is representative for two individual experiments with n = 6 per group. e, f Flow cytometry analysis of CNS tissue showing mean fluorescence intensity (MFI) of Icam-1 and Vcam-1 (e) and Darc (f) expression by BBB-ECs at day 10 post-immunization. Data in e and f is representative for three individual experiments with n = 4 per group. Data in af is shown as mean ± SEM. Data in a, b, df was analyzed using two-tailed unpaired Student’s t test. Data in c was analyzed using two-way ANOVA. *p < 0.05, **p < 0.01, ***p < 0.001
Fig. 6
Fig. 6
Molecular crosstalk of HO-1 and IL-1β signaling pathways. b.End3 cells were exposed to hemin, IL-1β or their combination at the indicated concentrations for 16 h. Flow cytometry analysis of stimulated cells was quantified and shows the mean fluorescence intensity (MFI) of HO-1 (a) Vcam-1 (b) and Icam-1 (c) expression. Data in ac is representative for two individual experiments with at least n = 5 per group, and is shown as mean ± SEM and analyzed by one-way ANOVA with Bonferroni’s post hoc test. *p < 0.05, **p < 0.01, ***p < 0.001

References

    1. Abadier M, Haghayegh Jahromi N, Cardoso Alves L, Boscacci R, Vestweber D, Barnum S, et al. Cell surface levels of endothelial ICAM-1 influence the transcellular or paracellular T-cell diapedesis across the blood–brain barrier. Eur J Immunol. 2015;45:1043–1058. doi: 10.1002/eji.201445125. - DOI - PubMed
    1. Abdulaal WH, Walker CR, Costello R, Redondo-Castro E, Mufazalov IA, Papaemmanouil A, et al. Characterization of a conditional interleukin-1 receptor 1 mouse mutant using the Cre/LoxP system. Eur J Immunol. 2016;46:912–918. doi: 10.1002/eji.201546075. - DOI - PMC - PubMed
    1. Abraham NG. Therapeutic applications of human heme oxygenase gene transfer and gene therapy. Curr Pharm Des. 2003;9:2513–2524. doi: 10.2174/1381612033453758. - DOI - PubMed
    1. Alam J, Stewart D, Touchard C, Boinapally S, Choi AM, Cook JL. Nrf2, a Cap'n'Collar transcription factor, regulates induction of the heme oxygenase-1 gene. J Biol Chem. 1999;274:26071–26078. doi: 10.1074/jbc.274.37.26071. - DOI - PubMed
    1. Alexa A, Rahnenfuhrer J, Lengauer T. Improved scoring of functional groups from gene expression data by decorrelating GO graph structure. Bioinformatics (Oxford, England) 2006;22:1600–1607. doi: 10.1093/bioinformatics/btl140. - DOI - PubMed

Publication types

MeSH terms