. 2020 Aug 20;48(14):7924-7943.
doi: 10.1093/nar/gkaa592.

Human GTPBP5 (MTG2) fuels mitoribosome large subunit maturation by facilitating 16S rRNA methylation

Affiliations

Human GTPBP5 (MTG2) fuels mitoribosome large subunit maturation by facilitating 16S rRNA methylation

Priyanka Maiti et al. Nucleic Acids Res. .

Abstract

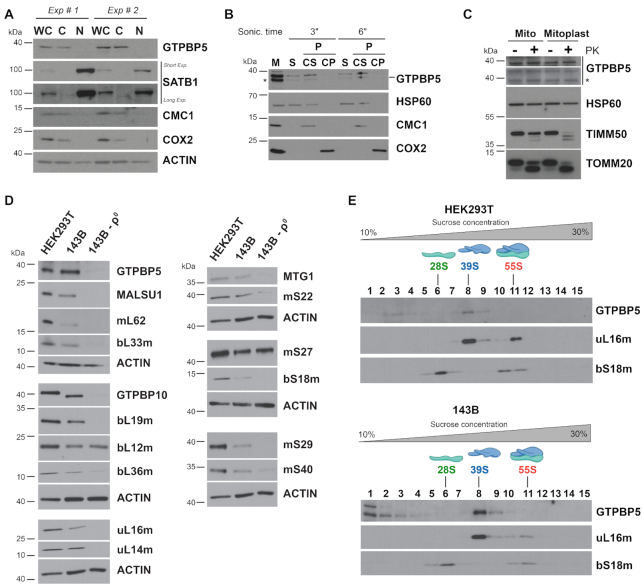
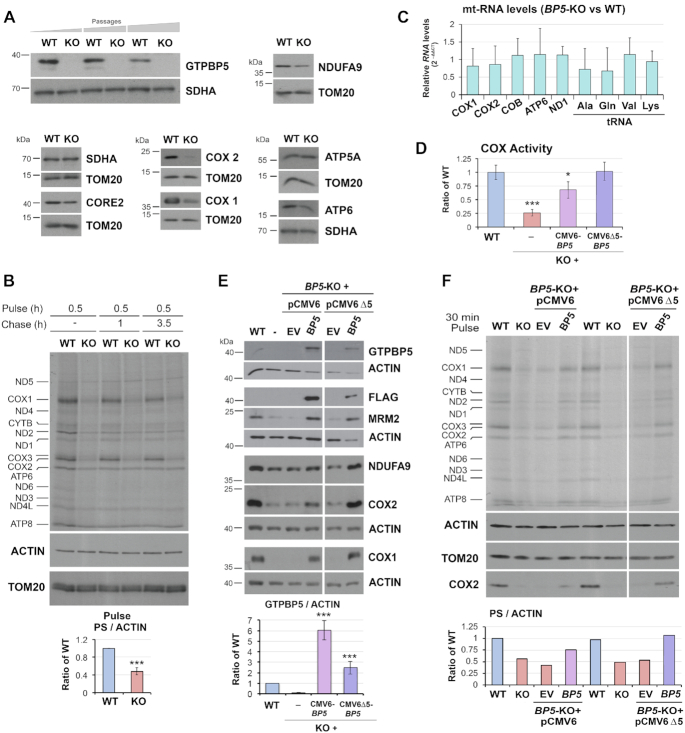
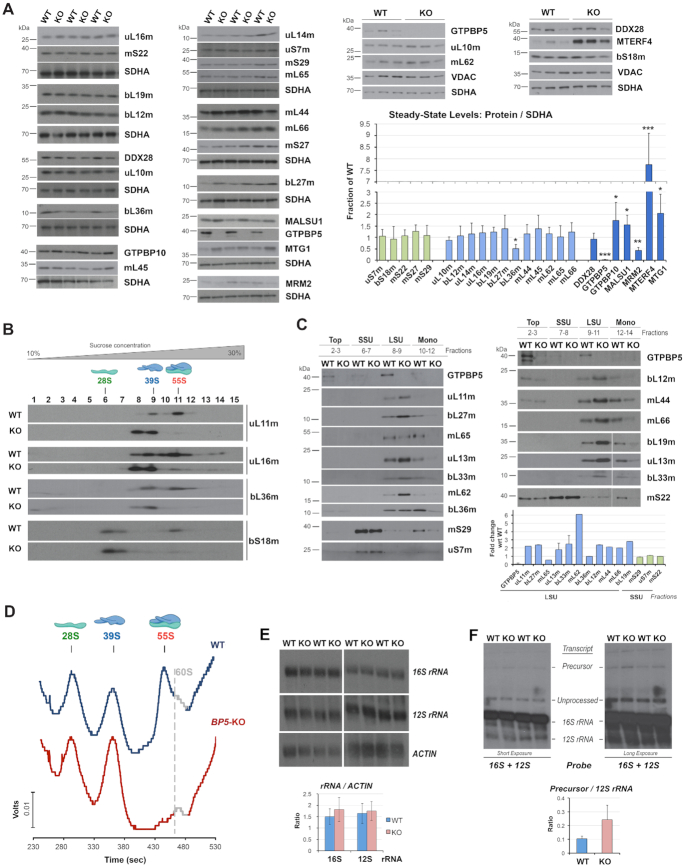
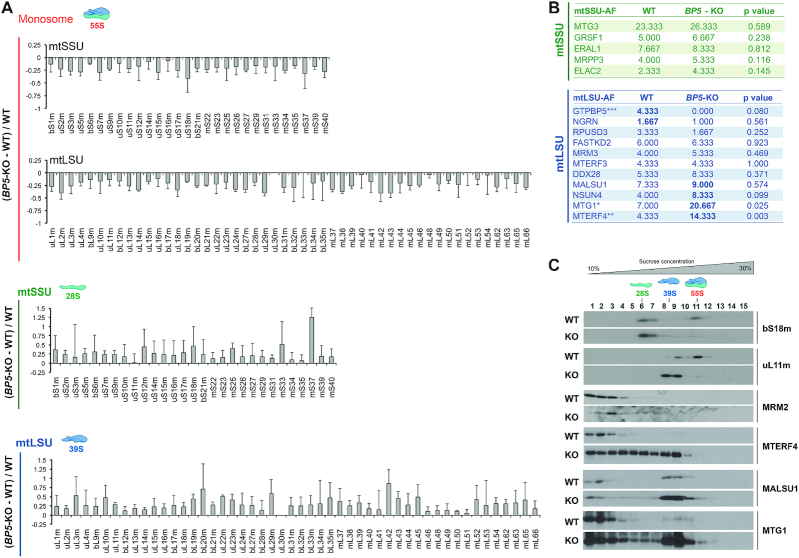
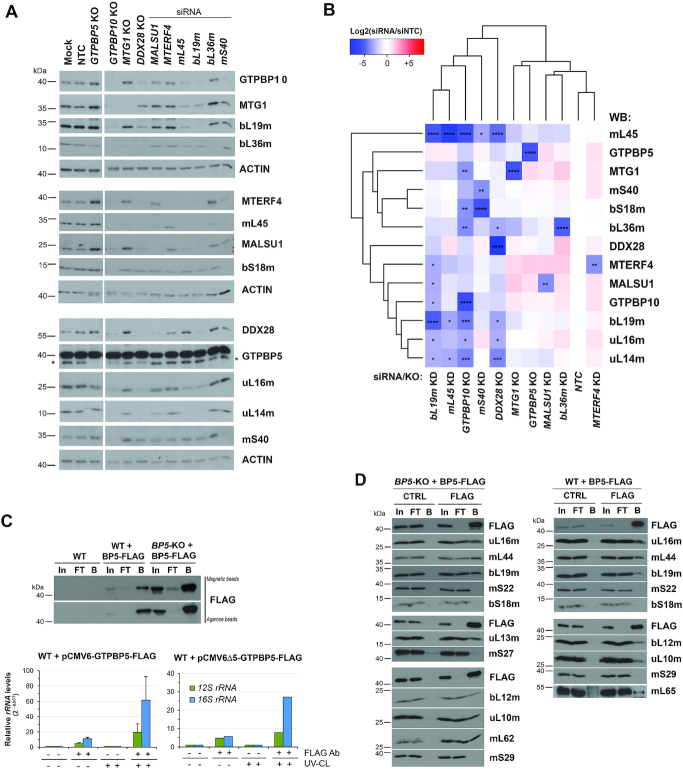
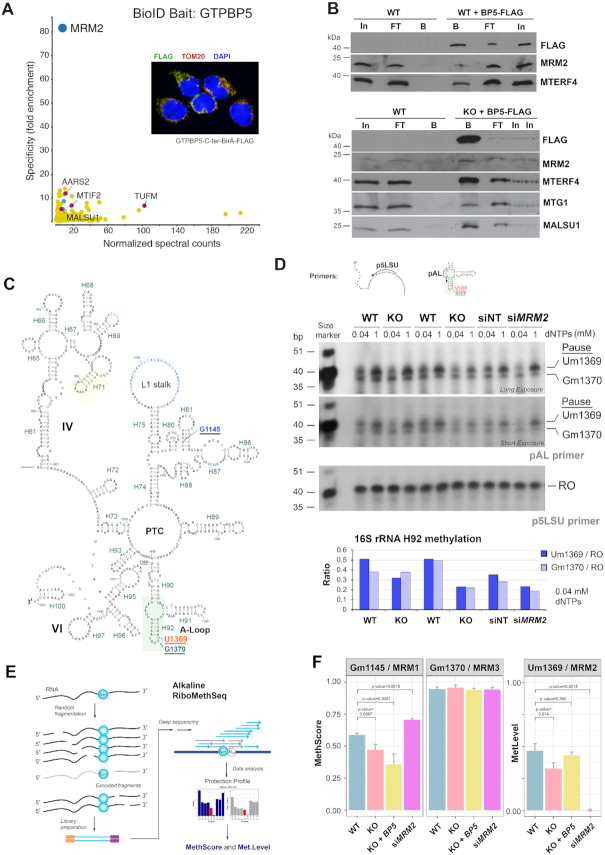
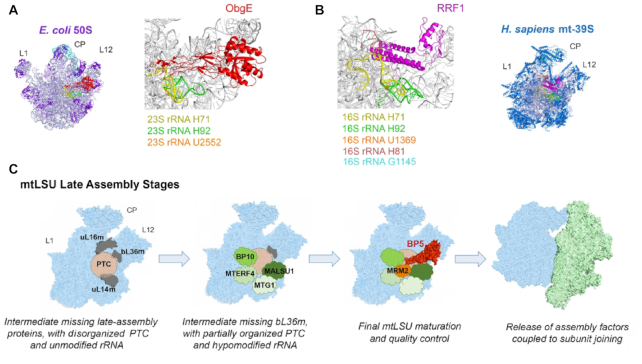
Biogenesis of mammalian mitochondrial ribosomes (mitoribosomes) involves several conserved small GTPases. Here, we report that the Obg family protein GTPBP5 or MTG2 is a mitochondrial protein whose absence in a TALEN-induced HEK293T knockout (KO) cell line leads to severely decreased levels of the 55S monosome and attenuated mitochondrial protein synthesis. We show that a fraction of GTPBP5 co-sediments with the large mitoribosome subunit (mtLSU), and crosslinks specifically with the 16S rRNA, and several mtLSU proteins and assembly factors. Notably, the latter group includes MTERF4, involved in monosome assembly, and MRM2, the methyltransferase that catalyzes the modification of the 16S mt-rRNA A-loop U1369 residue. The GTPBP5 interaction with MRM2 was also detected using the proximity-dependent biotinylation (BioID) assay. In GTPBP5-KO mitochondria, the mtLSU lacks bL36m, accumulates an excess of the assembly factors MTG1, GTPBP10, MALSU1 and MTERF4, and contains hypomethylated 16S rRNA. We propose that GTPBP5 primarily fuels proper mtLSU maturation by securing efficient methylation of two 16S rRNA residues, and ultimately serves to coordinate subunit joining through the release of late-stage mtLSU assembly factors. In this way, GTPBP5 provides an ultimate quality control checkpoint function during mtLSU assembly that minimizes premature subunit joining to ensure the assembly of the mature 55S monosome.


Figures

Figure 1.
Figure 1.
GTPBP5 is a mitochondrial protein that sediments with the mitoribosome large subunit (mtLSU). (A) Immunoblot analyses of GTPBP5 levels in HEK293T whole-cell lysate (WCL), cytoplasmic (C) and nuclear (N) fractions. Antibodies against mitochondrial proteins CMC1 and COX2 and nuclear protein SATB1 were used as controls. (B) Mitochondria (M) isolated from HEK293T cells were first fractionated into soluble (S) and membrane-bound (P) proteins by brief sonication and centrifugation. The pellet was submitted to alkaline carbonate extraction (pH: 11.5) to allow the separation of the extrinsic proteins present in the supernatant (CS) from the intrinsic proteins in the pellet (CP). Equivalent volumes of each fraction were analyzed by immunoblotting using antibodies against GTPBP5, the matrix-soluble protein HSP60, the extrinsic membrane-associated protein CMC1, and the inner membrane intrinsic protein COX2. In the anti-GTPBP5 immunoblot, the asterisks mark the GTPBP5 protein. (C) Proteinase K protection assay in mitochondria (Mt) and mitoplasts (Mp) prepared by hypotonic swelling of mitochondria. The samples were analyzed by immunoblotting using antibodies against GTPBP5, the matrix protein HSP60, the inner membrane protein TIM50, and the outer membrane protein TOM20. In the anti-GTPBP5 immunoblot, the asterisk marks the GTPBP5 protein. (D) Immunoblot analyses of the steady-state levels of mitoribosome LSU, SSU proteins and assembly factors in whole-cell extracts from HEK293T, 143B and 143B-206 rho00) cells. ACTIN was used as a loading control. (E) Sucrose gradient sedimentation analyses of GTPBP5 and mitoribosomal proteins in mitochondrial extracts from wild-type HEK293T or 143B mitochondria prepared in the presence of the 20 mM MgCl2. The fractions were analyzed by immunoblotting using antibodies against the indicated proteins.
Figure 2.
Figure 2.
GTPBP5 is required for efficient mitochondrial translation and OXPHOS function in HEK293T cells. (A) Immunoblot analysis of the steady‐state levels of GTPBP5 and OXPHOS complex subunits in HEK293T (WT), and GTPBP5-knockout (KO) cell lines. For GTPBP5, KO cells collected at three different passages are presented. NDUFA9 is a subunit of complex I, CORE2 of complex III, COX1 and COX2 of complex IV, ATP5α and ATP6 of the F1Fo‐ATP synthase of complex V. Immunoblotting for SDHA and TOM20 are used as loading controls. (B) Metabolic labeling with 35S-methionine of newly synthesized mitochondrial translation products in whole cells from the indicated lines during a 30-min pulse in the presence of emetine to inhibit cytoplasmic protein synthesis. Immunoblotting for ACTIN and TOM20 were used as loading controls. Newly synthesized polypeptides are identified on the left. Please see below in panel 2F for the description of the quantification. (C) Quantitative PCR (qPCR) analyses of the steady-state levels of several mtDNA-encoded mRNAs (COX1, COX2, COB, ATP6, and ND1) and tRNAs (Ala, Gln, Val, and Lys) in WT and the GTPBP5-KO cells. Data represent the mean ± SEM from four WT and GTPBP5-KO samples. t-test: * P <0.05, **P <0.01; ***P <0.001. (D) Enzymatic activity of CIV or cytochrome c oxidase (COX) normalized by whole-cell protein concentration and expressed as a fraction of WT. GTPBP5-KO (KO) cells transfected with an empty vector (EV) or a construct expressing FLAG-tagged GTPBP5. GTPBP5-FLAG was expressed under the control of either standard human cytomegalovirus (CMV) intermediate early enhancer/promoter (plasmid pCMV6) or an attenuated CMV promoter (pCMV6Δ5), generated by a deletion that eliminates a large proportion (4/5) of the transcription factor binding sites (25). Data represent the mean ± SD of three independent repetitions; t-test: * P < 0.05, **P < 0.01; ***P < 0.001. (E) Immunoblot analysis of the steady‐state levels of the indicated proteins in HEK293T wild-type (WT) and GTPBP5-KO (KO) cells transfected with an empty vector (EV) or a construct expressing FLAG-tagged GTPBP5 (pCMV6 or pCMV6Δ5). Actin was used as a loading control. Data represent the mean ± SD of four independent repetitions; t-test: * P < 0.05, **P < 0.01; ***P < 0.001. (F) Metabolic labeling as in panel (B) using GTPBP5-KO (KO) cells reconstituted with a construct expressing FLAG-tagged GTPBP5 under the control of either a standard CMV promoter (pCMV6) or a truncated promoter (pCMV6Δ5). In panels (B) and (F), the overall 35S signal of the pulses was quantified by densitometric integration of the lines of the total signal of the mitochondrial protein synthesis (PS) of each sample using the histogram panel of Adobe Photoshop, normalized by the signal of ACTIN immunobloting and plotted as the ratio of the WT in the bottom graphs. For the graph in panel (B), data represent the mean ± SD of only the pulse phase of mitochondrial protein synthesis (PS) of three independent repetitions; t-test: * P < 0.05, **P < 0.01; ***P < 0.001.
Figure 3.
Figure 3.
GTPBP5 is essential for the formation of monosomes. (A) Immunoblot analysis of the steady‐state levels of mitoribosome proteins and assembly factors in mitochondria isolated from HEK293T (WT) and GTPBP5-KO (KO) cells. SDHA or VDAC were used as loading controls. The right panel shows the densitometry values normalized by the signal of SDHA and expressed relative to the WT. Data represent the mean ± SD of at least three WT and GTPBP5-KO samples; t-test: *P < 0.05, **P < 0.01, ***P < 0.001, ****P < 0.0001. (B) Sucrose gradient sedimentation analyses of mitoribosome mtSSU (bS18m) and mtLSU (uL11m, uL16m and bL36m) markers in mitochondria prepared from HEK293T (WT) or GTPBP5-KO (KO) cells. (C) Immunoblot analysis of MRP levels in the sucrose gradients fractions presented in panel (B) in which the monosome, mtLSU, mtSSU, and unassembled subunits (top) peak. Equal volumes of fractions corresponding to each cell line were loaded. The lower panel shows the densitometry values of the proteins in either the mtLSU or mtSSU fraction and expressed as fold change relative to the WT. Data represent only one set of each protein and the mean and range of two sets of GTPBP5, uL13m and bL33m. (D) Continuous RNA profile (absorbance at 254 nm) obtained during the collection of the gradient fractions presented in panel (B), using a Brandel fractionation system and Brandel Peak Chart Software. The fractions where the 28S mtSSU, 39S mtLSU, and 55S monosome sediment are indicated. The presence of traces of contaminating 60S cytoplasmic ribosomes is marked in grey. (E, F) Northern blot analyses of the steady-state levels of mitochondrial rRNAs in WT or the GTPBP5-KO cells. Multiple experimental repetitions and X-ray film exposures are presented to display the steady-state levels of 12S-16S precursor transcript, 12S, and 16S unprocessed and fully processed transcripts. The lower panels show the densitometry values normalized by the signal of ACTIN mRNA or the 12S rRNA. Data represent the mean ± SD of three independent repetitions.
Figure 4.
Figure 4.
The absence of GTPBP5 alters the abundance and composition of the mtLSU and mtSSU proteome. (A) Identity and abundance of mitoribosome proteins and assembly factors that accumulate in mitoribosome particles from WT and GTPBP5-KO HEK293T mitochondrial extracts, following their accumulation in the fractions from sucrose gradient sedimentation studies presented in Figure 3B. The proteins in the fractions in which the mtSSU, mtLSU and monosome peak, were precipitated using methanol-chloroform and identified by mass spectrometry. The bar graphs represent the total unique spectrum count difference between GTPBP5-KO and WT normalized by the WT count. Results represent the average ± SD of three independent repetitions. Mitoribosome proteins are identified at the bottom. (B) Accumulation of mitoribosome SSU and LSU assembly factors in the fractions corresponding to each subunit, analyzed by mass spectrometry in panel (A). Data represent the average ± SD of total unique spectrum counts in WT and GTPBP5-KO samples from three independent repetitions. t-test: *P < 0.05; **P < 0.01, ***P < 0.001 (C) Sucrose gradient sedimentation analyses of mitoribosome LSU assembly factors in mitochondria prepared from HEK293T (WT) or GTPBP5-KO (KO) cells.
Figure 5.
Figure 5.
GTPBP5 directly interacts with the 16S rRNA and mtLSU proteins. (A, B) Knockdown (KD) of mitoribosome assembly factors and mitoribosome subunits in HEK293T cells using siRNAs for 3 days, verified by immunoblotting of whole-cell lysates. Lysates from HEK293T cells KO for GTPBP5, GTPBP10, MTG1, or DDX28 were also included in the study. (A) Representative image of immunoblot analysis of the steady-state levels of mitoribosome proteins after the silencing of target proteins. NTC is a non-targeting silencing control, and Mock consisted of transfection reagent only. Antibodies are listed on the right side, and ACTIN was used as a loading control. In the anti-GTPBP5 immunoblot, the asterisk marks the GTPBP5 protein. (B) Following analysis in panel (A), the densitometric data obtained on the abundance of mitoribosome proteins and assembly factors accumulated after silencing or knocking out of each target protein was used for cluster analysis (see Materials and Methods). The heat map, generated with the R studio software, represents the average value of log2 scale of the ratio of the protein levels in knockdown or knockout samples to control (NTC) in three independent repetitions of immunoblotting analyses. 2-way ANOVA was performed followed by a Dunnett's multiple comparisons test: *P < 0.05; **P < 0.01; ***P < 0.001; ****P < 0.0001. (C) qPCR analyses of reverse-transcribed control or GTPBP5-FLAG co-immunopurified RNAs after 4-thiouridine treatment and either UV-mediated protein-RNA crosslinking (UV-CL) or not crosslinking. GTPBP5-FLAG was expressed under the control of either a standard CMV6 promoter or an attenuated CMV promoter (pCMV6Δ5) (25). In, input. FT, flow-through or unbound. B is bound. (D) Co-immunoprecipitation analysis of GTPBP5-FLAG and interacting mitoribosome proteins and assembly factors in mitochondrial lysates prepared in the presence of 1% digitonin, by using anti-FLAG agarose beads (FLAG) or plain beads as control (CTRL). In, input. FT, flow-through or unbound. B is bound.
Figure 6.
Figure 6.
GTPBP5 interacts physically and functionally with the 16S rRNA methyltransferase MRM2. (A) Prey specificity graph for BioID proximity interactome of GTPBP5 protein, where the prey specificity was determined as the relative enrichment of interaction of individual preys and GTPBP5, compared to their interaction with 100 other mitochondrial baits. The most significant prey is highlighted in dark blue. Enriched mitochondrial ribosome assembly and translation factors are highlighted in red, and enriched ribosomal proteins of the mtLSU are depicted in light blue. The inset represents an immunofluorescence labeling of cells that express the fusion protein using antibodies against FLAG and TOM20 (mitochondrial marker), and DAPI staining of the nucleus. (B) Co-immunoprecipitation analysis of GTPBP5-FLAG and the highly ranked GTPBP5 BioID hits as well as additional native interacting mtLSU assembly factors with Flag Tag (D6W5B) Rabbit mAb-conjugated sepharose beads. Mitochondrial extracts prepared from WT cells not expressing GTPBP5-FLAG were used as control. Two independent experiments are presented. In, input. FT, flow-through or unbound. B is bound. (C) Diagram of the secondary structure of a portion of the human mitochondrial 16S rRNA deduced directly from the reported cryo-EM structure (41). Unbuilt regions are marked in blue lettering, rRNA in Roman numerals, helices and nucleotide numbering in green, modified residues in the A-loop are underlined, and Um1369 is marked in red. (D) Primer extension to measure levels of the A-loop methyl modifications of human mitochondrial 16S rRNA residues at U1369 and G1370, using the primers pAL that detect the modifications, or p5LSU that is used to standardize the loading of 16S rRNA as previously reported (42). Total RNA preparations from HEK293T (WT) or GTPBP5-KO (KO) cells were used in the assay. RNA samples from WT cells treated for 3 days with non-targeting siRNA (siNT) or siMRM2 were used as controls. Radiotracer-labeled primers were added separately in an RT- primer extension reaction using two concentrations of dNTPs as indicated. Reaction products were separated on a 12% denaturing urea-polyacrylamide gel and subjected to autoradiography. Images after two exposure times are presented. The specific pausing sites upon extension of the pAL primer at nucleotide positions Um1369 and Gm1370 are marked. RO is the runoff product resulting from extending the p5LSU primer. In the bottom graphs, Um1369 and Gm1370 signals were quantified by densitometric integration of the lines using the histogram panel of Adobe Photoshop, normalized by the signal of RO signal and plotted. (E) General overview of the Illumina-based RiboMethSeq method for mapping of 2′-O-Me residues in RNA that was implemented to analyze the samples as reported (32). In this approach, alkaline fragmentation of RNA excludes RNA fragments ending with 2′-O-Me and, subsequently, also starting with N + 1 orN + 2 nucleotide. After conversion to the sequencing library these fragments become underrepresented (grey arrows). When sequencing reads are mapped to the reference sequence, 5′-end and 3′-end coverage show a characteristic drop, resulting from protection (see Supplemental Figure S5). These profiles are subsequently merged (with –1 nt or –2 nt backshift for the 5′-end coverage) to obtain a cumulated profile used for calculation of RiboMethSeq scores (43). (F) RiboMethSeq analysis results showing the methylation scores at the sites G1145, U1369, G1370 for WT, GTPBP5-KO, GTPBP5-KO reconstituted with GTPBP5 and silencing of MRM2 (siMRM2). For U1369, we used siMRM2 as unmodified reference to normalize the data and calculate methylation levels. The error bar represents +/- SD values from three replicates of WT, GTPBP5-KO overexpressing GTPBP5, and siMRM2, and four replicates of GTPBP5-KO. The P-values are calculated by t-test (two-tailed/equal variance): *P < 0.05; **P < 0.01, ***P < 0.001.
Figure 7.
Figure 7.
Model of GTPBP5 action during mtLSU biogenesis. (A) Interaction of E. coli ObgE with the 50S LSU (PDB 4CSU) (46). (B) Interaction of the human 39S mtLSU (PDB 6NU2) with mitochondrial ribosome recycling factor RRF1 (48). (C) Model depicting the mtLSU late-stages of assembly and the roles broadly performed by GTPBP5 and additional assembly factors in mtLSU maturation (see text for extended explanation). CP, central protuberance; L1 and L12 mark the position of the corresponding stalks. The surface representation of the structural profile of the human mitoribosome (PDB 3J9M) (1) and the structure of the ObgE homolog of GTPBP5 (PDB 4CSU) (46) were used. Figures in panels A and B were prepared using PYMOL software.

Similar articles

Cited by

References

    1. Amunts A., Brown A., Toots J., Scheres S.H.W., Ramakrishnan V.. The structure of the human mitochondrial ribosome. Science. 2015; 348:95–98. - PMC - PubMed
    1. Greber B.J., Bieri P., Leibundgut M., Leitner A., Aebersold R., Boehringer D., Ban N.. Ribosome. The complete structure of the 55S mammalian mitochondrial ribosome. Science. 2015; 348:303–308. - PubMed
    1. De Silva D., Fontanesi F., Barrientos A.. The DEAD-Box protein Mrh4 functions in the assembly of the mitochondrial large ribosomal subunit. Cell Metab. 2013; 18:712–725. - PMC - PubMed
    1. Maiti P., Kim H.J., Tu Y.T., Barrientos A.. Human GTPBP10 is required for mitoribosome maturation. Nucleic Acids Res. 2018; 13:11423–11437. - PMC - PubMed
    1. Zeng R., Smith E., Barrientos A.. Yeast mitoribosome large subunit assembly proceeds by hierarchical incorporation of protein clusters and modules on the inner membrane. Cell Metab. 2018; 27:645–656. - PMC - PubMed

Publication types

MeSH terms