Observational Study
. 2020 Nov;159(5):1839-1852.
doi: 10.1053/j.gastro.2020.07.005. Epub 2020 Jul 9.

Intestinal Virome Signature Associated With Severity of Nonalcoholic Fatty Liver Disease

Affiliations
Observational Study

Intestinal Virome Signature Associated With Severity of Nonalcoholic Fatty Liver Disease

Sonja Lang et al. Gastroenterology. 2020 Nov.

Abstract

Background & aims: Alterations in the gut microbiome have been associated with the severity of nonalcoholic fatty liver disease (NAFLD). Previous studies focused exclusively on the bacteria in the microbiome; we investigated changes in the viral microbiome (virome) in patients with NAFLD.

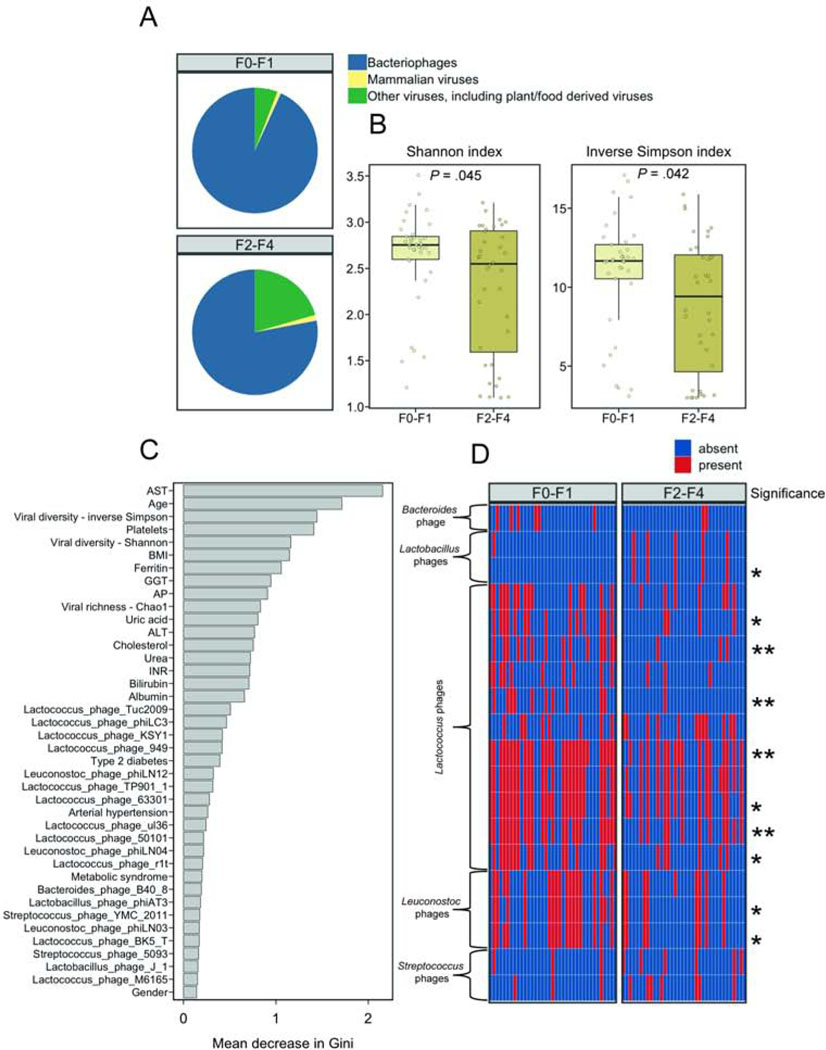
Methods: In a prospective, cross-sectional, observational study, we extracted RNA and DNA virus-like particles from fecal samples from 73 patients with NAFLD: 29 patients had an NAFLD Activity Score (NAS) of 0-4, 44 patients had an NAS of 5-8 or liver cirrhosis (LCI), 37 patients had F0-F1 fibrosis, and 36 patients had F2-F4 fibrosis. As controls, 9 individuals without liver disease and 13 patients with mild primary biliary cholangitis were included in the analysis. We performed shotgun metagenomic sequencing of virus-like particles.

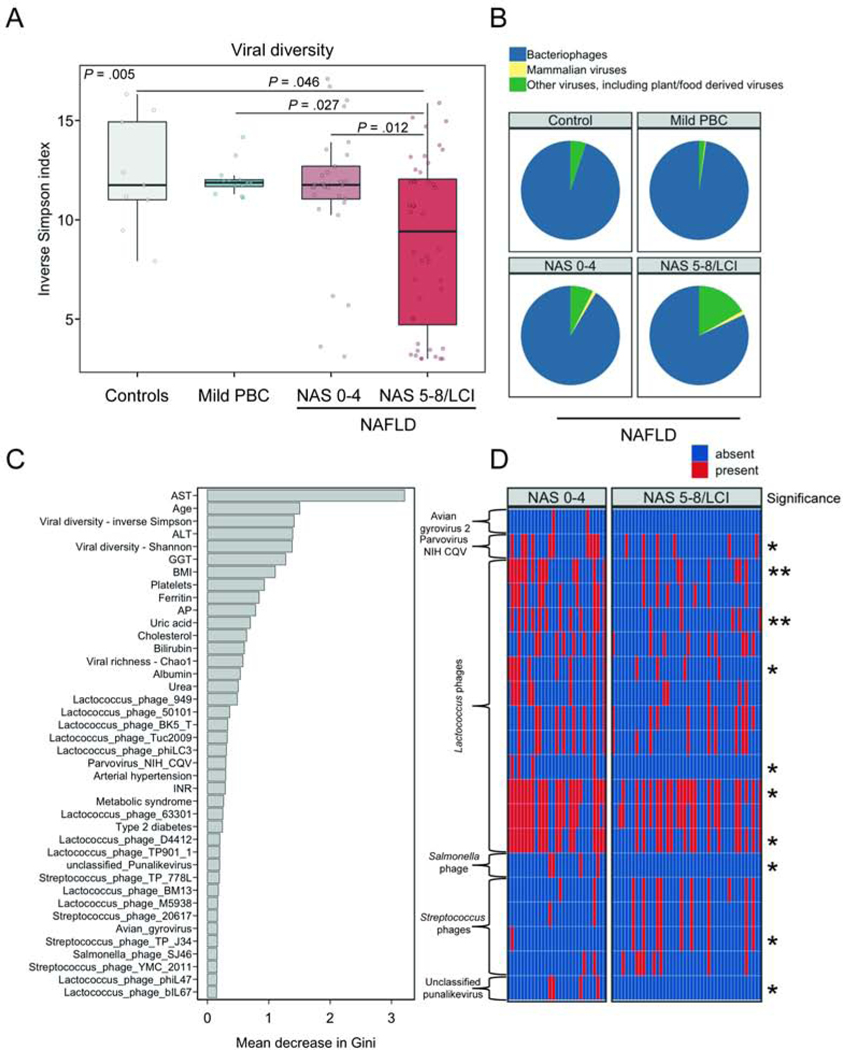
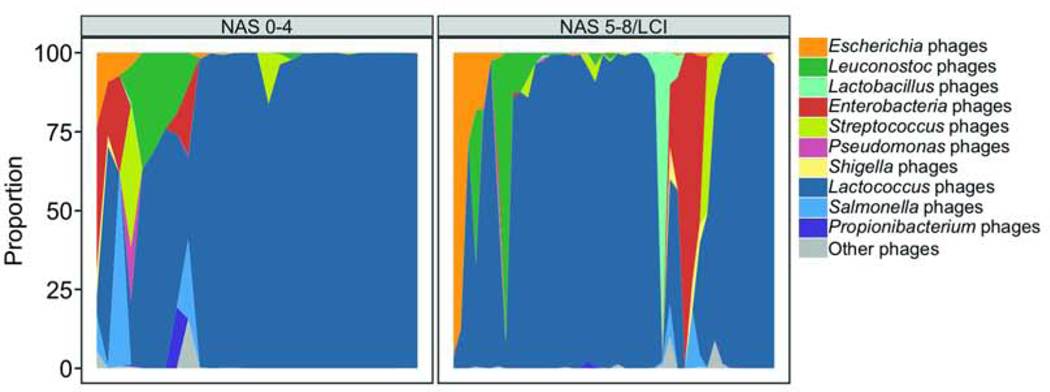
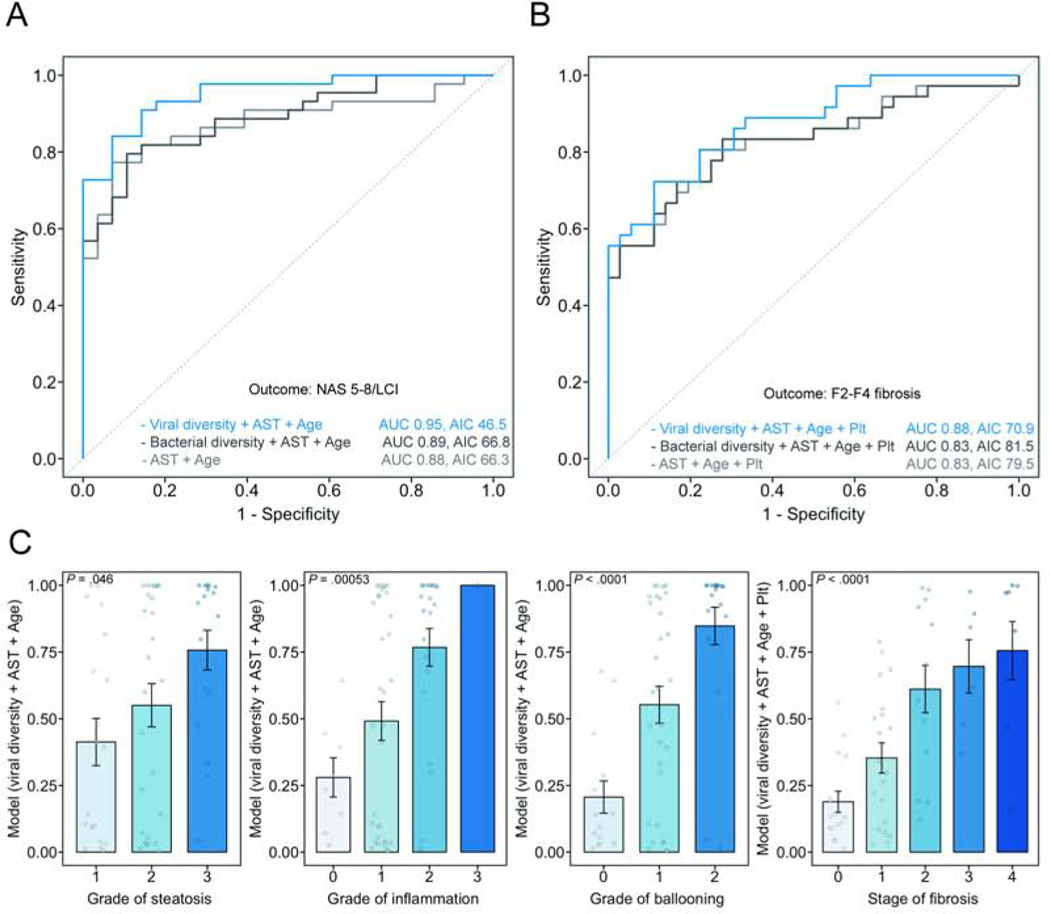
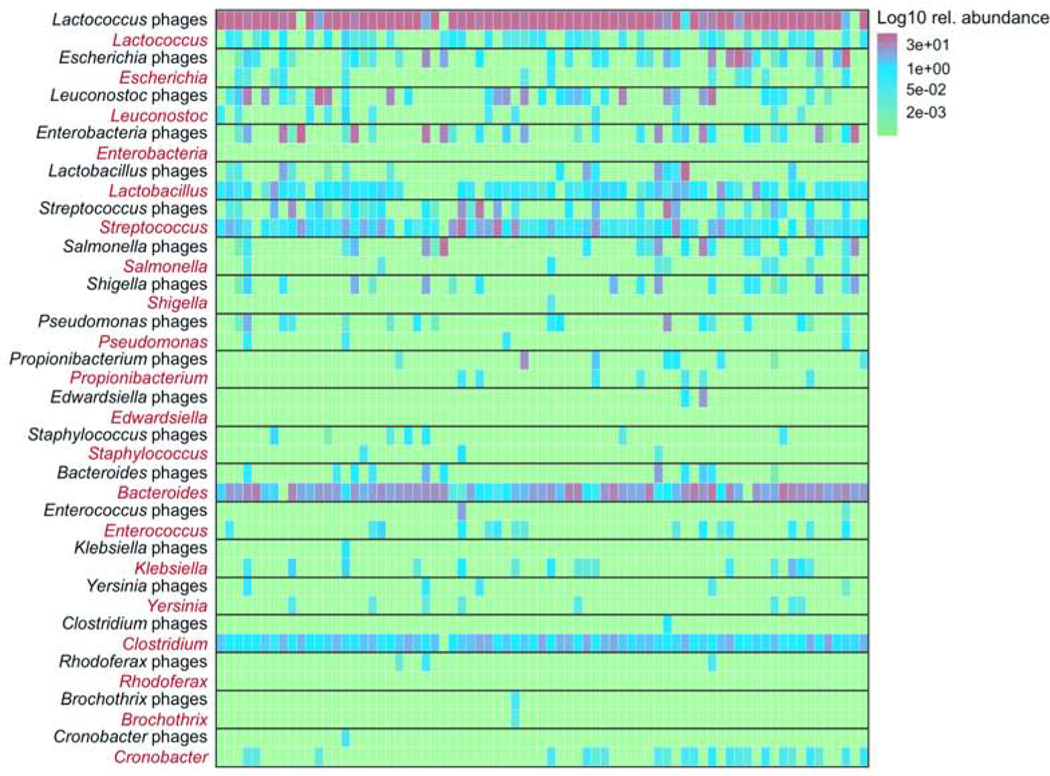
Results: Patients with NAFLD and NAS 5-8/LCI had a significant decrease in intestinal viral diversity compared with patients with NAFLD and NAS 0-4 or control individuals. The presence of more advanced NAFLD was associated with a significant reduction in the proportion of bacteriophages compared with other intestinal viruses. Using multivariate logistic regression analysis with leave-1-out cross validation, we developed a model, including a viral diversity index and simple clinical variables, that identified patients with NAS 5-8/LCI with an area under the curve of 0.95 (95% confidence interval, 0.91-0.99) and F2-F4 fibrosis with an area under the curve of 0.88 (95% confidence interval, 0.80-0.95). Addition of data on viral diversity significantly improved multivariate models, including those based on only clinical parameters or bacterial diversity.

Conclusions: In a study of fecal viromes from patients with NAFLD and control individuals, we associated histologic markers of NAFLD severity with significant decreases in viral diversity and proportion of bacteriophages. We developed a model based on fecal viral diversity and clinical data that identifies patients with severe NAFLD and fibrosis more accurately than models based only on clinical or bacterial data.

Keywords: Biomarker; Microbiota; Prognostic Factor; Progression.


Figures

Figure 1.
Figure 1.. Distribution of shared viral species.
420 detected viral species in 73 patients with NAFLD were assigned into three categories based on overlapping characteristics among samples. 19 species were detected in at least 50% of the samples, 27 in 20%–50% of the samples and the remaining 374 species were detected in equal or less than 20% of the samples and therefore more unique to each patient. In panel A and B, one column represents one patient. (A) Absolute number, (B) relative number of detected species in relationship to sharing characteristics.
Figure 2.
Figure 2.. Altered fecal virome composition in patients with NAS 5–8/LCI.
(A) Viral diversity based on the inverse Simpson index. (B) Mean relative abundance of intestinal bacteriophages (phages), mammalian viruses, and other viruses, calculated at the family level. In panel A–B, 29 patients with NAFLD staged as NAS 0–4 and 44 patients with NAFLD staged as NAS 5–8/LCI were compared with 9 controls and 13 patients with mild primary biliary cholangitis (PBC). (C) Random Forest feature selection including the presence/absence of viral taxa at species level together with selected clinical features to discriminate NAS 5–8/LCI from NAS 0–4. (D) Presence/absence heatmap of the relative abundance of viral taxa among the top 40 features identified in Random Forest feature selection. Stars on the right side of the panel indicate significance whereas one star (*) denotes a P value equal or below .05 but higher than .01. Unadjusted and P values adjusted for proton pump inhibitor use can be found in Supplementary Table 3. ALT, alanine aminotransferase; AST, aspartate aminotransferase; AP, alkaline phosphatase; BMI, body mass index; GGT, gamma-glutamyltransferase; INR, international normalized ratio; HDL, High-density lipoprotein; LCI, liver cirrhosis; LDL, Low-density lipoprotein; NAS, NAFLD activity score.
Figure 3.
Figure 3.. Proportion of bacteriophage species summarized by their bacterial host.
Single phages were analyzed at the species level and summarized according to their hosts. The mean relative abundance for these summarized phages was calculated within the phages with a known bacterial host. The x-axis represents individual patients, grouped by the presence of NAS 5–8/LCI. Patients were further grouped according to the relative abundance of specific phages. NAS, NAFLD activity score; LCI, liver cirrhosis.
Figure 4.
Figure 4.. Altered fecal virome composition in patients with NAFLD and fibrosis.
(A) Mean relative abundance of intestinal bacteriophages (phages), mammalian viruses, and other viruses, calculated at the family level, in fecal samples from patients with NAFLD and F0–F1 fibrosis or patients with NAFLD and F2–F4 fibrosis. (B) Viral diversity based on the Shannon and inverse Simpson indices. (C) Random Forest feature selection including the presence/absence of viral taxa at species level together with selected clinical features to discriminate NAFLD F0–F1 from NAFLD F2–F4. (D) Presence/absence heatmap of the relative abundance of viral taxa among the top 40 features identified in Random Forest feature selection. Stars on the right side of the panel indicate significance whereas one star (*) denotes an adjusted P value equal or below .05 but higher than .01, two stars (**) denote an adjusted P value equal or lower than .01 but higher than .001. Unadjusted and P values adjusted for proton pump inhibitor use can be found in Supplementary Table 3. In panel A–D, 37 patients were staged as F0–F1 fibrosis and 36 patients were staged as F2–F4 fibrosis. ALT, alanine aminotransferase; AST, aspartate aminotransferase; AP, alkaline phosphatase; BMI, body mass index; GGT, gamma-glutamyl-transferase; INR, international normalized ratio; HDL, High-density lipoprotein; LDL, Low-density lipoprotein.
Figure 5.
Figure 5.. Prediction of more severe liver disease using clinical features and intestinal viral diversity.
Receiver operating curves (ROC) were performed based on multivariate models to predict the presence of (A) NAS 5–8/LCI and (B) F2–F4 fibrosis. The most important variables detected by Random Forest feature selection were included in the models, with or without viral diversity (inverse Simpson index) and bacterial diversity (inverse Simpson index). Likelihood ratio test for the detection of NAS 5–8/LCI, model comparison age + aspartate aminotransferase (AST), versus viral diversity + age + AST, P < .001; detection of F2–F4 fibrosis, model comparison age + AST + platelet counts (Plt), versus viral diversity + age + AST + platelet counts, P = .001. (C) Association between the calculated model value for each individual patient and the individual components of the NAFLD activity score and the stage of fibrosis. AUC, area under the curve; AIC Akaike information criterion; NAS, NAFLD activity score; LCI, liver cirrhosis.
Figure 6.
Figure 6.. Association between bacteriophages and bacteria.
Abundance heatmap showing the log10 relative abundance of the 20 most abundant phages in direct relationship with their bacterial host in each individual patient (x-axis).

References

    1. Diehl AM, Day C. Cause, Pathogenesis, and Treatment of Nonalcoholic Steatohepatitis. N Engl J Med 2017;377:2063–2072. - PubMed
    1. Ekstedt M, Hagström H, Nasr P, et al.Fibrosis stage is the strongest predictor for disease-specific mortality in NAFLD after up to 33 years of follow-up. Hepatology 2015;61:1547–1554. - PubMed
    1. Ajmera V. Nonalcoholic fatty liver disease activity score and mortality: Imperfect but not insignificant. Hepatology 2016;64:309–310. - PMC - PubMed
    1. Vilar-Gomez E, Chalasani N. Non-invasive assessment of non-alcoholic fatty liver disease: Clinical prediction rules and blood-based biomarkers. J Hepatol 2018;68:305–315. - PubMed
    1. Balakrishnan M, Loomba R. The Role of Noninvasive Tests for Differentiating NASH From NAFL and Diagnosing Advanced Fibrosis Among Patients With NAFLD. Journal of clinical gastroenterology 2020;54:107–113. - PMC - PubMed

Publication types