

Molecular and functional characterization of urine-derived podocytes from patients with Alport syndrome
- PMID: 32652570
- PMCID: PMC7589231
- DOI: 10.1002/path.5496
Molecular and functional characterization of urine-derived podocytes from patients with Alport syndrome
Abstract
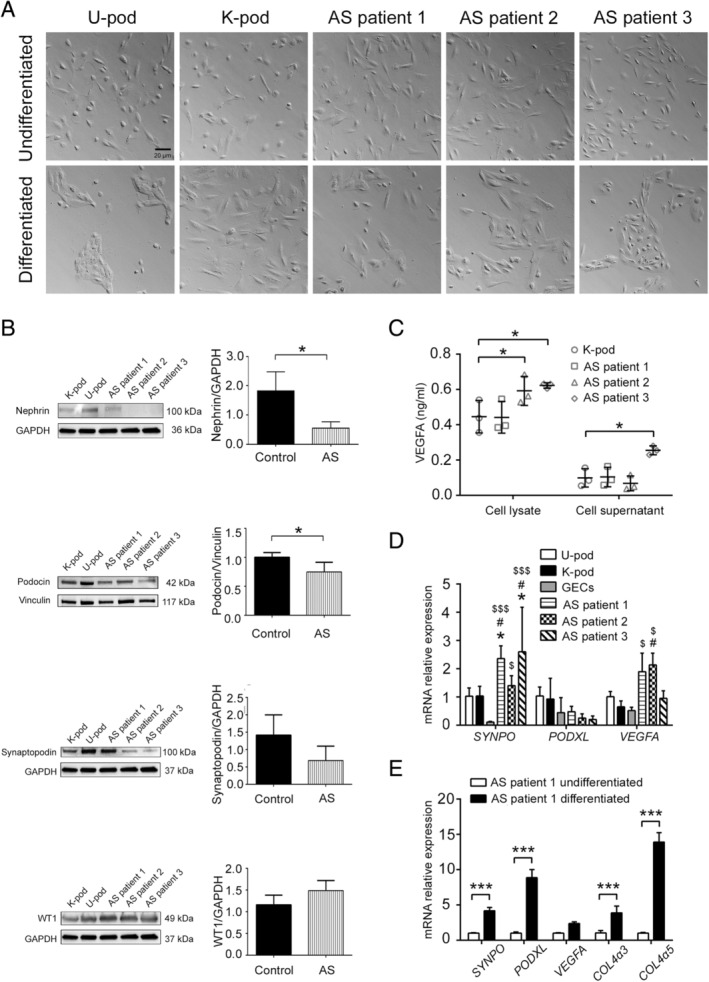
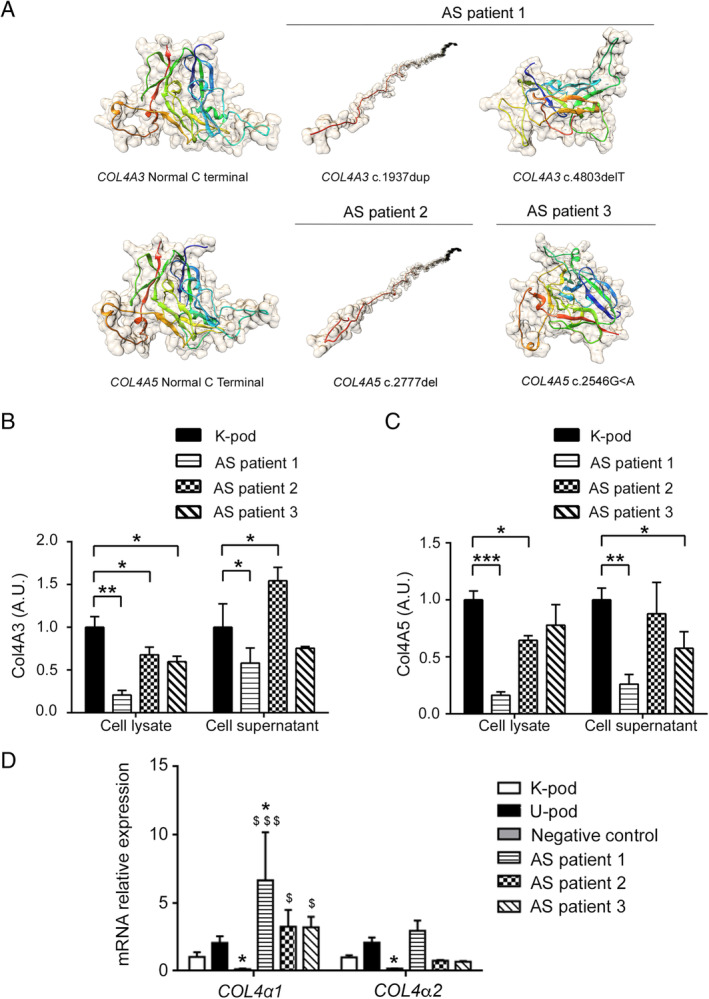
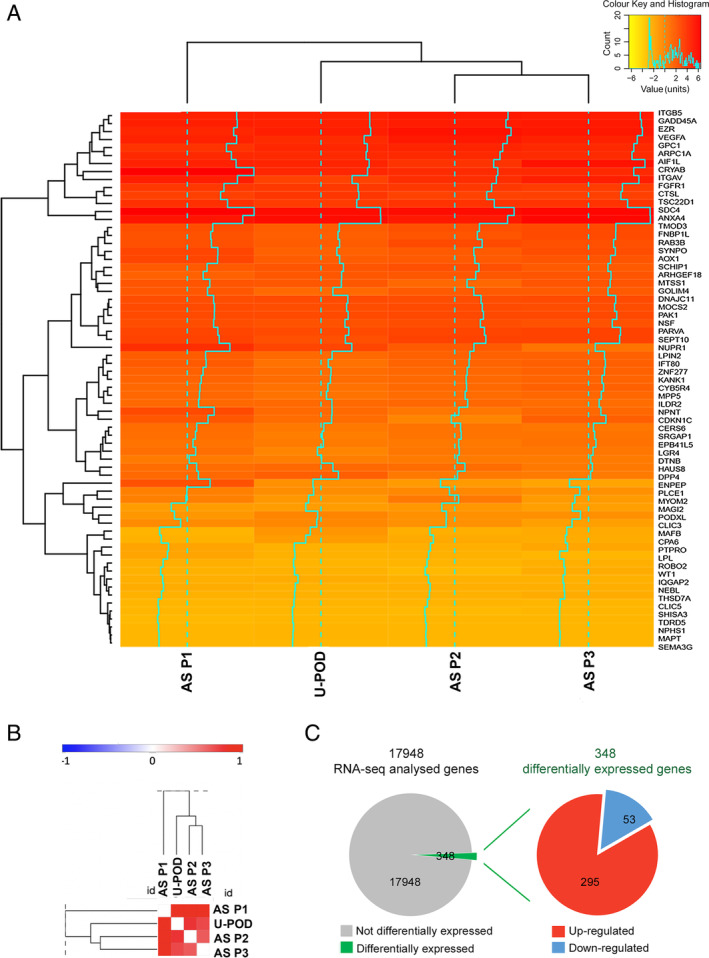
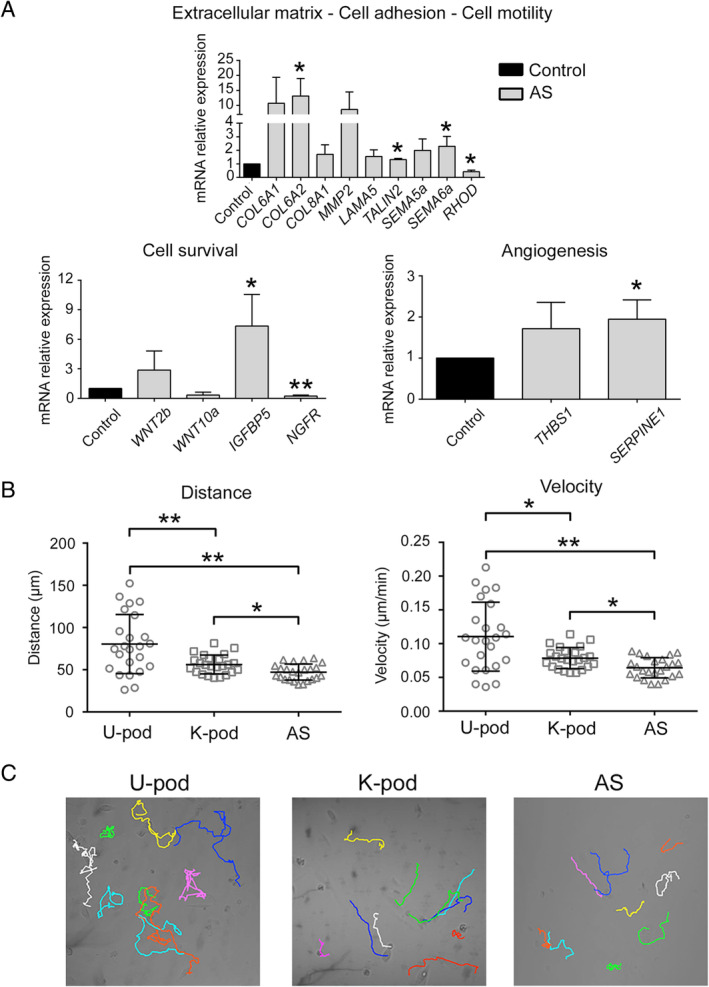
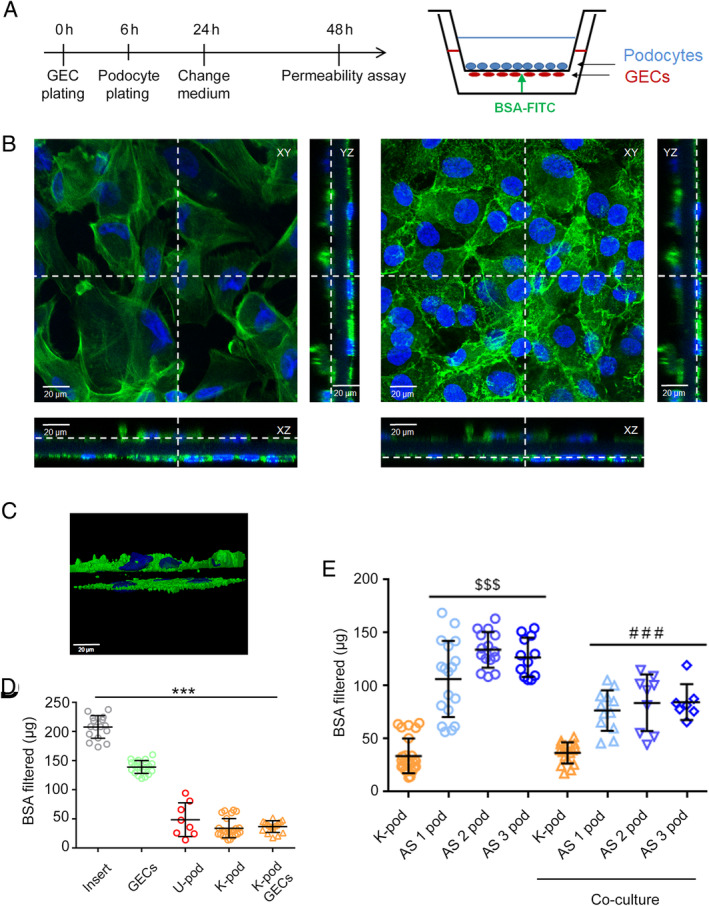
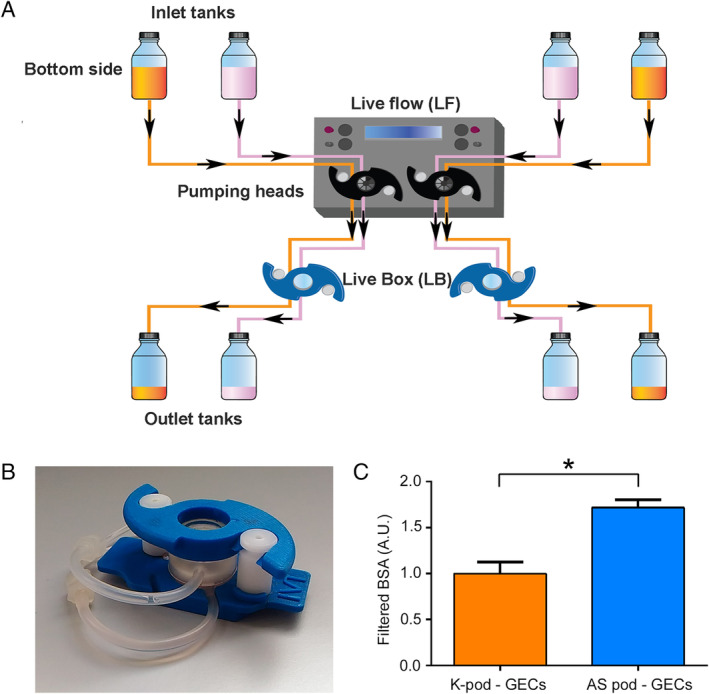
Alport syndrome (AS) is a genetic disorder involving mutations in the genes encoding collagen IV α3, α4 or α5 chains, resulting in the impairment of glomerular basement membrane. Podocytes are responsible for production and correct assembly of collagen IV isoforms; however, data on the phenotypic characteristics of human AS podocytes and their functional alterations are currently limited. The evident loss of viable podocytes into the urine of patients with active glomerular disease enables their isolation in a non-invasive way. Here we isolated, immortalized, and subcloned podocytes from the urine of three different AS patients for molecular and functional characterization. AS podocytes expressed a typical podocyte signature and showed a collagen IV profile reflecting each patient's mutation. Furthermore, RNA-sequencing analysis revealed 348 genes differentially expressed in AS podocytes compared with control podocytes. Gene Ontology analysis underlined the enrichment in genes involved in cell motility, adhesion, survival, and angiogenesis. In parallel, AS podocytes displayed reduced motility. Finally, a functional permeability assay, using a podocyte-glomerular endothelial cell co-culture system, was established and AS podocyte co-cultures showed a significantly higher permeability of albumin compared to control podocyte co-cultures, in both static and dynamic conditions under continuous perfusion. In conclusion, our data provide a molecular characterization of immortalized AS podocytes, highlighting alterations in several biological processes related to extracellular matrix remodelling. Moreover, we have established an in vitro model to reproduce the altered podocyte permeability observed in patients with AS. © 2020 The Authors. The Journal of Pathology published by John Wiley & Sons Ltd on behalf of Pathological Society of Great Britain and Ireland..
Keywords: Alport syndrome; co-culture; collagen IV; genetic defects; glomerular endothelial cells; permeability; urine-derived podocytes.
© 2020 The Authors. The Journal of Pathology published by John Wiley & Sons Ltd on behalf of Pathological Society of Great Britain and Ireland..
Figures
Comment in
-
Bedside to bench Alport syndrome research: are human urine-derived podocytes the answer?†.J Pathol. 2021 Jan;253(1):11-13. doi: 10.1002/path.5564. Epub 2020 Oct 23. J Pathol. 2021. PMID: 33009821 Free PMC article.
Similar articles
-
Bedside to bench Alport syndrome research: are human urine-derived podocytes the answer?†.J Pathol. 2021 Jan;253(1):11-13. doi: 10.1002/path.5564. Epub 2020 Oct 23. J Pathol. 2021. PMID: 33009821 Free PMC article.
-
Glomerular basement membrane deposition of collagen α1(III) in Alport glomeruli by mesangial filopodia injures podocytes via aberrant signaling through DDR1 and integrin α2β1.J Pathol. 2022 Sep;258(1):26-37. doi: 10.1002/path.5969. Epub 2022 Jun 22. J Pathol. 2022. PMID: 35607980 Free PMC article.
-
Upregulated expression of integrin α1 in mesangial cells and integrin α3 and vimentin in podocytes of Col4a3-null (Alport) mice.PLoS One. 2012;7(12):e50745. doi: 10.1371/journal.pone.0050745. Epub 2012 Dec 7. PLoS One. 2012. PMID: 23236390 Free PMC article.
-
Role of the podocyte (and glomerular endothelium) in building the GBM.Semin Nephrol. 2012 Jul;32(4):342-9. doi: 10.1016/j.semnephrol.2012.06.005. Semin Nephrol. 2012. PMID: 22958488 Free PMC article. Review.
-
Alport syndrome and Pierson syndrome: Diseases of the glomerular basement membrane.Matrix Biol. 2018 Oct;71-72:250-261. doi: 10.1016/j.matbio.2018.04.008. Epub 2018 Apr 16. Matrix Biol. 2018. PMID: 29673759 Free PMC article. Review.
Cited by
-
Urine-Derived Epithelial Cells as Models for Genetic Kidney Diseases.Cells. 2021 Jun 6;10(6):1413. doi: 10.3390/cells10061413. Cells. 2021. PMID: 34204173 Free PMC article. Review.
-
Mesenchymal Stromal Cell-Derived Extracellular Vesicles Pass through the Filtration Barrier and Protect Podocytes in a 3D Glomerular Model under Continuous Perfusion.Tissue Eng Regen Med. 2021 Aug;18(4):549-560. doi: 10.1007/s13770-021-00374-9. Epub 2021 Jul 27. Tissue Eng Regen Med. 2021. PMID: 34313970 Free PMC article.
-
Novel Human Podocyte Cell Model Carrying G2/G2 APOL1 High-Risk Genotype.Cells. 2021 Jul 28;10(8):1914. doi: 10.3390/cells10081914. Cells. 2021. PMID: 34440683 Free PMC article.
-
Bedside to bench Alport syndrome research: are human urine-derived podocytes the answer?†.J Pathol. 2021 Jan;253(1):11-13. doi: 10.1002/path.5564. Epub 2020 Oct 23. J Pathol. 2021. PMID: 33009821 Free PMC article.
-
Glomerulus-on-a-Chip: Current Insights and Future Potential Towards Recapitulating Selectively Permeable Filtration Systems.Int J Nephrol Renovasc Dis. 2022 Mar 10;15:85-101. doi: 10.2147/IJNRD.S344725. eCollection 2022. Int J Nephrol Renovasc Dis. 2022. PMID: 35299832 Free PMC article. Review.
References
-
- Watson S, Padala SA, Bush JS. Alport Syndrome In StatPearls. StatPearls Publishing: Treasure Island, FL, 2020. - PubMed
-
- Timpl R, Brown JC. Supramolecular assembly of basement membranes. Bioessays 1996; 18 123–132. - PubMed
-
- Sundaramoorthy M, Meiyappan M, Todd P, et al Crystal structure of NC1 domains. Structural basis for type IV collagen assembly in basement membranes. J Biol Chem 2002; 277 31142–31153. - PubMed
-
- Sado Y, Kagawa M, Naito I, et al Organization and expression of basement membrane collagen IV genes and their roles in human disorders. J Biochem 1998; 123 767–776. - PubMed
-
- Hudson BG. The molecular basis of Goodpasture and Alport syndromes: beacons for the discovery of the collagen IV family. J Am Soc Nephrol 2004; 15 2514–2527. - PubMed
Publication types
MeSH terms
Substances
LinkOut - more resources
Full Text Sources
Other Literature Sources
Molecular Biology Databases
Research Materials
