

Interventional low-dose azithromycin attenuates cigarette smoke-induced emphysema and lung inflammation in mice
- PMID: 32652854
- PMCID: PMC7354087
- DOI: 10.14814/phy2.14419
Interventional low-dose azithromycin attenuates cigarette smoke-induced emphysema and lung inflammation in mice
Abstract
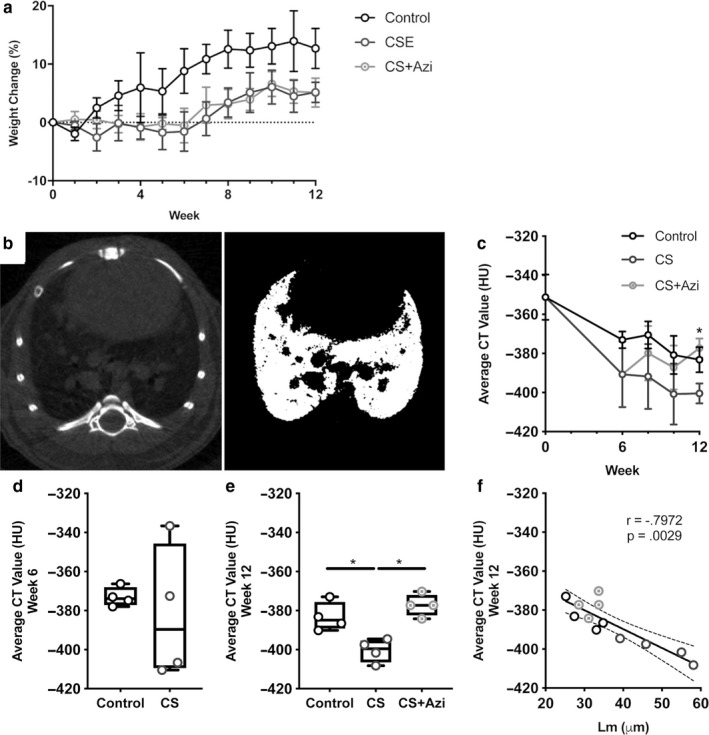
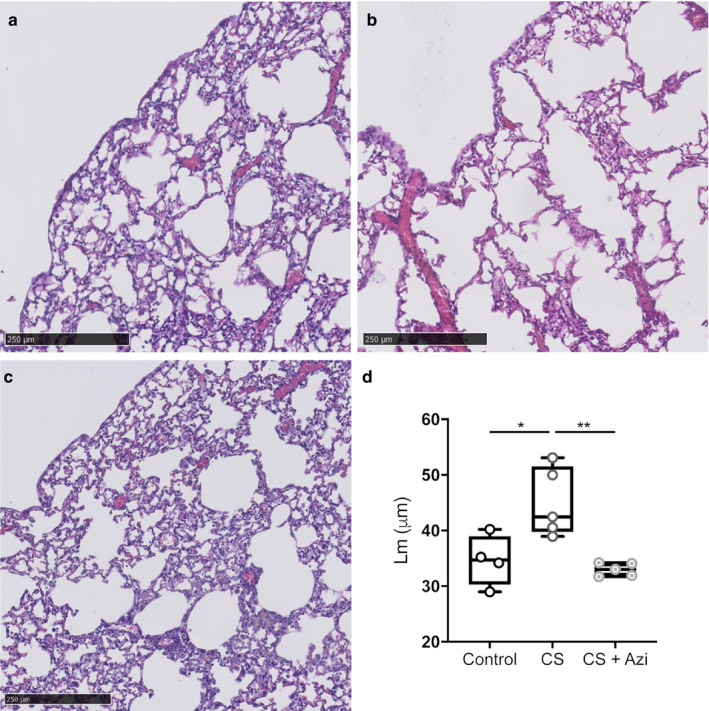
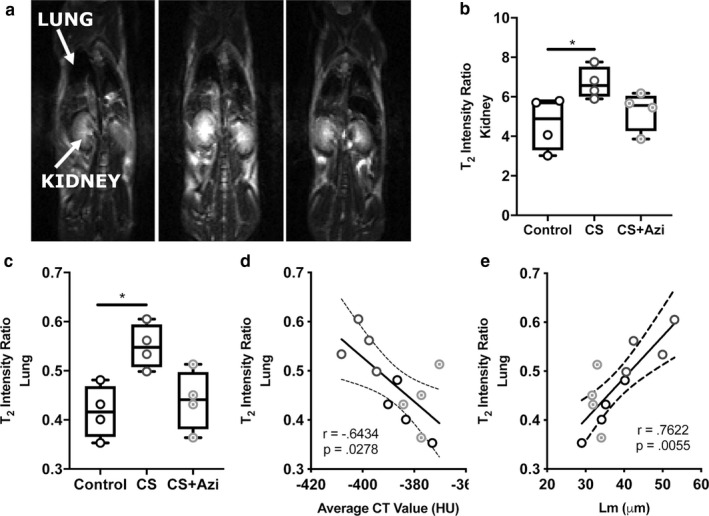
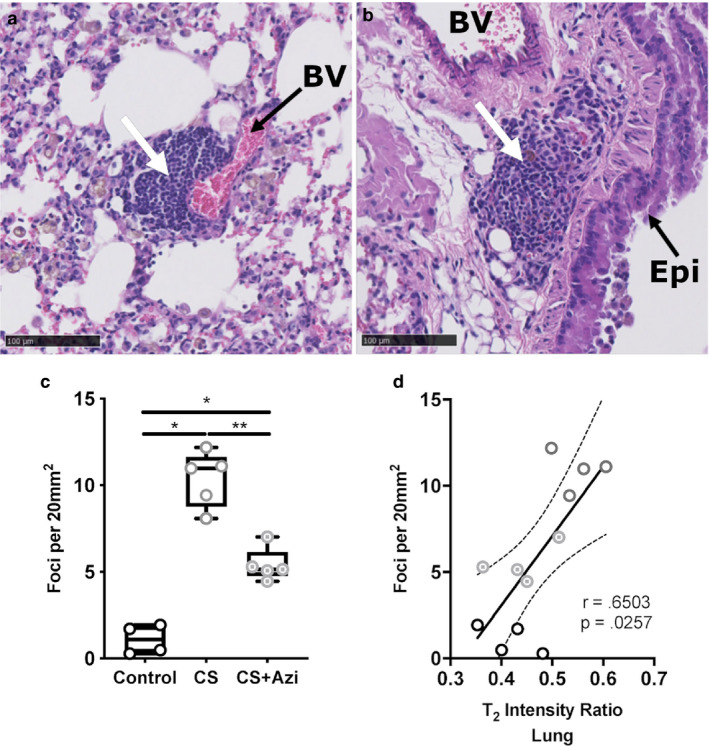
Cigarette smoke (CS)-induced emphysema is an important contributor to chronic obstructive pulmonary disease (COPD). We have shown the efficacy of azithromycin in reducing airway inflammation in COPD and in reducing exacerbations in severe asthma; however, the effects of long-term azithromycin on emphysema development have not been shown. We employed live animal imaging to monitor emphysema-like development and the effects of interventional azithromycin treatment in CS-exposed mice. BALB/c mice (female, 10 weeks; n = 10) were exposed to CS for 1 hr twice daily, 5 days/week, and for 12 weeks (CS). Half were cotreated with low-dose azithromycin during weeks 7-12 (CS + Azi; 0.2 mg kg-1 day-1 ). Microcomputed tomography (CT) and magnetic resonance imaging (MRI) scans were acquired longitudinally. Histological examinations were performed post mortem (mean linear intercept (Lm) and leukocyte infiltration). CS increased median Lm (CS: 42.45 µm versus control: 34.7 µm; p = .0317), this was recovered in CS + Azi mice (33.03 µm). Average CT values were reduced in CS mice (CS: -399.5 Hounsfield units (HU) versus control: -384.9 HU; p = .0286) but not in CS + Azi mice (-377.3 HU). CT values negatively correlated with Lm (r = -.7972; p = .0029) and T2 -weighted MRI (r = -.6434; p = .0278). MRI also showed significant CS-induced inflammatory changes that were attenuated by azithromycin in the lungs, and positively correlated with Lm (r = .7622; p = .0055) and inflammatory foci counts (r = .6503; p = .0257). Monitoring of emphysema development is possible via micro-CT and MRI. Interventional azithromycin treatment in CS-exposed mice attenuated the development of pulmonary emphysema-like changes.
Keywords: COPD; chronic obstructive pulmonary disease; emphysema; in vivo imaging; magnetic resonance imaging; micro-CT; mouse model.
© 2020 The Authors. Physiological Reports published by Wiley Periodicals, Inc. on behalf of The Physiological Society and the American Physiological Society.
Figures
Similar articles
-
Diallyl disulfide prevents cigarette smoke-induced emphysema in mice.Pulm Pharmacol Ther. 2021 Aug;69:102053. doi: 10.1016/j.pupt.2021.102053. Epub 2021 Jul 5. Pulm Pharmacol Ther. 2021. PMID: 34214692
-
Cigarette smoke-induced autophagy impairment accelerates lung aging, COPD-emphysema exacerbations and pathogenesis.Am J Physiol Cell Physiol. 2018 Jan 1;314(1):C73-C87. doi: 10.1152/ajpcell.00110.2016. Epub 2016 Jul 13. Am J Physiol Cell Physiol. 2018. PMID: 27413169 Free PMC article.
-
Azithromycin attenuates pulmonary inflammation and emphysema in smoking-induced COPD model in rats.Respir Care. 2015 Jan;60(1):128-34. doi: 10.4187/respcare.03344. Epub 2014 Sep 23. Respir Care. 2015. PMID: 25249648
-
Augmentation of S-Nitrosoglutathione Controls Cigarette Smoke-Induced Inflammatory-Oxidative Stress and Chronic Obstructive Pulmonary Disease-Emphysema Pathogenesis by Restoring Cystic Fibrosis Transmembrane Conductance Regulator Function.Antioxid Redox Signal. 2017 Sep 1;27(7):433-451. doi: 10.1089/ars.2016.6895. Epub 2017 Feb 7. Antioxid Redox Signal. 2017. PMID: 28006950 Free PMC article.
-
Cigarette smoke exposure produces more evidence of emphysema in B6C3F1 mice than in F344 rats.Toxicol Sci. 1999 Oct;51(2):289-99. doi: 10.1093/toxsci/51.2.289. Toxicol Sci. 1999. PMID: 10543031
Cited by
-
TAp63α Is Involved in Tobacco Smoke-Induced Lung Cancer EMT and the Anti-cancer Activity of Curcumin via miR-19 Transcriptional Suppression.Front Cell Dev Biol. 2021 Mar 4;9:645402. doi: 10.3389/fcell.2021.645402. eCollection 2021. Front Cell Dev Biol. 2021. PMID: 33748140 Free PMC article.
-
In vivo measurements of lung function using respiratory-gated micro-computed tomography in a smoke-exposure model of chronic obstructive pulmonary disease.J Med Imaging (Bellingham). 2023 Jan;10(1):016002. doi: 10.1117/1.JMI.10.1.016002. Epub 2023 Feb 16. J Med Imaging (Bellingham). 2023. PMID: 36818545 Free PMC article.
-
Azithromycin attenuates wheezing after pulmonary inflammation through inhibiting histone H3K27me3 hypermethylation mediated by EZH2.Clin Epigenetics. 2023 Jan 23;15(1):12. doi: 10.1186/s13148-023-01430-y. Clin Epigenetics. 2023. PMID: 36691058 Free PMC article. Clinical Trial.
-
Lung Volume Calculation in Preclinical MicroCT: A Fast Geometrical Approach.J Imaging. 2022 Jul 22;8(8):204. doi: 10.3390/jimaging8080204. J Imaging. 2022. PMID: 35893082 Free PMC article.
-
AIM2 nuclear exit and inflammasome activation in chronic obstructive pulmonary disease and response to cigarette smoke.J Inflamm (Lond). 2021 May 22;18(1):19. doi: 10.1186/s12950-021-00286-4. J Inflamm (Lond). 2021. PMID: 34022905 Free PMC article.
References
-
- Alwan, A. (2010). Global status report on non‐communicable diseases. WHO.
-
- Aoshiba, K. , Yokohori, N. , & Nagai, A. (2003). Alveolar wall apoptosis causes lung destruction and emphysematous changes. American Journal of Respiratory Cell and Molecular Biology, 28, 555–562. - PubMed
-
- Barnes, P. (2014). Cellular and molecular mechanisms of chronic obstructive pulmonary disease. Clinics in Chest Medicine, 35, 71–86. - PubMed
-
- Barnes, P. (2016). Inflammatory mechanisms in patients with chronic obstructive pulmonary disease. The Journal of Allergy and Clinical Immunology, 138, 16–27. - PubMed
Publication types
MeSH terms
Substances
LinkOut - more resources
Full Text Sources
Medical
