

doi: 10.1016/s0304-3991(78)80038-2.
Reconstruction of glutamine synthetase using computer averaging
- PMID: 32653
- PMCID: PMC4167717
- DOI: 10.1016/s0304-3991(78)80038-2
Item in Clipboard
Reconstruction of glutamine synthetase using computer averaging
Ultramicroscopy.
1978.
Abstract
The axial projection of the glutamine synthetase molecule has been reconstructed from electron micrographs of a stained preparation by using a new method of correlation search and averaging. The average over 50 individual molecules appears as a radial pattern with sixfold symmetry. The handedness evident in the average is attributed to nonuniformity of the negative stain.
Figures

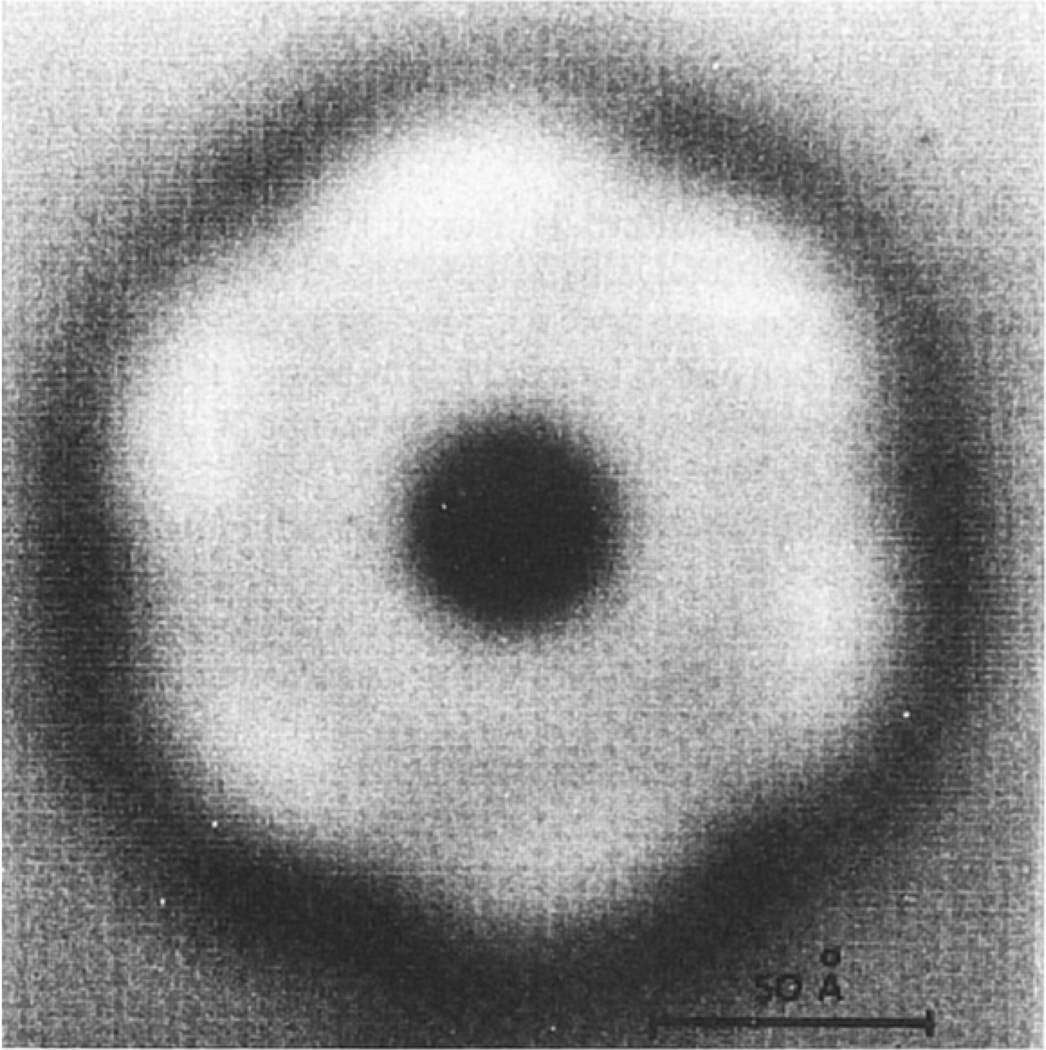
Electron micrograph of glutamine synthetase from Bacillus caldolyticus stained with uranyl acetate.

Gallery of selected particles. The sidelength of the image arrays is 200 Å. Particles marked with arrows show the “windmill” features of the reconstruction (see section 4).

Computerp lots of (a) two-dimensional autocorrelation functions of two particles and (b) their averaged product (angular cross-correlation) in different relative orientations θ. The three peaks within a 180° range indicate hexagonal symmetry. The computer searches the position of the maximum peak and uses the corresponding angle to rotate one of the particles in to the same orientation as its reference particle.

Two-dimensional cross-correlation function of two GS particles that have been brought into matching orientations. The position of the peak with respect to the center indicates the relative shift between the two particles (from [19], courtesy of Springer-Verlag, Heidelberg).

Average of 50 particles: (a) contour representation; (b) enhanced gray-level display of stain-excluding region; (c) sixfold, rotationally averaged reconstruction in contour representation; and (d) same as c, with enhanced gray-level display of stain-excluding region. D, largest diameter scaled to 140 Å;d1,d2, minor and major axes of the elliptic region. The dotted line marks the approximately circular subunit region.

Average of 15 particles with the highest correlation (a) before and (b) after sixfold rotational averaging.
Gray-level display of reconstructed particle, including highcontrast stain regions.