. 2021 Jan;70(1):137-151.
doi: 10.1007/s00262-020-02668-8. Epub 2020 Jul 11.

ZFHX3 mutation as a protective biomarker for immune checkpoint blockade in non-small cell lung cancer

Affiliations

ZFHX3 mutation as a protective biomarker for immune checkpoint blockade in non-small cell lung cancer

Jiexia Zhang et al. Cancer Immunol Immunother. 2021 Jan.

Abstract

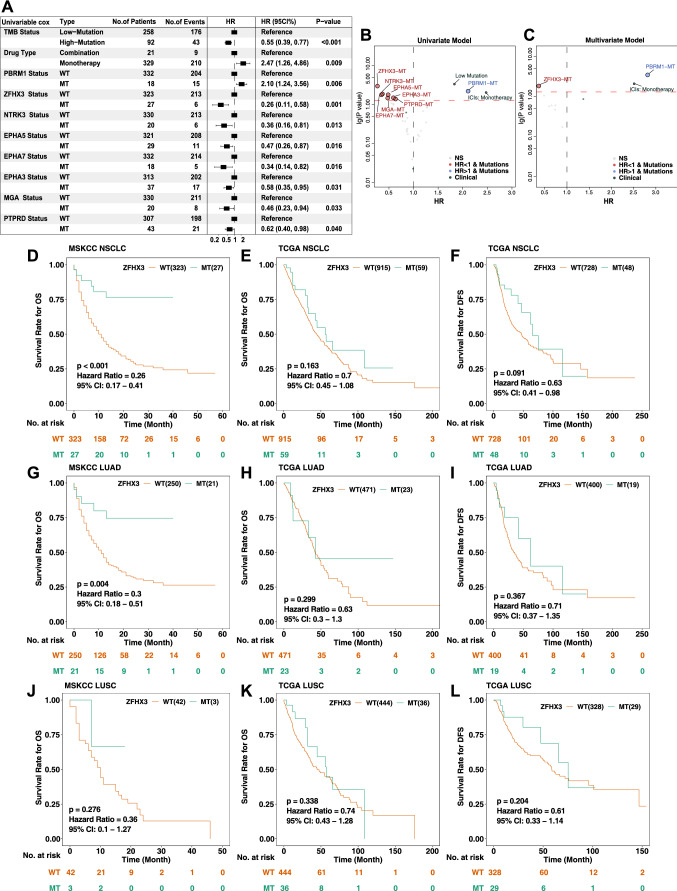
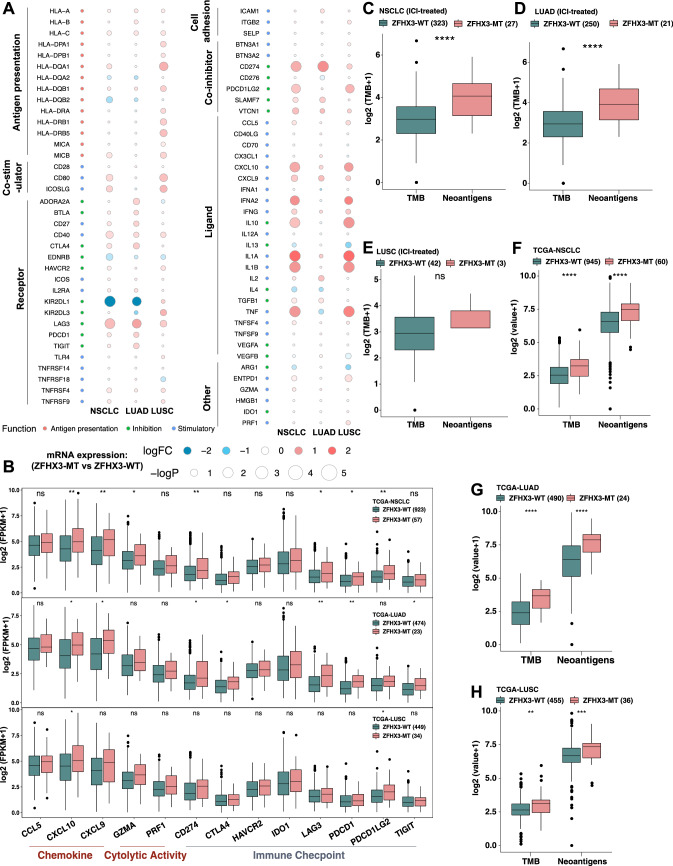
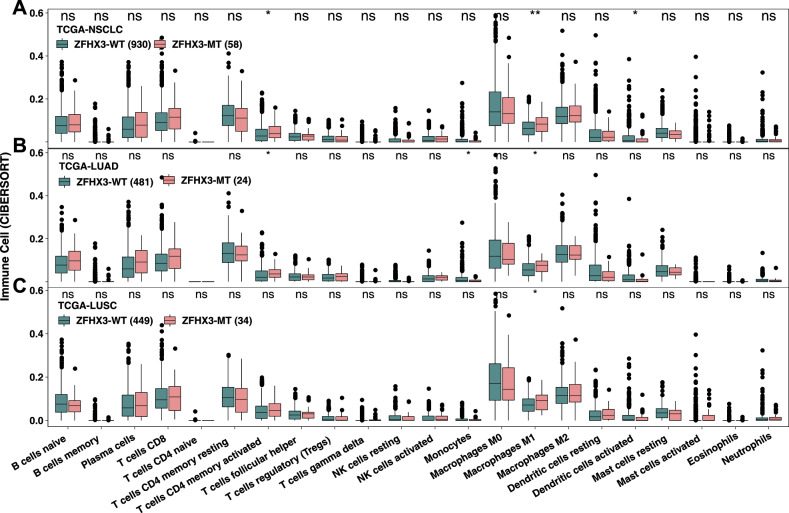
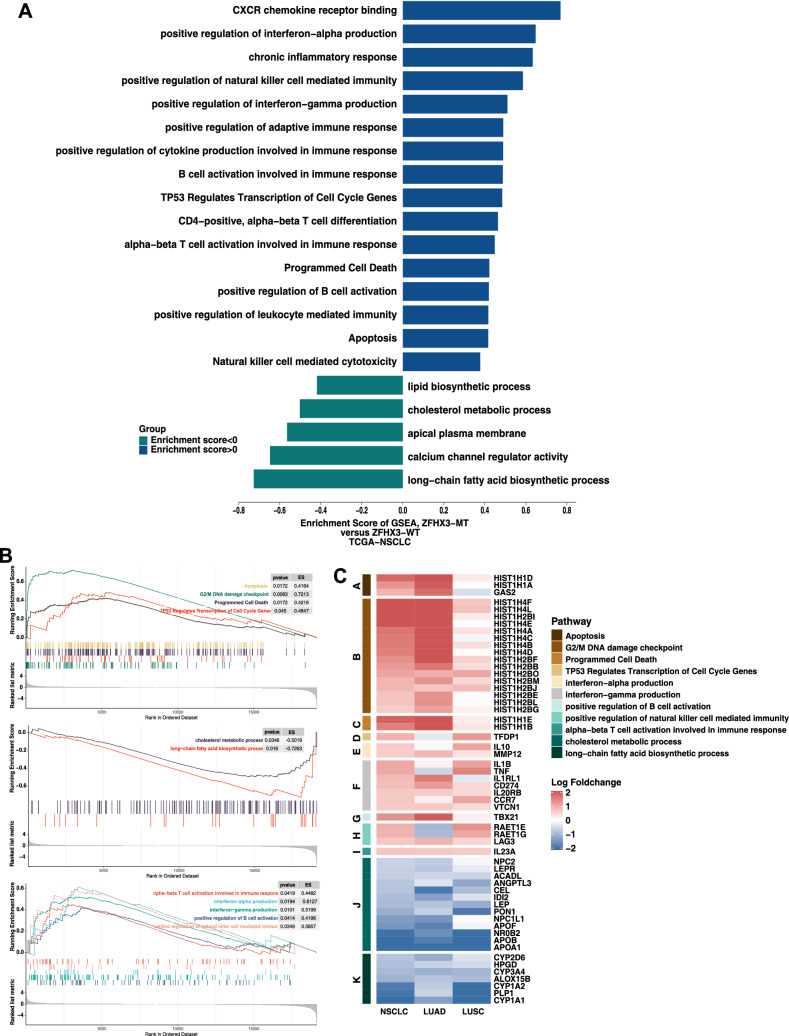
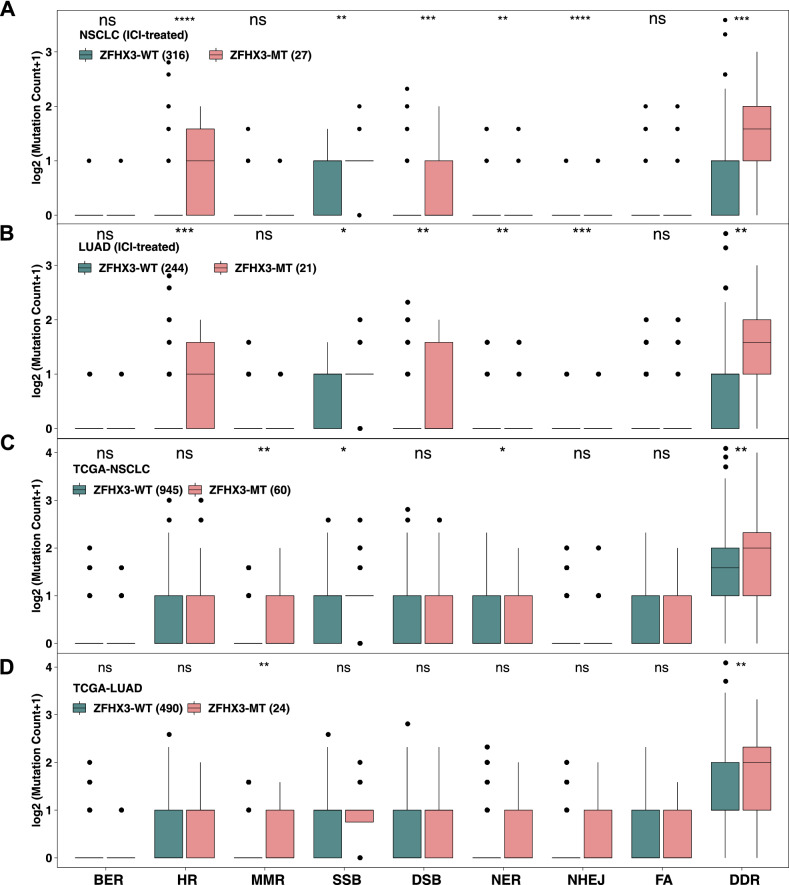
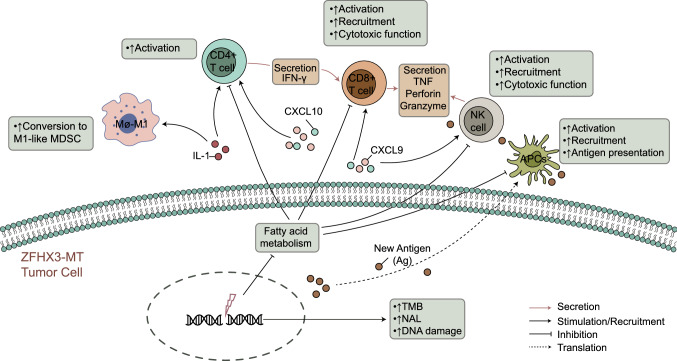
To date, immunotherapy has opened a new chapter in the treatment of lung cancer. Precise biomarkers can help to screen subpopulations of lung cancer to provide the best treatment. Multiple studies suggest that specific gene mutations may be predictive markers in guiding non-small cell lung cancer (NSCLC) immune checkpoint inhibitor (ICI) treatment. A published immunotherapy cohort with mutational and survival data for 350 NSCLC patients was used. First, the mutational data of the immunotherapy cohort were used to identify gene mutations related to the prognosis of ICI therapy. The immunotherapy cohort and TCGA-NSCLC cohort were further studied to elucidate the relationships between specific gene mutations and tumor immunogenicity, antitumor immune response capabilities, and immune cell and mutation counts in the DNA damage response (DDR) pathway. In the immunotherapy cohort (N = 350), ZFHX3 mutations were an independent predictive biomarker for NSCLC patients receiving ICI treatment. Significant differences were observed between ZFHX3-mutant (ZFHX3-MT) and ZFHX3-wild type (ZFHX3-WT) patients regarding the overall survival (OS) time (P < 0.001, HR = 0.26, 95% Cl 0.17-0.41). ZFHX3-MT is significantly associated with higher tumor mutation burden (TMB) and neoantigen load (NAL), and ZFHX3-MT positively correlates with known immunotherapy response biomarkers, including T-cell infiltration, immune-related gene expression, and mutation counts in the DDR pathway in NSCLC. ZFHX3-MT is closely related to longer OS in NSCLC patients treated with ICIs, suggesting that ZFHX3 mutations be used as a novel predictive marker in guiding NSCLC ICI treatment.

Keywords: Biomarker; Immune checkpoint inhibitor; Non-small cell lung cancer; ZFHX3.


Conflict of interest statement

The authors declare that they have no conflict interests.

Figures

Fig. 1
Fig. 1
Results of Cox proportional hazard regression analysis for the ICI-treated NSCLC cohort (Samstein et al. N = 350) and survival curves for patients with NSCLC stratified by ZFHX3 status. a Forest plots showing the loge hazard ratio (95% confidence interval). Cox p values less than 0.05 are shown. Bubble plot showing the result of univariate b and multivariate c Cox proportional hazard regression analysis between ZFHX3-MT and ZFHX3-WT tumors. d Kaplan–Meier estimates of OS in the ICI-treated NSCLC cohort comparing patients with ZFHX3-MT with their respective counterparts without ZFHX3-MT. Patients (NSCLC) who harbored ZFHX3 mutations showed a better prognosis for ICI-based immunotherapy (P < 0.001, log-rank test). e Kaplan–Meier estimates of OS in the TCGA-NSCLC cohort comparing patients with ZFHX3-MT with their respective counterparts without ZFHX3-MT. f Kaplan–Meier estimates of DFS in the TCGA-NSCLC cohort comparing patients with ZFHX3-MT with their respective counterparts without ZFHX3-MT.g Kaplan–Meier estimates of OS in the ICI-treated LUAD cohort comparing patients with ZFHX3-MT with their respective counterparts without ZFHX3-MT. Patients (LUAD) who harbored ZFHX3 mutations showed a better prognosis for ICI-based immunotherapy. h Kaplan–Meier estimates of OS comparing patients in the TCGA-LUAD cohort with ZFHX3-MT with their respective counterparts without ZFHX3-MT. i Kaplan–Meier estimates of DFS in the TCGA-LUAD cohort comparing patients with ZFHX3-MT with their respective counterparts without ZFHX3-MT. j Kaplan–Meier estimates of OS in the ICI-treated LUSC cohort comparing patients with ZFHX3-MT with their respective counterparts without ZFHX3-MT. k Kaplan–Meier estimates of OS in the TCGA-LUSC cohort comparing patients with ZFHX3-MT with their respective counterparts without ZFHX3-MT. l Kaplan–Meier estimates of DFS in the TCGA-LUSC cohort comparing patients with ZFHX3-MT with their respective counterparts without ZFHX3-MT
Fig. 2
Fig. 2
Mutational landscape, clinical information of NSCLC patients, and the characteristics of ZFHX3 mutations in patients (NSCLC and each cancer type in TCGA). a Top 20 frequently mutated genes in NSCLC in the Samstein cohort (ICI-treated). The genes were ranked by the mutation frequency in NSCLC patients. The alteration type, ZFHX3 status, sex, histological subtype, OS status, OS time, treatment type, and age group are annotated. Significantly different genes are highlighted in bold (significance was calculated using Fisher’s exact test). b Top 20 frequently mutated genes in NSCLC in the TCGA-NSCLC cohort. The genes were ranked by the mutation frequency in NSCLC patients. The alteration type, survival status, survival time, ZFHX3 status, histological subtype, clinical stage, age, race, sex, tobacco smoking history, and number of pack-years smoked are annotated. c Lollipop plot shows the distribution of ZFHX3 mutations in the ICI-treated cohort (left panel) and TCGA-NSCLC cohort. d The proportion of ZFHX3-MT tumors identified for each cancer type in TCGA. The numbers above the barplot indicate the alteration frequency, and the numbers close to the cancer names indicate the number of ZFHX3-MT patients and the total number of patients. The fractions of mutation types of ZFHX3-MT tumors identified for each cancer type in TCGA (top panel)
Fig. 3
Fig. 3
ZFHX3 mutations were associated with enhanced tumor immunogenicity and activated antitumor immunity. a Bubble plot depicting the mean differences in immune-related gene mRNA expression between ZFHX3-MT and ZFHX3-WT tumors in the TCGA-NSCLC/LUAD/LUSC cohort. The x-axis of the bubble plot indicates different histological subtypes, and the y-axis indicates tumor-infiltrating leukocytes, immune signatures, or gene names. The size of the circle represents the difference (-log10(p-value)) of each indicated immune signature or immune-related gene between ZFHX3-MT and ZFHX3-WT tumors in each cancer type. Red indicates upregulation, while blue indicates downregulation. b The expression levels of immune-related genes, such as chemokines, cytolytic activity-associated genes and immune checkpoints in ZFHX3-MT tumors versus ZFHX3-WT tumors (TCGA-NSCLC, LUAD and LUSC). Comparison of TMB between ZFHX3-MT and ZFHX3-WT tumors in Samstein’s NSCLC (c), LUAD (d) and LUSC (e) cohorts. Comparison of TMB and NAL between ZFHX3-MT and ZFHX3-WT tumors in the TCGA-NSCLC (f), LUAD (g) and LUSC (h) cohorts. (bh *, P < 0.05; **, P < 0.01; ***, P < 0.001, ****, P < 0.0001, Mann–Whitney U test)
Fig. 4
Fig. 4
Comparison of immune cells between ZFHX3-MT and ZFHX3-WT tumors in the TCGA-NSCLC (a), LUAD (b), and LUSC (c) cohorts. Gene expression profiles were prepared using standard annotation files, and data were uploaded to the CIBERSORT web portal (https://cibersort.stanford.edu/), with the algorithm run using the LM22 signature and 1,000 permutations
Fig. 5
Fig. 5
Transcriptome biological function traits of ZFHX3-MT and ZFHX3-WT tumors in the TCGA-NSCLC cohort. a Differences in pathway activities scored by GSEA between ZFHX3-MT and ZFHX3-WT tumors in the TCGA-NSCLC cohort. Enrichment results with significant associations between ZFHX3-MT and ZFHX3-WT tumors are shown. The blue bar indicates that the enrichment score (ES) of the pathway is more than 0, while the green bar indicates that the ES of the pathway is less than 0. b GSEA of hallmark gene sets downloaded from MSigDB. All transcripts were ranked by the log2 (fold change) between ZFHX3-MT and ZFHX3-WT tumors in the TCGA-NSCLC cohort. Each run was performed with 1000 permutations. Enrichment results with significant associations between ZFHX3-MT and ZFHX3-WT tumors are shown. c Heatmap depicting the mean differences in the enrichment results with significant associations between ZFHX3-MT and ZFHX3-WT tumors in the TCGA-NSCLC, LUAD, and LUSC cohorts. The x-axis of the heatmap indicates different histological subtypes, and the y-axis indicates gene names and pathway signatures between ZFHX3-MT and ZFHX3-WT tumors in TCGA-NSCLC, LUAD, and LUSC. Red indicates upregulation, while blue indicates downregulation
Fig. 6
Fig. 6
Comparison of DNA damage-related gene set alterations between ZFHX3-MT and ZFHX3-WT tumors in cell lines from the ICI-treated NSCLC (a), ICI-treated LUAD (b), TCGA-NSCLC (c), and TCGA-LUAD (d) cohorts. (*, P < 0.05; **, P < 0.01; ***, P < 0.001, ****, P < 0.0001, Mann–Whitney U test)
Fig. 7
Fig. 7
The possible mechanism underlying the improved efficacy and prognosis in ZFHX3-MT NSCLC receiving ICIs

References

    1. Fitzmaurice C, Allen C, Barber RM, et al. Global, regional, and national cancer incidence, mortality, years of life lost, years lived with disability, and disability-adjusted life-years for 32 cancer groups, 1990 to 2015. JAMA Oncol. 2017;3:524. doi: 10.1001/jamaoncol.2016.5688. - DOI - PMC - PubMed
    1. Garon EB, Rizvi NA, Hui R, et al. Pembrolizumab for the treatment of non–small-cell lung cancer. N Engl J Med. 2015;372:2018–2028. doi: 10.1056/NEJMoa1501824. - DOI - PubMed
    1. Havel JJ, Chowell D, Chan TA. The evolving landscape of biomarkers for checkpoint inhibitor immunotherapy. Nat Rev Cancer. 2019;19:133–150. doi: 10.1038/s41568-019-0116-x. - DOI - PMC - PubMed
    1. Zou W, Wolchok JD, Chen L. PD-L1 (B7–H1) and PD-1 pathway blockade for cancer therapy: Mechanisms, response biomarkers, and combinations. Sci Transl Med. 2016 doi: 10.1126/scitranslmed.aad7118. - DOI - PMC - PubMed
    1. Wang S, He Z, Wang X, et al. Antigen presentation and tumor immunogenicity in cancer immunotherapy response prediction. Elife. 2019 doi: 10.7554/eLife.49020. - DOI - PMC - PubMed

MeSH terms