

Changing epidemiology of chronic kidney disease as a result of type 2 diabetes mellitus from 1990 to 2017: Estimates from Global Burden of Disease 2017
- PMID: 32654341
- PMCID: PMC7926234
- DOI: 10.1111/jdi.13355
Changing epidemiology of chronic kidney disease as a result of type 2 diabetes mellitus from 1990 to 2017: Estimates from Global Burden of Disease 2017
Abstract
Aims/introduction: Type 2 diabetes mellitus has been a leading cause of chronic kidney disease (CKD), with a heterogeneous distribution worldwide. Optimal healthcare planning requires an understanding of how the burden of CKD as a result of type 2 diabetes mellitus has changed over time and geographic location, as well as the potential roles of sociodemographic, clinical and behavioral factors in these changes.
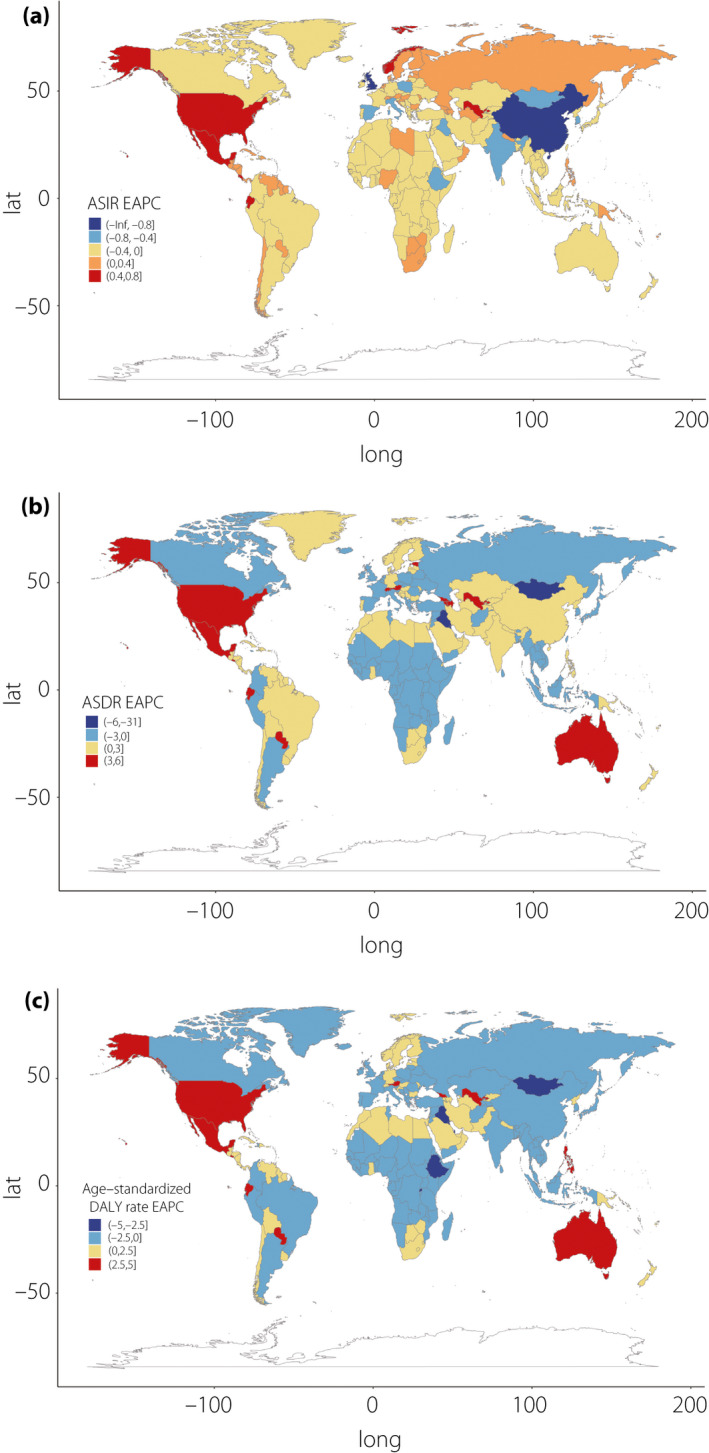
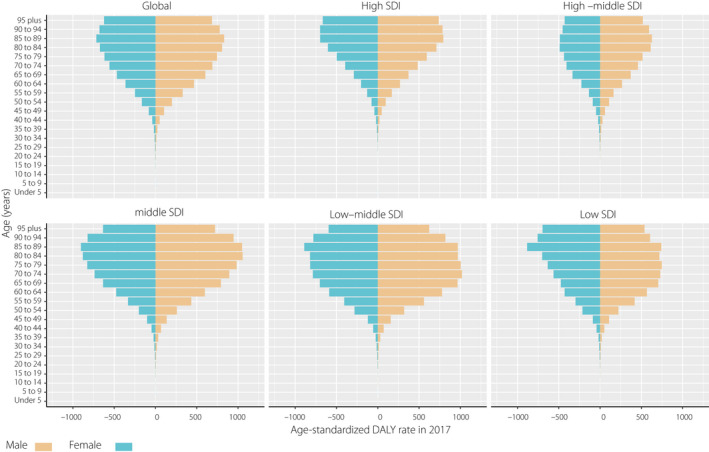
Materials and methods: We used the Global Burden of Disease data from 1990 to 2017 at the global, regional and national levels to investigate changes in the incidence, death and disability-adjusted life years of CKD as a result of type 2 diabetes mellitus, incorporating both epidemiological research and risk factor monitoring.
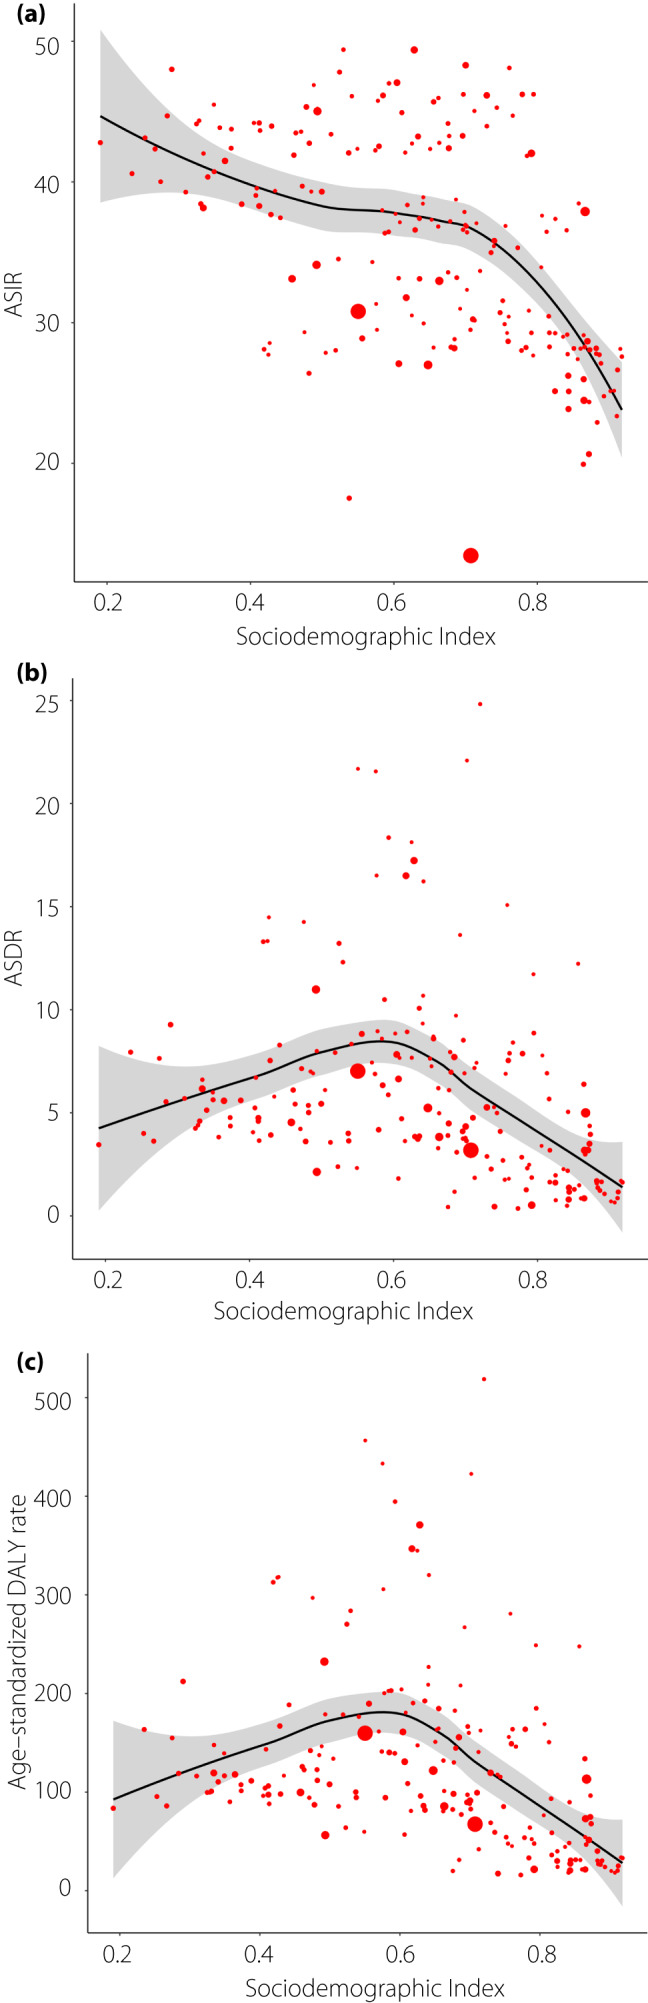
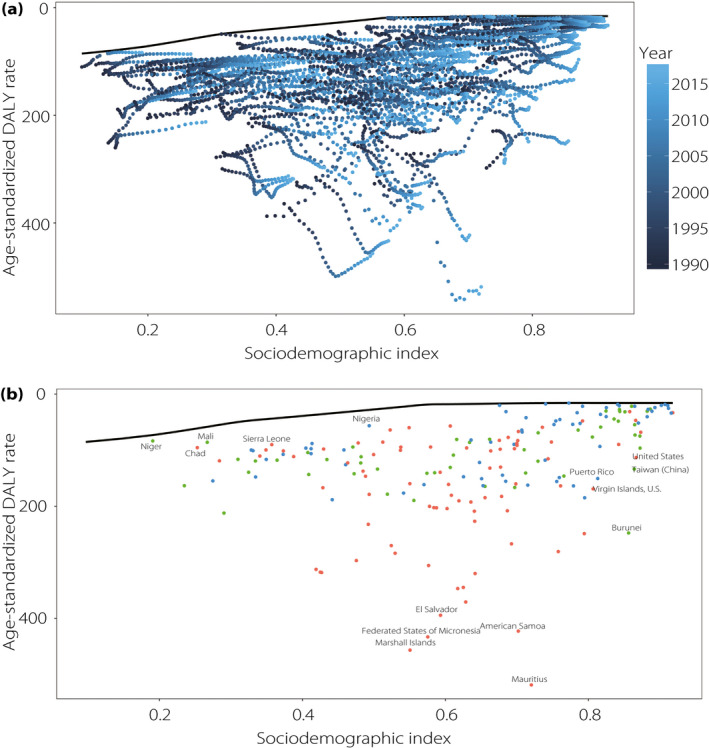
Results: The incident cases of CKD as a result of type 2 diabetes mellitus worldwide in 2017 had increased by 74% compared with 1990; total disability-adjusted life years had increased by 113%, mainly attributable to population expansion and demographic transition. The Sociodemographic Index was significantly and negatively correlated with overall CKD as a result of type 2 diabetes mellitus burden. However, in 82 countries and territories, the burden was not alleviated in parallel with socioeconomic development.
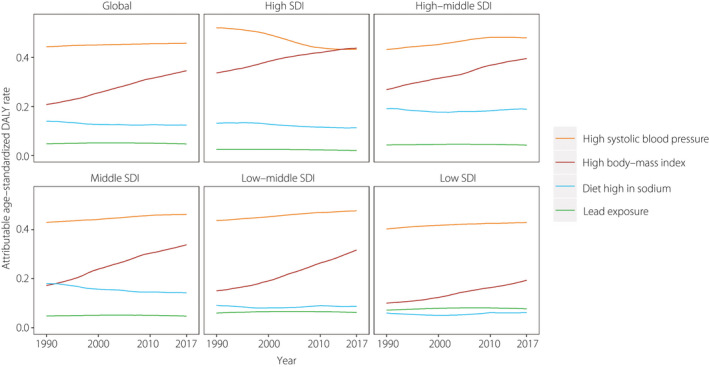
Conclusions: CKD as a result of type 2 diabetes mellitus has been the main contributor to the increasing burden of CKD over the past several decades. We suggest a more pragmatic approach focusing on early diagnosis, primary care and adequate follow up to reduce mortality and the long-term burden in low-to-middle Sociodemographic Index regions. Interventions should address high systolic blood pressure, as well as overweight and obesity problems, especially in high-income regions.
Keywords: Chronic kidney disease; Global Burden of Disease; Type 2 diabetes mellitus.
© 2020 The Authors. Journal of Diabetes Investigation published by Asian Association for the Study of Diabetes (AASD) and John Wiley & Sons Australia, Ltd.
Conflict of interest statement
The authors declare no conflict of interest.
Figures
References
-
- Zhang L, Long J, Jiang W, et al. Trends in chronic kidney disease in China. N Engl J Med 2016; 375: 905–906. - PubMed
-
- Fraser SDS, Roderick PJ. Kidney disease in the Global Burden of Disease Study 2017. Nat Rev Nephrol 2019; 15: 193–194. - PubMed
-
- Xie Y, Bowe B, Mokdad AH, et al. Analysis of the Global Burden of Disease study highlights the global, regional, and national trends of chronic kidney disease epidemiology from 1990 to 2016. Kidney Int 2018; 94: 567–581. - PubMed
-
- Jager KJ, Fraser SDS. The ascending rank of chronic kidney disease in the global burden of disease study. Nephrol Dial Transplant 2017; 32(suppl_2):ii121–ii128. - PubMed
-
- Wang F, Yang C, Long J, et al. Executive summary for the 2015 Annual Data Report of the China Kidney Disease Network (CK‐NET). Kidney Int 2019; 95: 501–505. - PubMed
MeSH terms
LinkOut - more resources
Full Text Sources
Medical
Miscellaneous
