. 2021 Feb;21(2):751-765.
doi: 10.1111/ajt.16196. Epub 2020 Aug 27.

Effects of body mass index on kidney transplant outcomes are significantly modified by patient characteristics

Affiliations

Effects of body mass index on kidney transplant outcomes are significantly modified by patient characteristics

Jesse D Schold et al. Am J Transplant. 2021 Feb.

Abstract

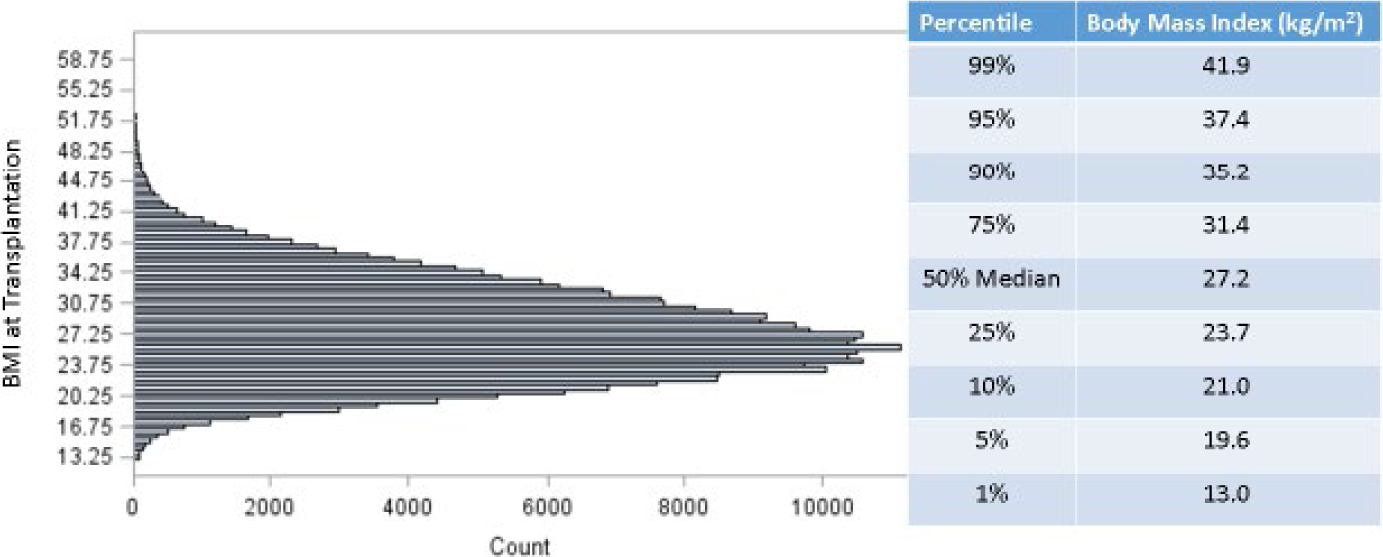
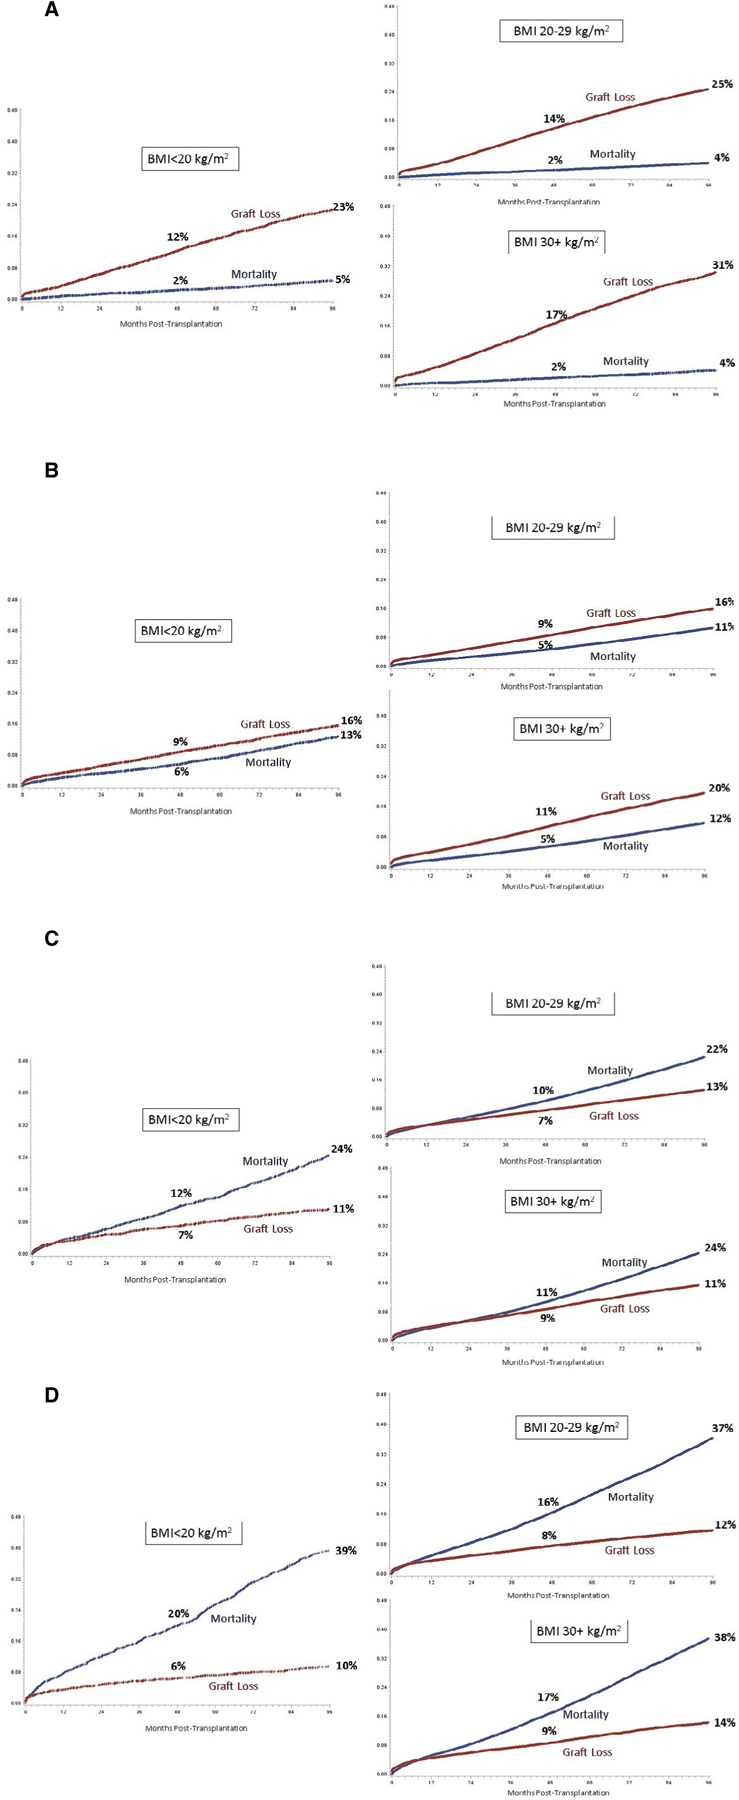
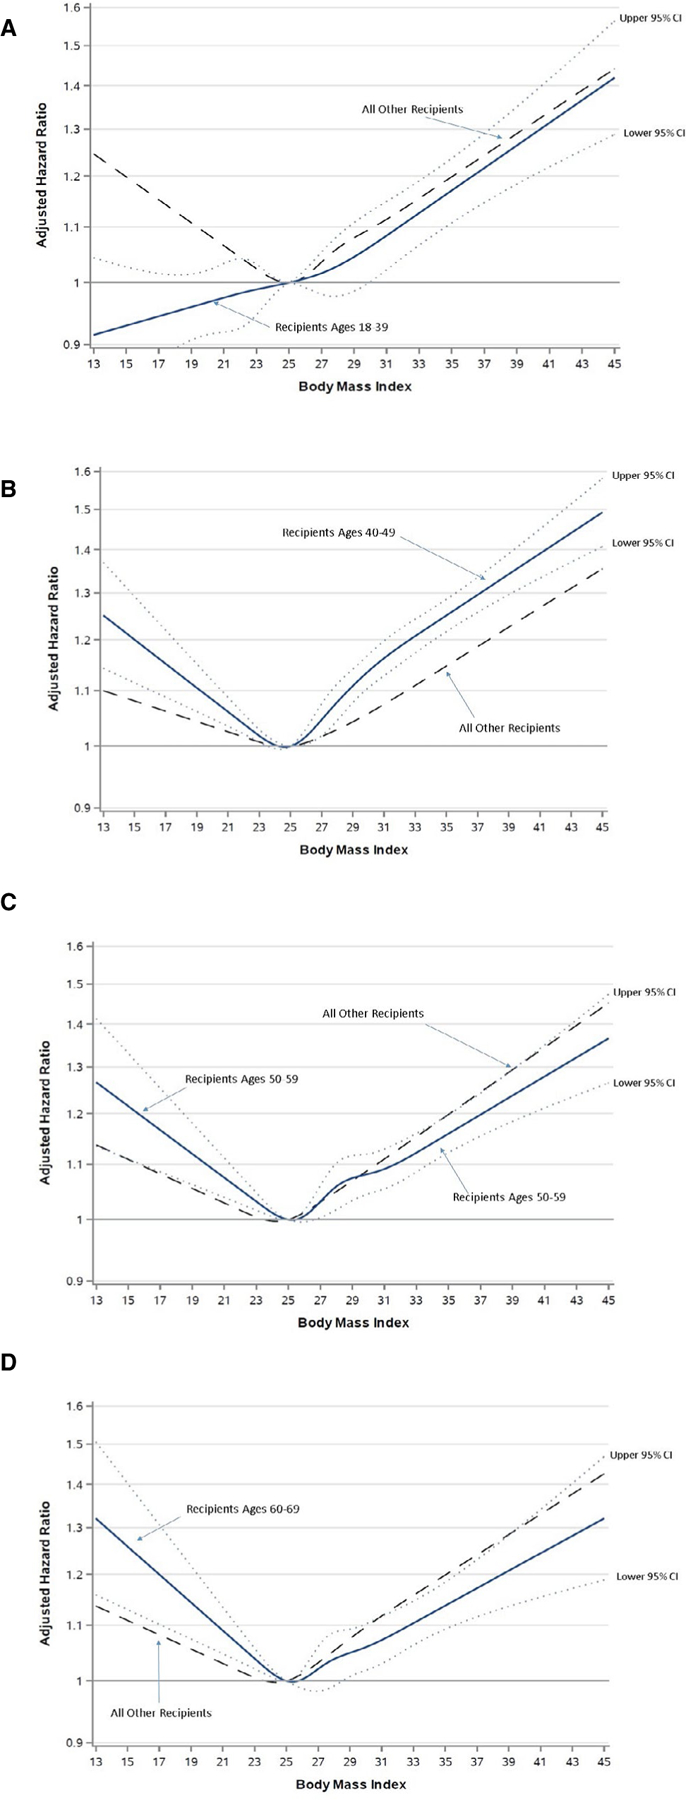
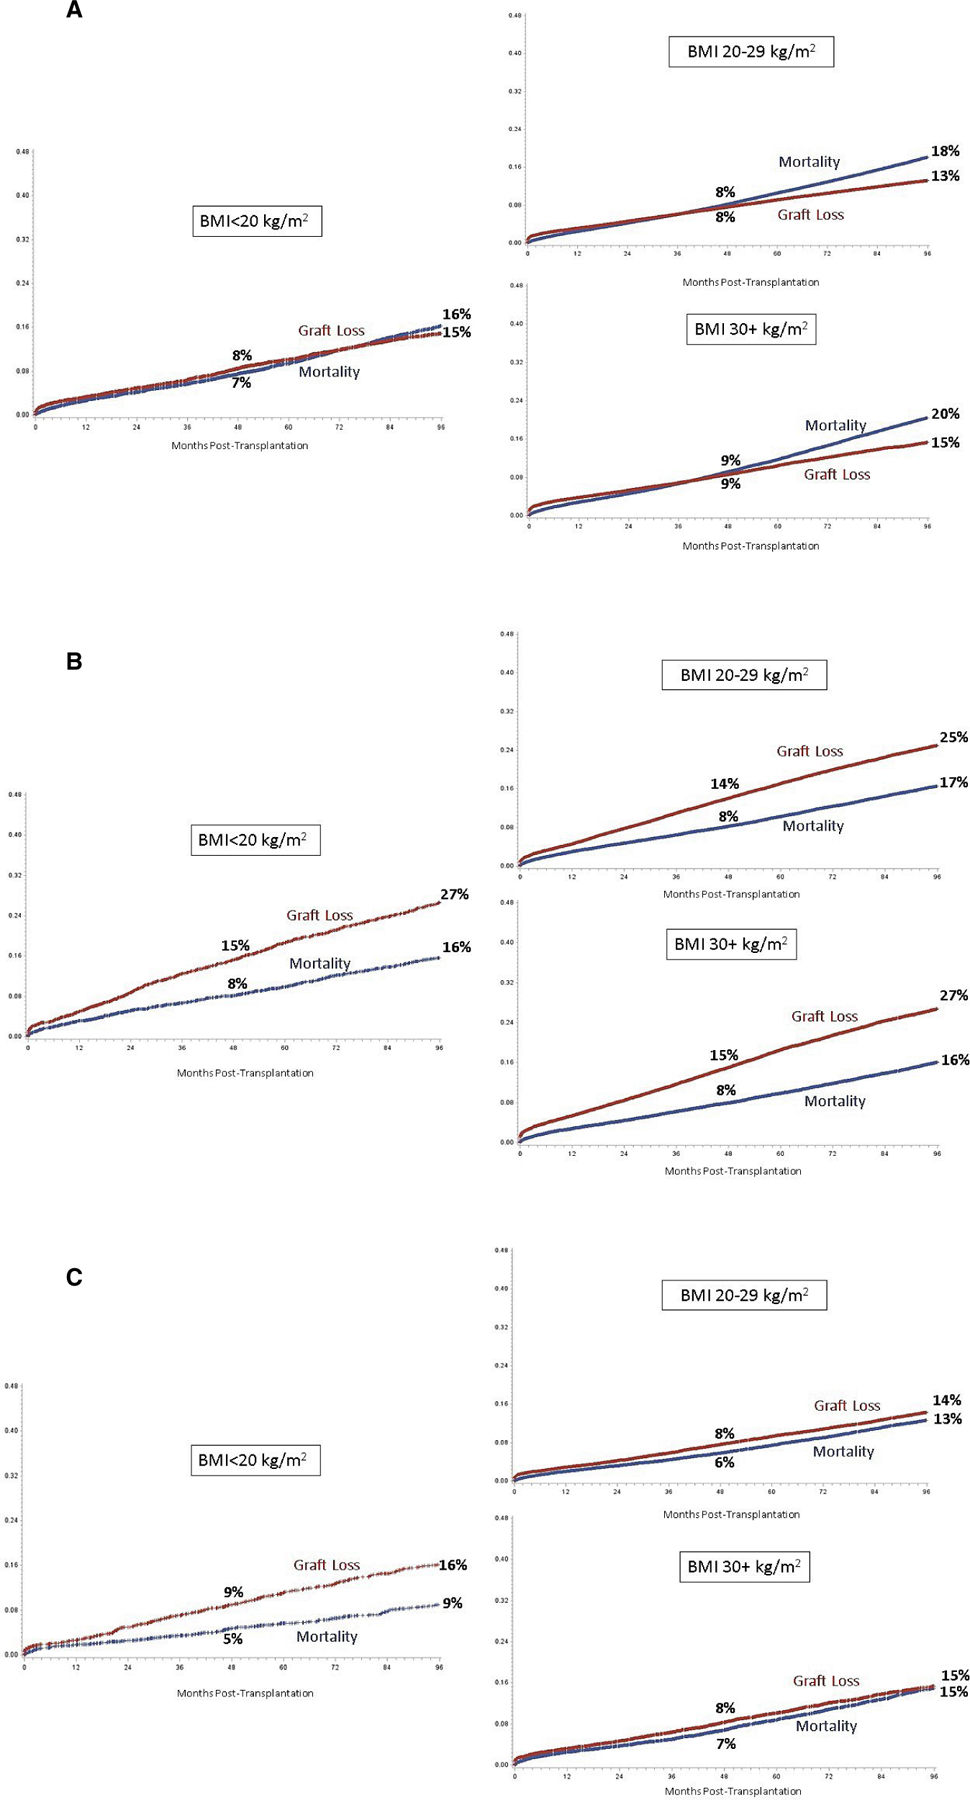
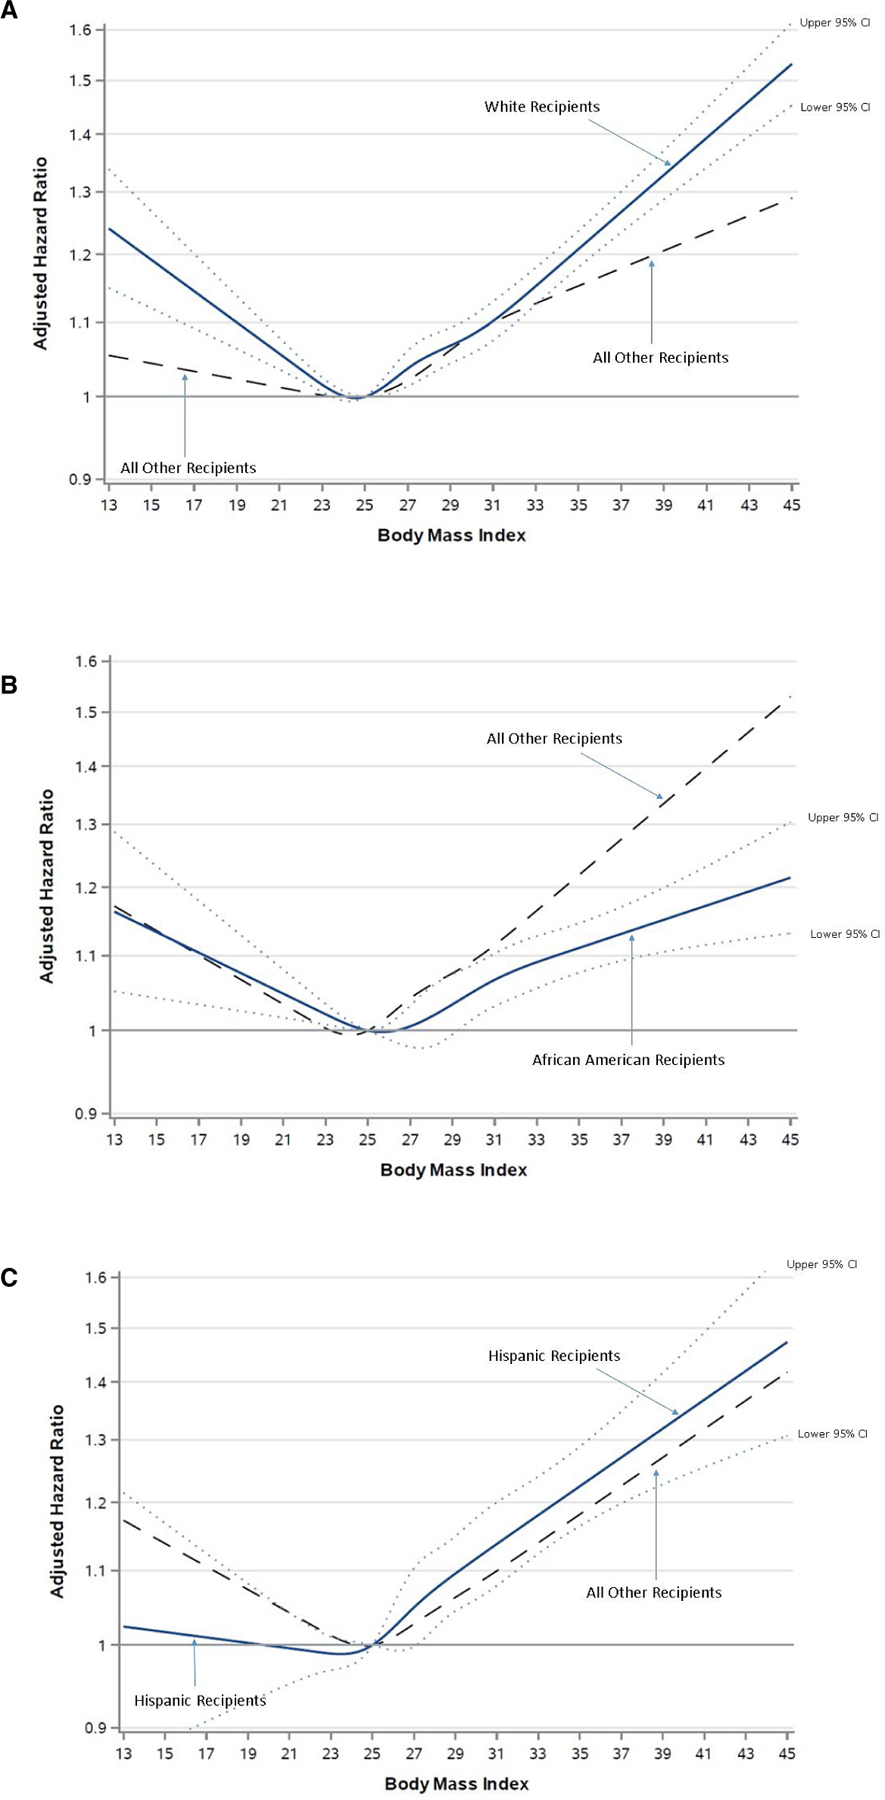
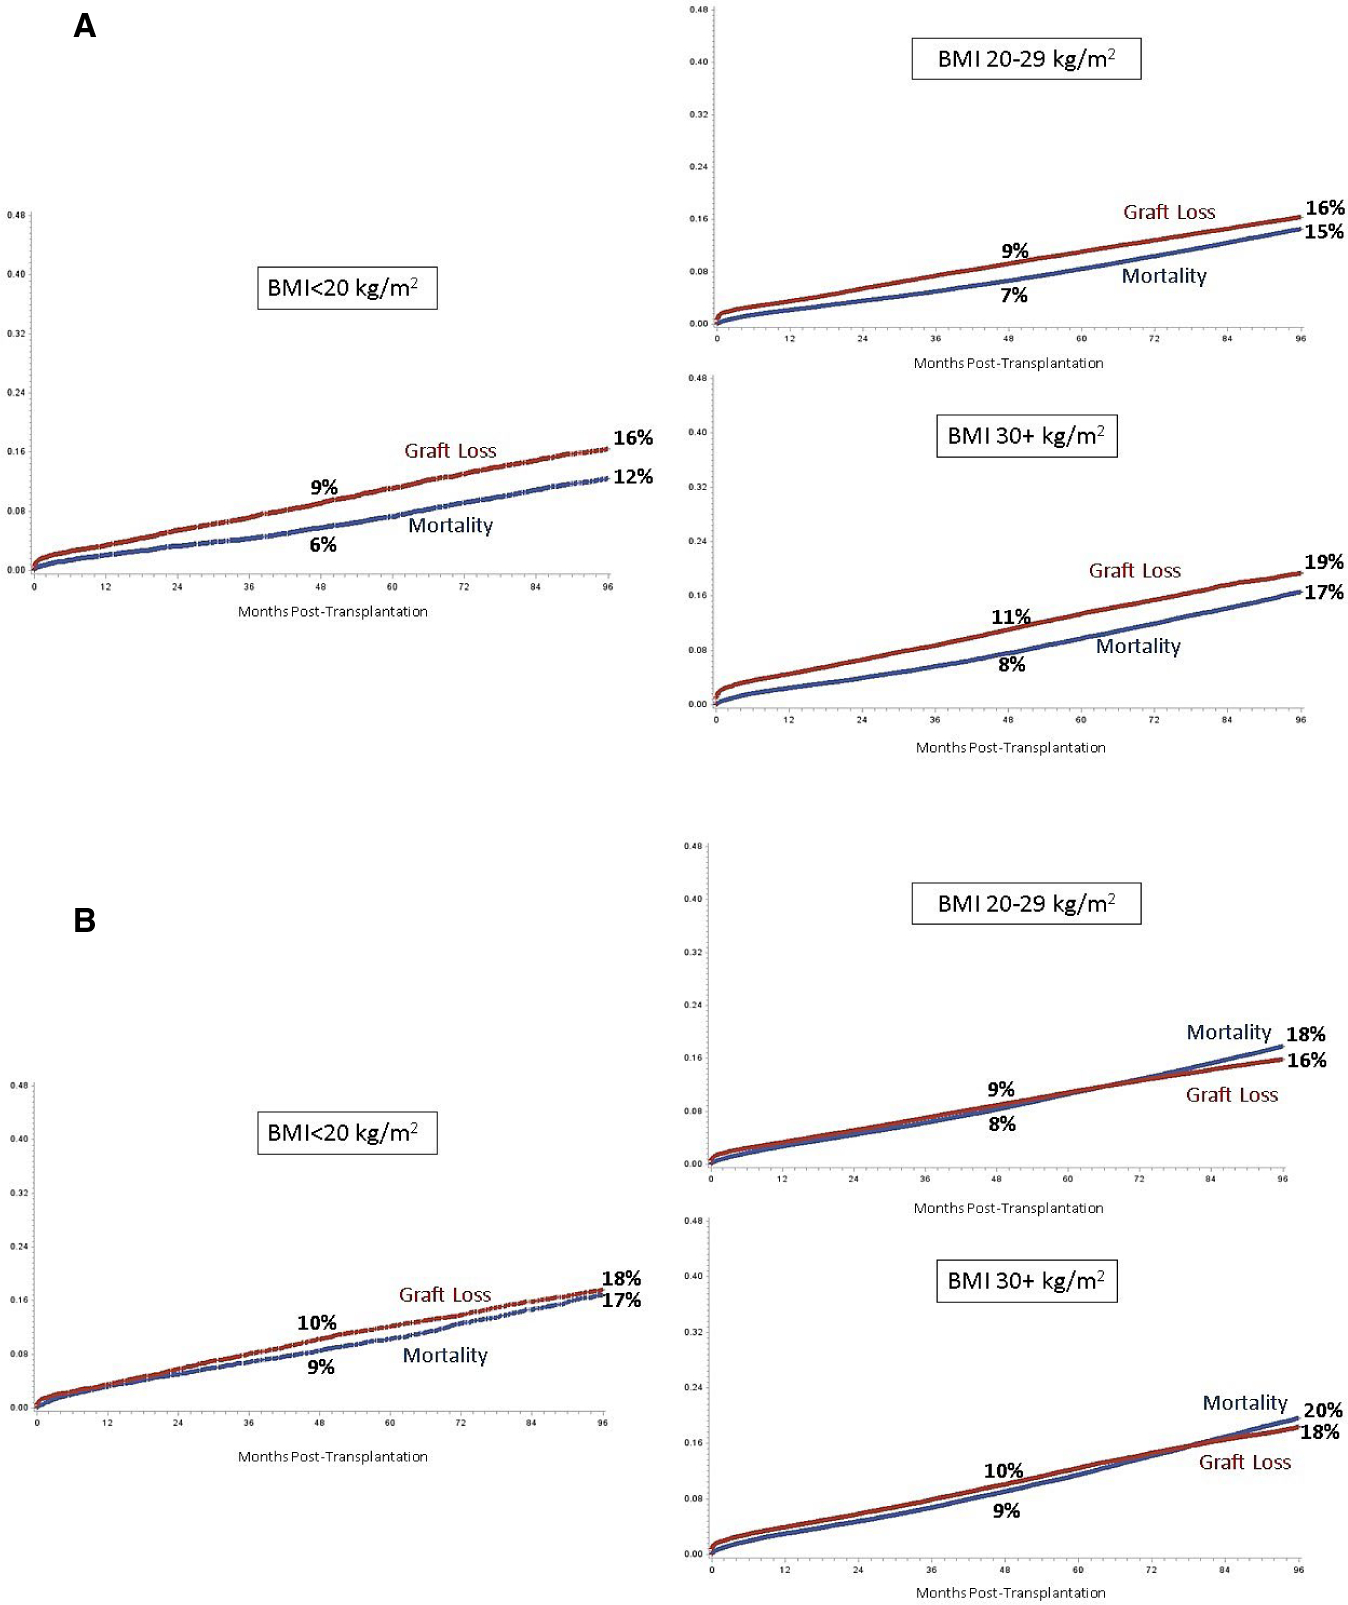
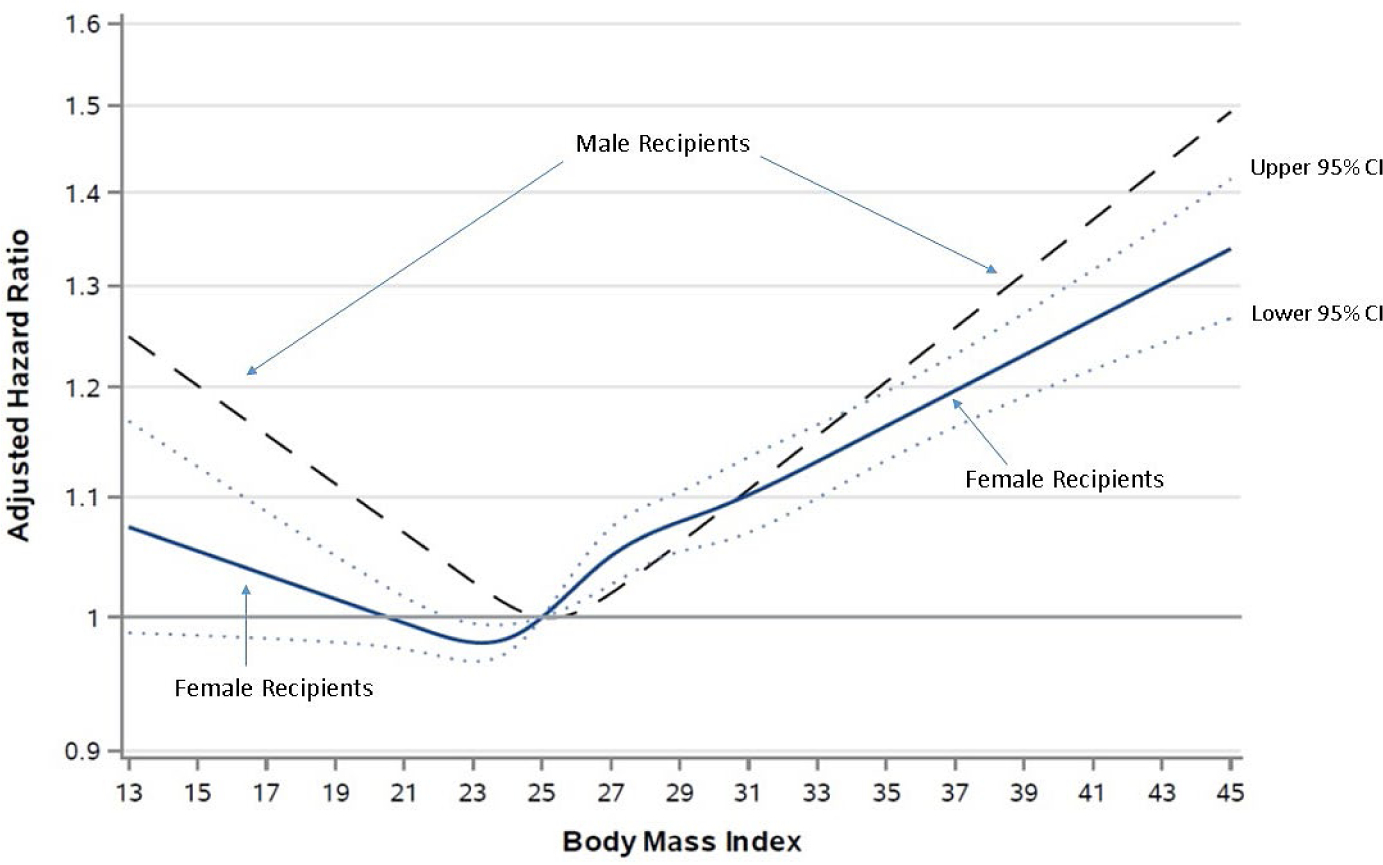
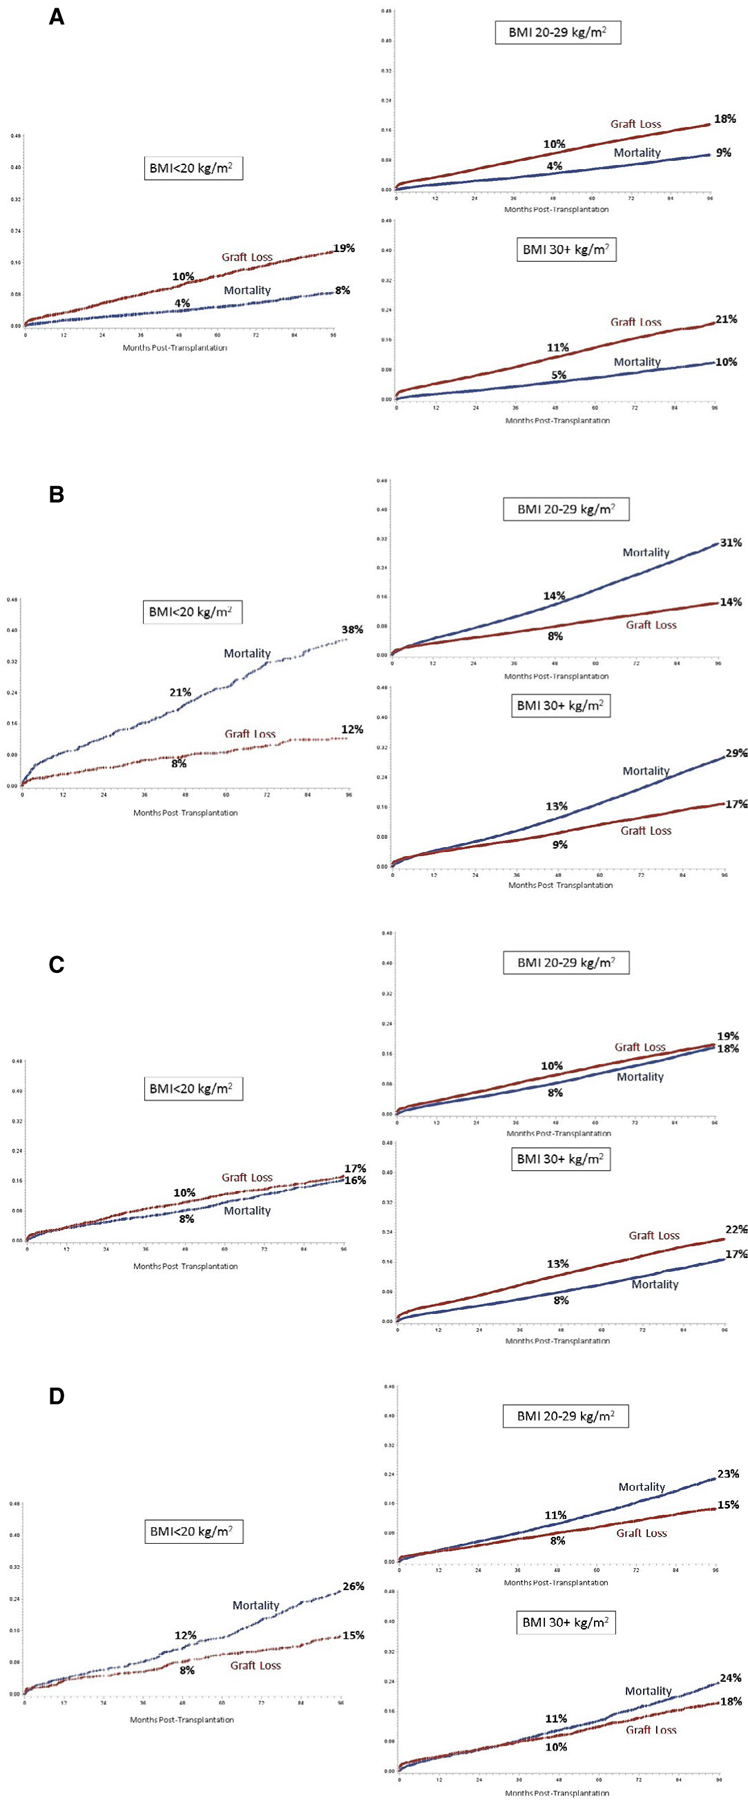
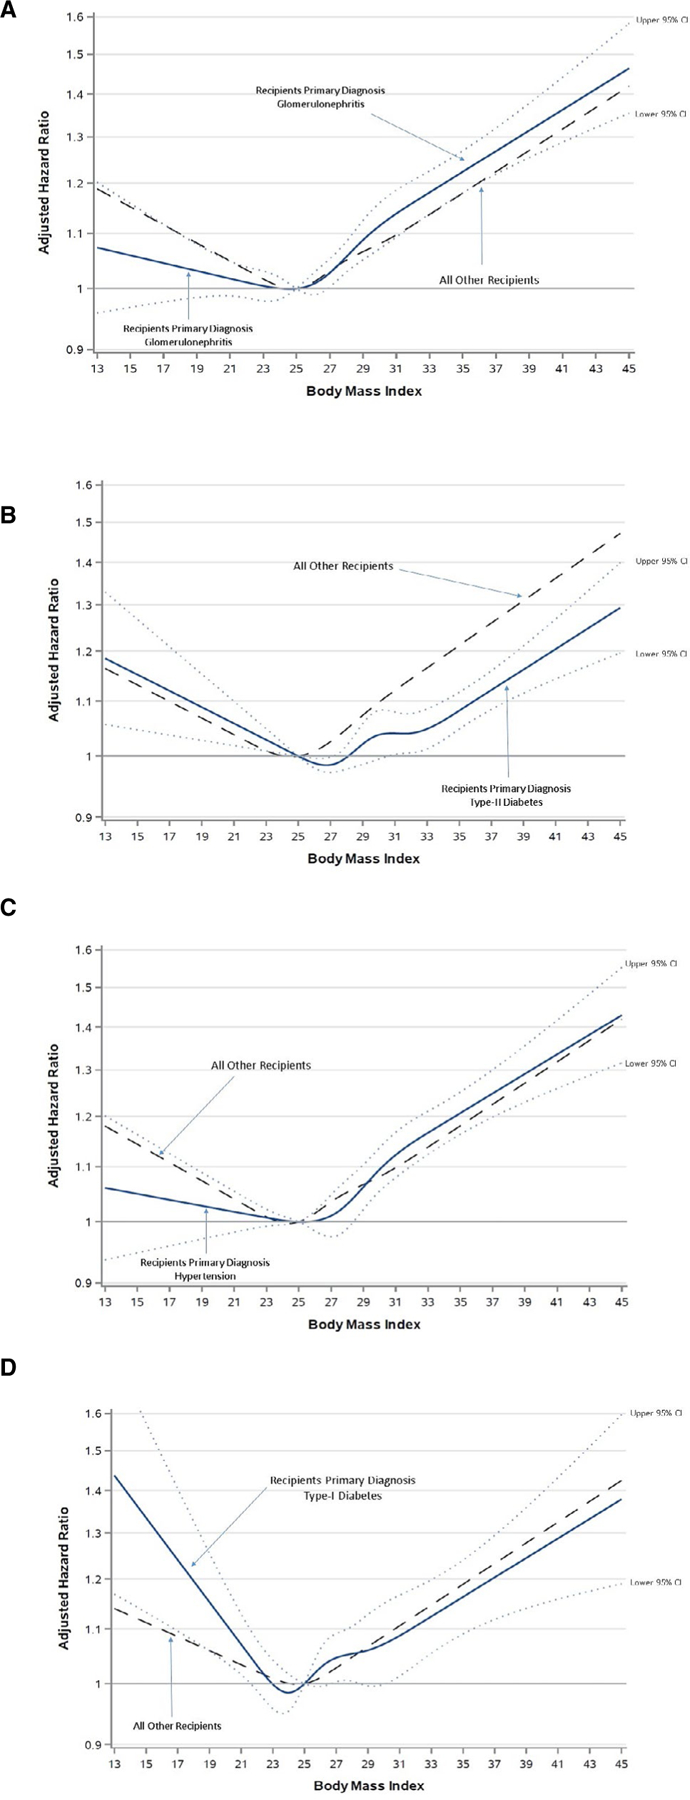
Body mass index (BMI) is a known risk factor associated with kidney transplant outcomes and is incorporated for determining transplant candidate eligibility. However, BMI is a coarse health measure and risks associated with BMI may vary by patient characteristics. We evaluated 296 807 adult (age > 17) solitary kidney transplant recipients from the Scientific Registry of Transplant Recipients (2000-2019). We examined effects of BMI using survival models and tested interactions with recipient characteristics. Overall, BMI demonstrated a "J-Shaped" risk profile with elevated risks for overall graft loss with low BMI and obesity. However, multivariable models indicated interactions between BMI with recipient age, diagnosis, gender, and race/ethnicity. Low BMI was relatively higher risk for older recipients (>60 years), people with type I diabetes, and males and demonstrated no additional risk among younger (18-39) and Hispanic recipients. High BMI was associated with elevated risk for Caucasians and attenuated risk among African Americans and people with type II diabetes. Effects of BMI had variable risks for mortality vs graft loss by recipient characteristics in competing risks models. The association of BMI with posttransplant outcomes is highly variable among kidney transplant recipients. Results are important considerations for personalized care and risk stratification. Findings suggest that transplant contraindications should not be based on absolute BMI thresholds but modified based on patient characteristics.

Keywords: clinical research/practice; diabetes: type 1; epidemiology; ethnicity/race; gender; graft survival; health services and outcomes research; kidney transplantation/nephrology.


Conflict of interest statement

DISCLOSURE

The authors of this manuscript have no conflict of interests to disclose as described by the American Journal of Transplantation.

Figures

FIGURE 1
FIGURE 1
Distribution of body mass index among adult transplant recipients 2000–2019 (n = 296 807) [Color figure can be viewed at wileyonlinelibrary.com]
FIGURE 2
FIGURE 2
Cumulative incidence of graft loss and mortality by recipient age from competing risks models. A, Recipients aged 18–39. Sample sizes for each body mass index (BMI) group: n = 6261, BMI < 20 kg/m2, n = 28 393, BMI 20–29 kg/m2, n = 9540, BMI 30+ kg/m2. B, Recipients aged 40–49. Sample sizes for each BMI group: n = 7052, BMI < 20 kg/m2, n = 75 696, BMI 20–29 kg/m2, n = 42 224, BMI 30+ kg/m2. C, Recipients aged 50–59. Sample sizes for each BMI group: n = 3137, BMI < 20 kg/m2, n = 47 038, BMI 20–29 kg/m2, n = 28 211, BMI 30+ kg/m2. D, Recipients aged 60+. Sample sizes for each BMI group: n = 1772, BMI < 20 kg/m2, n = 31 940, BMI 20–29 kg/m2, n = 15 543, BMI 30+ kg/m2 [Color figure can be viewed at wileyonlinelibrary.com]
FIGURE 3
FIGURE 3
Adjusted Hazard of BMI for overall graft loss by recipient age*. A, *models adjusted for age, race/ethnicity, gender, primary diagnosis, donor type, donor age, panel reactive antibody %, dialysis time prior to transplant, primary versus re-transplantation, HLA-mismatching, symptomatic cerebrovascular disease, symptomatic peripheral vascular disease, history of malignancy, drug-treated chronic obstructive pulmonary disease, year of transplant and primary insurance; P-value for interaction of BMI with age < 0.01. B, *models adjusted for age, race/ethnicity, gender, primary diagnosis, donor type, donor age, panel reactive antibody %, dialysis time prior to transplant, primary versus re-transplantation, HLA-mismatching, symptomatic cerebrovascular disease, symptomatic peripheral vascular disease, history of malignancy, drug-treated chronic obstructive pulmonary disease, year of transplant and primary insurance; P-value for interaction of BMI with age < 0.01. C, *models adjusted for age, race/ethnicity, gender, primary diagnosis, donor type, donor age, panel reactive antibody %, dialysis time prior to transplant, primary versus re-transplantation, HLA-mismatching, symptomatic cerebrovascular disease, symptomatic peripheral vascular disease, history of malignancy, drug-treated chronic obstructive pulmonary disease, year of transplant and primary insurance; P-value for interaction of BMI with age < 0.01. D, *models adjusted for age,race/ethnicity, gender, primary diagnosis, donor type, donor age, panel reactive antibody %, dialysis time prior to transplant, primary versus re-transplantation, HLA-mismatching, symptomatic cerebrovascular disease, symptomatic peripheral vascular disease, history of malignancy, drug-treated chronic obstructive pulmonary disease, year of transplant and primary insurance; P-value for interaction of BMI wth age < 0.01. [Color figure can be viewed at wileyonlinelibrary.com]
FIGURE 4
FIGURE 4
Cumulative incidence of graft loss and mortality by race/ethnicity from competing risks models. A, Non-hispanic Caucasian recipients. Sample sizes for each BMI group: n = 9410, BMI < 20 kg/m2, n = 94 858, BMI 20–29 kg/m2, n = 49 523, BMI 30+ kg/m2. B, African American recipients. Sample sizes for each BMI group: n = 3683, BMI < 20 kg/m2, n = 43 837, BMI 20–29 kg/m2, n = 28 763, BMI 30+ kg/m2. C, Hispanic recipients. Sample sizes for each BMI group: n = 2552, BMI < 20 kg/m2, n = 28 960, BMI 20–29 kg/m2, n = 13 002, BMI 30+ kg/m2 [Color figure can be viewed at wileyonlinelibrary.com]
FIGURE 5
FIGURE 5
Adjusted hazard of BMI for overall graft loss by race/ethnicity*. A, *models adjusted for age, race/ethnicity, gender, primary diagnosis, donor type, donor age, panel reactive antibody %, dialysis time prior to transplant, primary versus re-transplantation, HLA-mismatching, symptomatic cerebrovascular disease, symptomatic peripheral vascular disease, history of malignancy, drug-treated chronic obstructive pulmonary disease, year of transplant and primary insurance; P value for interaction of BMI with race/ethnicity < 0.01. B, *models adjusted for age, race/ethnicity, gender, primary diagnosis, donor type, donor age, panel reactive antibody %, dialysis time prior to transplant, primary versus re-transplantation, HLA-mismatching, symptomatic cerebrovascular disease, symptomatic peripheral vascular disease, history of malignancy, drug-treated chronic obstructive pulmonary disease, year of transplant and primary insurance; P value for interaction of BMI with race/ethnicity < 0.01. C, *models adjusted for age, race/ethnicity, gender, primary diagnosis, donor type, donor age, panel reactive antibody %, dialysis time prior to transplant, primary versus re-transplantation, HLA-mismatching, symptomatic cerebrovascular disease, symptomatic peripheral vascular disease, history of malignancy, drug-treated chronic obstructive pulmonary disease, year of transplant and primary insurance; P value for interaction of BMI with race/ethnicity < 0.01 [Color figure can be viewed at wileyonlinelibrary.com]
FIGURE 6
FIGURE 6
Cumulative incidence of graft loss and mortality by gender from competing risks models. A, Female recipeints. Sample sizes for each BMI group: n = 10 912, BMI < 20 kg/m2, n = 68 186, BMI 20–29 kg/m2, n = 38 223, BMI 30+ kg/m2. B, Male recipients. Sample sizes for each BMI group: n = 7310, BMI < 20 kg/m2, n=114 881, BMI 20–29 kg/m2, n = 57 295, BMI 30+ kg/m2 [Color figure can be viewed at wileyonlinelibrary.com]
FIGURE 7
FIGURE 7
Adjusted Hazard of BMI for overall graft loss by gender*. * models adjusted for age, race/ethnicity, gender, primary diagnosis, donor type, donor age, panel reactive antibody %, dialysis time prior to transplant, primary versus re-transplantation, HLA-mismatching, symptomatic cerebrovascular disease, symptomatic peripheral vascular disease, history of malignancy, drug-treated chronic obstructive pulmonary disease, year of transplant and primary insurance; P value for interaction of BMI with gender < 0.01 [Color figure can be viewed at wileyonlinelibrary.com]
FIGURE 8
FIGURE 8
Cumulative incidence of graft loss and mortality by primary diagnosis from competing risks models. A, Recipients with Primary Diagnosis of Glomerulonephritis. Sample sizes for each BMI group: n = 6430, BMI < 20 kg/m2, n = 49 310, BMI 20–29 kg/m2, n = 20 983, BMI 30+ kg/m2. B, Recipients with Primary Diagnosis of Type-II Diabetes. Sample sizes for each BMI group: n = 941, BMI<20 kg/m2, n = 30,515, BMI 20–29 kg/m2, n = 28,605, BMI 30+ kg/m2. C, Recipients with Primary Diagnosis of Hypertension. Sample sizes for each BMI group: n = 3125, BMI < 20 kg/m2, n = 38 573, BMI 20–29 kg/m2, n = 20 508, BMI 30+ kg/m2. D, Recipients with Primary Diagnosis of Type-I Diabetes. Sample sizes for each BMI group: n = 977, BMI < 20 kg/m2, n = 10 892, BMI 20–29 kg/m2, n = 4268, BMI 30+ kg/m2 [Color figure can be viewed at wileyonlinelibrary.com]
FIGURE 9
FIGURE 9
Association of body mass index (BMI) with overall graft loss by primary diagnosis. A, *models adjusted for age, race/ethnicity, gender, primary diagnosis, donor type, donor age, panel reactive antibody %, dialysis time prior to transplant, primary versus re-transplantation, HLA-mismatching, symptomatic cerebrovascular disease, symptomatic peripheral vascular disease, history of malignancy, drug-treated chronic obstructive pulmonary disease, year of transplant and primary insurance; P value for interaction of BMI with diagnosis < 0.01. B, *models adjusted for age, race/ethnicity, gender, primary diagnosis, donor type, donor age, panel reactive antibody %, dialysis time prior to transplant, primary versus re-transplantation, HLA-mismatching, symptomatic cerebrovascular disease, symptomatic peripheral vascular disease, history of malignancy, drug-treated chronic obstructive pulmonary disease, year of transplant and primary insurance; P value for interaction of BMI with diagnosis < 0.01. C, *models adjusted for age, race/ethnicity, gender, primary diagnosis, donor type, donor age, panel reactive antibody %, dialysis time prior to transplant, primary versus re-transplantation, HLA-mismatching, symptomatic cerebrovascular disease, symptomatic peripheral vascular disease, history of malignancy, drug-treated chronic obstructive pulmonary disease, year of transplant and primary insurance; P value for interaction of BMI with diagnosis < 0.01. D, *models adjusted for age, race/ethnicity, gender, primary diagnosis, donor type, donor age, panel reactive antibody %, dialysis time prior to transplant, primary versus re-transplantation, HLA-mismatching, symptomatic cerebrovascular disease, symptomatic peripheral vascular disease, history of malignancy, drug-treated chronic obstructive pulmonary disease, year of transplant and primary insurance; P value for interaction of BMI with diagnosis < 0.01. [Color figure can be viewed at wileyonlinelibrary.com]

References

    1. Berrington de Gonzalez A, Hartge P, Cerhan JR, et al. Body-mass index and mortality among 1.46 million white adults. N Engl J Med. 2010;363:2211–2219. - PMC - PubMed
    1. Strandberg TE, Stenholm S, Strandberg AY, et al. The “obesity paradox,” frailty, disability, and mortality in older men: a prospective, longitudinal cohort study. Am J Epidemiol. 2013;178:1452–1460. - PubMed
    1. Tobias DK, Pan AN, Jackson CL, et al. Body-mass index and mortality among adults with incident type 2 diabetes. N Engl J Med. 2014;370:233–244. - PMC - PubMed
    1. Kuehn B. Obesity rates increasing. JAMA. 2018;320:1632. - PubMed
    1. Gore JL, Pham PT, Danovitch GM, et al. Obesity and outcome following renal transplantation. Am J Transplant. 2006;6:357–363. - PubMed