. 2020 Jun 23:13:107.
doi: 10.3389/fnmol.2020.00107. eCollection 2020.

Effects of ASC Application on Endplate Regeneration Upon Glycerol-Induced Muscle Damage

Affiliations

Effects of ASC Application on Endplate Regeneration Upon Glycerol-Induced Muscle Damage

Matteo Rigon et al. Front Mol Neurosci. .

Abstract

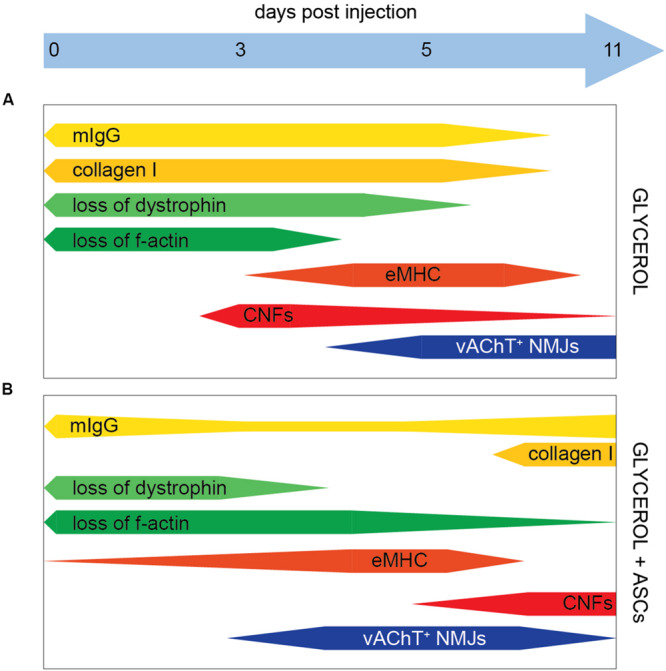
Amongst other approaches, adipose-derived stromal cells (ASCs) have recently been tested with respect to their regenerative capacity for treatment of neuromuscular disorders. While beneficial effects of ASCs on muscle recovery were observed previously, their impact on regeneration of neuromuscular junctions (NMJs) is unclear. Here, we used a murine glycerol damage model to study disruption and regeneration of NMJs and to evaluate the effects of systemic application of ASCs on muscle and NMJ recovery. In mice that were not treated with ASCs, a differential response of NMJ pre- and post-synapses to glycerol-induced damage was observed. While post-synapses were still present in regions that were necrotic and lacking actin and dystrophin, pre-synapses disappeared soon in those affected areas. Partial regeneration of NMJs occurred within 11 days after damage. ASC treatment slightly enhanced NMJ recovery and reduced the loss of presynaptic sites, but also led to a late phase of muscle necrosis and fibrosis. In summary, the results suggest a differential sensitivity of NMJ pre- and post-synapses to glycerol-induced muscle damage and that the use of ASC for the treatment of neuromuscular disorders needs further careful evaluation.

Keywords: ASC; NMJ; glycerol; regeneration; skeletal muscle.


Figures

FIGURE 1
FIGURE 1
Glycerol-induced muscle damage leads to early necrosis, loss of dystrophin and actin, transient eMHC appearance, and prolonged presence of center-nucleated fibers. TA muscles were injected with 20 μl of either saline or glycerol and then harvested and snap frozen after3, 5, 8, or 11 days post-injection (days p.i.). Upon cryosectioning, muscle slices were stained with DAPI and either antibodies against mouse IgG (mIgG), collagen I, dystrophin, or embryonic myosin heavy chain (eMHC), or with phalloidin-TRITC to label actin. Sections were analyzed by confocal microscopy. (A) Representative optical sections of fluorescence signals as indicated, nuclear DAPI staining always shown in blue, mIgG in yellow, collagen I and eMHC in red, dystrophin in green, actin in gray. CTRL, saline-injected muscles at 3 days p.i., the other panels depict glycerol-injected muscles at3, 5, and 11 days p.i., as indicated. Scalebar, 100 μm. (B) Quantitative analysis of section areas positive for fluorescence signals of either mIgG, collagen I, dystrophin, or actin, or number of eMHC-positive fibers, as a function of days p.i. Box–Whisker plots show all individual data points as dots, the extensions of upper and lower quartiles in the boxes, the medians as horizontal lines in the boxes, and maxima and minima as whiskers. *p ≤ 0.05, **p ≤ 0.01, ***p ≤ 0.001. (C,D) Quantitative analysis of fibers per muscle slice (C) or CNFs (% of fiber number, D) as a function of days p.i. Box–Whisker plots show all individual data points as dots, the extensions of upper and lower quartiles in the boxes, the medians as horizontal lines in the boxes, and maxima and minima as whiskers. **p ≤ 0.01, ***p ≤ 0.001.
FIGURE 2
FIGURE 2
Glycerol injection primarily affects pre-synapses. TA muscles were injected with 20 μl of either saline or glycerol and then harvested and snap frozen after 3, 5, 8, or 11 days (days p.i.). Upon cryosectioning, muscle slices were stained with αBGT (for AChR detection) and antibodies against VAChT to label post- and presynaptic portions of NMJs, respectively. Sections were analyzed by confocal microscopy. (A) Representative optical sections of fluorescence signals as indicated, αBGT in green, VAChT in red, yellow in overlay images indicates colocalization of both signals. CTRL, saline-injected muscles at 3 days p.i., the other panels depict glycerol-injected muscles at 3, 5, and 11 days p.i., as indicated. Scalebar, 100 μm. (B,C) Quantitative analysis of αBGT+ postsynaptic sites per slice (B) and VAChT+ NMJs (% of αBGT+ structures, C) as a function of days p.i. Shown is mean ± SEM (n = 3 muscles). *p ≤ 0.05, **p ≤ 0.01.
FIGURE 3
FIGURE 3
Systemic injection of ASCs induces a late phase of IgG infiltration, enhanced basal eMHC expression, and increase in center-nucleated fibers. Simultaneous to tail-vein injection of ASCs, TA muscles were injected with 20 μl of either saline or glycerol and then harvested and snap frozen after 3, 5, or 11 days (days p.i.). Upon cryosectioning, muscle slices were stained with DAPI and either antibodies against mouse IgG (mIgG), collagen I, dystrophin, or embryonic myosin heavy chain (eMHC), or with phalloidin-TRITC to label actin. Sections were analyzed by confocal microscopy. (A) Representative optical sections of fluorescence signals as indicated, nuclear DAPI staining always shown in blue, mIgG in yellow, collagen I and eMHC in red, dystrophin in green, actin in gray. CTRL, saline-injected muscles at 3 days p.i., the other panels depict glycerol-injected muscles at 3, 5, and 11 days p.i., as indicated. Scalebar, 100 μm. (B) Quantitative analysis of section areas positive for fluorescence signals of either mIgG, collagen I, dystrophin, or actin, or number of eMHC-positive fibers, as a function of days p.i. Box–Whisker plots show all individual data points as dots, the extensions of upper and lower quartiles in the boxes, the medians as horizontal lines in the boxes, and maxima and minima as whiskers. *p ≤ 0.05, **p ≤ 0.01, ***p ≤ 0.001, ****p ≤ 0.0001. (C,D) Quantitative analysis of fibers per muscle slice (C) or center-nucleated fibers (% of fiber number) as a function of days p.i. Box–Whisker plots show all individual data points as dots, the extensions of upper and lower quartiles in the boxes, the medians as horizontal lines in the boxes, and maxima and minima as whiskers. ***p ≤ 0.001.
FIGURE 4
FIGURE 4
ASCs enhance early recovery of presynaptic VAChT enrichment, but this effect is transient. Simultaneous to tail-vein injection of ASCs, TA muscles were injected with 20 μl of either saline or glycerol and then harvested and snap frozen after 3, 5, or 11 days (days p.i.). Upon cryosectioning, muscle slices were stained with αBGT (for AChR detection) and antibodies against VAChT to label post- and presynaptic portions of NMJs, respectively. Sections were analyzed by confocal microscopy. (A) Representative optical sections of fluorescence signals as indicated, αBGT in green, VAChT in red, yellow in overlay images indicates colocalization of both signals. CTRL, saline-injected muscles at 3 days p.i., the other panels depict glycerol-injected muscles at 3, 5, and 11 days p.i., as indicated. Scalebar, 100 μm. (B,C) Quantitative analysis of αBGT+ postsynaptic sites per slice (B) and of VAChT+ NMJs (% of αBGT+ structures, C) as a function of days p.i. Shown is mean ± SEM (n = 3 muscles). *p ≤ 0.05, **p ≤ 0.01.
FIGURE 5
FIGURE 5
Schematic summary of glycerol and ASC effects. Bars indicate the presence of markers as indicated, the relative amount is shown by the bar width. (A,B) In the presence of Glycerol and Glycerol + ASC, respectively.

References

    1. Allard J., Li K., Lopez X., Blanchard S., Barbot P., Rorive S., et al. (2014). Immunohistochemical toolkit for tracking and quantifying xenotransplanted human stem cells. Regenerat. Med. 9 437–452. 10.2217/rme.14.26.Immunohistochemical - DOI - PMC - PubMed
    1. Anderson J., Mai-khoi Q., Daneshvar T., Suzuki J., Dort W., Mizunoya K., et al. (2017). The role of semaphorin3A in myogenic regeneration and the formation of functional neuromuscular junctions on new fibres. Biol. Rev. 92 1389–1405. 10.1111/brv.12286 - DOI - PubMed
    1. Arecco N., Clarke F. K., Jones D. M., Simpson D., Mason R. J., Beynon M., et al. (2016). Elastase levels and activity are increased in dystrophic muscle and impair myoblast cell survival, proliferation and differentiation. Sci. Rep. 6 1–20. 10.1038/srep24708 - DOI - PMC - PubMed
    1. Arnold L., Henry F., Poron Y., Baba-Amer Y., Van Rooijen N., Plonquet R., et al. (2007). Inflammatory monocytes recruited after skeletal muscle injury switch into antiinflammatory macrophages to support myogenesis. J. Exp. Med. 204 1057–1069. 10.1084/jem.20070075 - DOI - PMC - PubMed
    1. Arsic N., Zacchigna L., Zentilin G., Ramirez-Correa L., Salvi G., Sinagra U., et al. (2004). Vascular endothelial growth factor stimulates skeletal muscle regeneration in vivo. Mol. Ther. 10 844–854. 10.1016/j.ymthe.2004.08.007 - DOI - PubMed