

Food Quantity Discrimination in Angelfish (Pterophyllum scalare): The Role of Number, Density, Size and Area Occupied by the Food Items
- PMID: 32655384
- PMCID: PMC7324792
- DOI: 10.3389/fnbeh.2020.00106
Food Quantity Discrimination in Angelfish (Pterophyllum scalare): The Role of Number, Density, Size and Area Occupied by the Food Items
Abstract
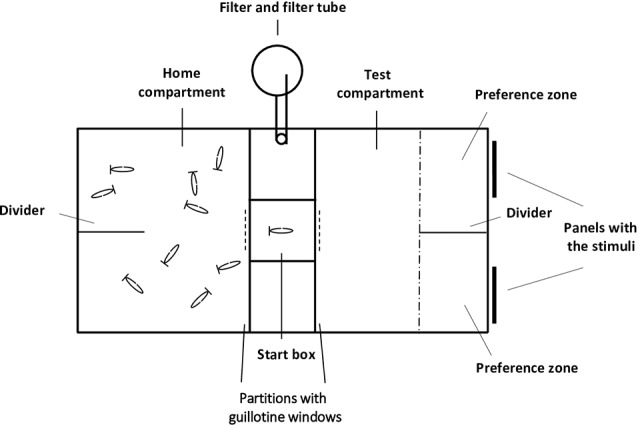
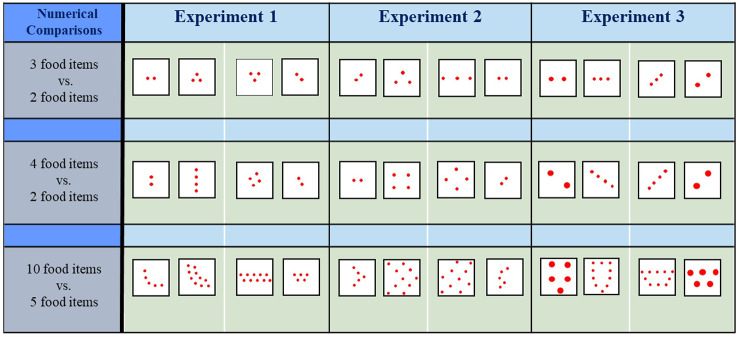
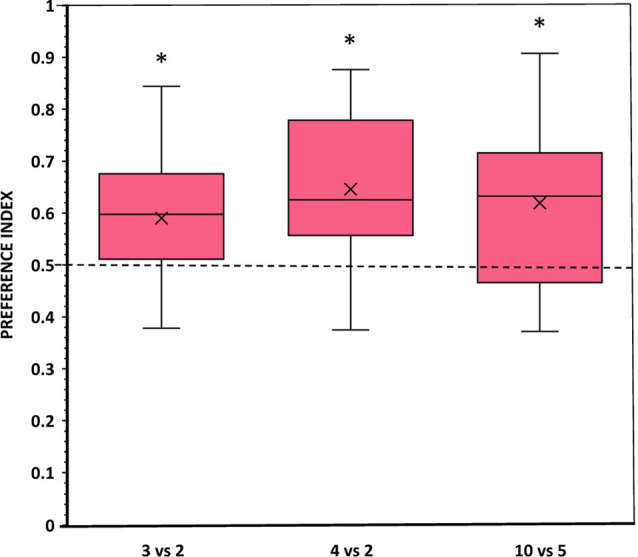
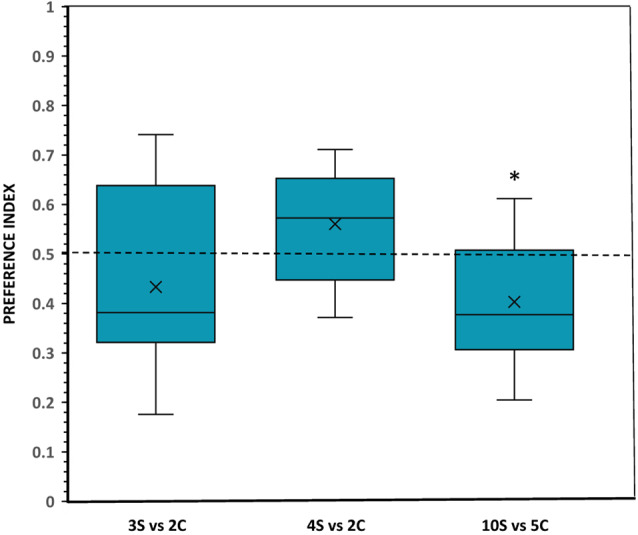
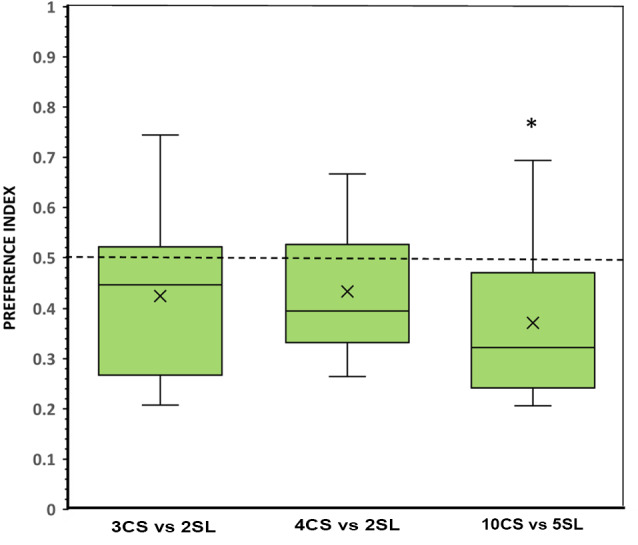
Quantity discrimination, the ability to identify, process, and respond to differences in number, has been shown in a variety of animal species and may have fitness value. In fish, the ability to distinguish between numerically different shoals has been well studied. However, little work has been devoted to the investigation of such ability in a foraging context. Nevertheless, angelfish (Pterophyllum scalare) have been previously shown to be able to discriminate numerically different sets of food items, with variables such as size and density of the food items playing important roles in making the choice. Here, we examine the possible role of other numerical and non-numerical variables. Using a spontaneous binary choice task, we contrasted sets of food items differing in specifically controlled ways: (1) different numerical size but equal inter-item distance; (2) different numerical size and different inter-item distance; and (3) identical total contour length and area occupied but different individual food size and inter-food distance between the contrasted food sets. In Experiment 1, angelfish were found to prefer the sets with a large number of food items. In Experiment 2, they preferred the numerically smaller sets with clustered items to the numerically larger sets with scattered items, but only when the sets were in the large number range (10 vs. 5 food items). Finally, in Experiment 3 fish preferred numerically smaller sets with large-sized and scattered food items in the large number range sets. We conclude that food item number, density, and size may not be considered individually by angelfish, but instead, the fish respond to all these factors attempting to maximize energy gained from eating the food while minimizing energy expenditure collecting and/or protecting the food.
Keywords: angelfish; continuous variables; fish cognition; foraging; quantity discrimination.
Copyright © 2020 Gómez-Laplaza and Gerlai.
Figures
Similar articles
-
The role of item size on choosing contrasted food quantities in angelfish (Pterophyllum scalare).Sci Rep. 2019 Oct 25;9(1):15305. doi: 10.1038/s41598-019-51753-1. Sci Rep. 2019. PMID: 31653899 Free PMC article.
-
Food density and preferred quantity: discrimination of small and large numbers in angelfish (Pterophyllum scalare).Anim Cogn. 2020 May;23(3):509-522. doi: 10.1007/s10071-020-01355-6. Epub 2020 Feb 3. Anim Cogn. 2020. PMID: 32009216
-
Quantity discrimination in angelfish (Pterophyllum scalare) is maintained after a 30-s retention interval in the large but not in the small number range.Anim Cogn. 2017 Sep;20(5):829-840. doi: 10.1007/s10071-017-1104-8. Epub 2017 Jun 15. Anim Cogn. 2017. PMID: 28620776
-
Understanding behaviour to improve the welfare of an ornamental fish.J Fish Biol. 2021 Sep;99(3):726-739. doi: 10.1111/jfb.14802. Epub 2021 Jun 15. J Fish Biol. 2021. PMID: 34076258 Review.
-
Numerical abilities in fish: A methodological review.Behav Processes. 2017 Aug;141(Pt 2):161-171. doi: 10.1016/j.beproc.2017.02.001. Epub 2017 Feb 3. Behav Processes. 2017. PMID: 28167200 Review.
Cited by
-
Zebrafish Shoaling, Its Behavioral and Neurobiological Mechanisms, and Its Alteration by Embryonic Alcohol Exposure: A Review.Front Behav Neurosci. 2020 Sep 25;14:572175. doi: 10.3389/fnbeh.2020.572175. eCollection 2020. Front Behav Neurosci. 2020. PMID: 33100980 Free PMC article. Review.
-
First Ever Whole Genome Sequencing and De Novo Assembly of the Freshwater Angelfish, Pterophyllum scalare.MicroPubl Biol. 2022 Oct 18;2022:10.17912/micropub.biology.000654. doi: 10.17912/micropub.biology.000654. eCollection 2022. MicroPubl Biol. 2022. PMID: 36338153 Free PMC article.
-
The Sense of Number in Fish, with Particular Reference to Its Neurobiological Bases.Animals (Basel). 2021 Oct 27;11(11):3072. doi: 10.3390/ani11113072. Animals (Basel). 2021. PMID: 34827804 Free PMC article. Review.
-
Video playback versus live stimuli to assess quantity discrimination in angelfish (Pterophyllum scalare).Behav Res Methods. 2022 Oct;54(5):2433-2444. doi: 10.3758/s13428-021-01738-8. Epub 2021 Dec 16. Behav Res Methods. 2022. PMID: 34918227 Free PMC article.
-
Elemental and Configural Associative Learning in Spatial Tasks: Could Zebrafish be Used to Advance Our Knowledge?Front Behav Neurosci. 2020 Dec 17;14:570704. doi: 10.3389/fnbeh.2020.570704. eCollection 2020. Front Behav Neurosci. 2020. PMID: 33390911 Free PMC article.
References
LinkOut - more resources
Full Text Sources