. 2020 Jul 3;6(27):eaaz4012.
doi: 10.1126/sciadv.aaz4012. eCollection 2020 Jul.

Three-dimensional chromatin interactions remain stable upon CAG/CTG repeat expansion

Affiliations

Three-dimensional chromatin interactions remain stable upon CAG/CTG repeat expansion

Gustavo A Ruiz Buendía et al. Sci Adv. .

Abstract

Expanded CAG/CTG repeats underlie 13 neurological disorders, including myotonic dystrophy type 1 (DM1) and Huntington's disease (HD). Upon expansion, disease loci acquire heterochromatic characteristics, which may provoke changes to chromatin conformation and thereby affect both gene expression and repeat instability. Here, we tested this hypothesis by performing 4C sequencing at the DMPK and HTT loci from DM1 and HD-derived cells. We find that allele sizes ranging from 15 to 1700 repeats displayed similar chromatin interaction profiles. This was true for both loci and for alleles with different DNA methylation levels and CTCF binding. Moreover, the ectopic insertion of an expanded CAG repeat tract did not change the conformation of the surrounding chromatin. We conclude that CAG/CTG repeat expansions are not enough to alter chromatin conformation in cis. Therefore, it is unlikely that changes in chromatin interactions drive repeat instability or changes in gene expression in these disorders.


Figures

Fig. 1
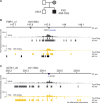
Fig. 1. Chromatin interactions of the FMR1 locus in unaffected and FXS patient cells.
(A) Pedigree of the unaffected and FXS patient cell lines used. (B) 4C-seq chromatin interaction profiles (average of triplicate smoothed and normalized counts) from the FMR1_u1 viewpoint (1 kb upstream of the CGG repeats of FMR1, gray central triangle) in one unaffected (UN-A) and one FXS patient cell lines (FXS). The top blue arrow represents the FMR1 gene and the left-side triangle represents the location of the FMR1_u195 4C viewpoint. The interaction profiles for the FMR1_u195 viewpoint (195 kb upstream of the CGG repeats of FMR1) can be found in fig. S2. (C) 4C-seq chromatin interaction profiles (average of triplicate smoothed and normalized counts) from the ACTA1 viewpoint (central purple triangle). The top blue bar represents the ACTA1 gene. For (B) and (C), high-interacting regions were called using 4C-ker and significant interactions were called using FourCSeq. Regions of differential interactions compared to UN-A are marked with black bars below each 4C-seq track and labeled as “diff. int.”. 4C vps, viewpoints used for 4C-seq.
Fig. 2
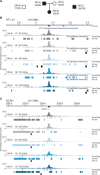
Fig. 2. Chromatin interactions of the HTT locus in unaffected and HD patient cells.
(A) Pedigree of the unaffected and HD patient cell lines used. (B) 4C-seq chromatin interaction profiles (average of triplicate smoothed and normalized counts) from the HTT_d1 viewpoint (1 kb downstream of the CAG repeats of HTT, red central triangle) in two unaffected (UN-B and UN-C) and three HD patient cell lines (HD-A, HD-B, and HD-C). The top blue arrow represents the HTT gene and the triangles represent the location of both HTT viewpoints. The interaction profiles for the HTT_d85 viewpoint (85 kb downstream of the CAG repeats) can be found in fig. S4. (C) 4C-seq chromatin interaction profiles (average of triplicate smoothed and normalized counts) from the ACTA1 viewpoint (central purple triangle). The top blue bar represents the ACTA1 gene. For (B) and (C), high-interacting regions were called using 4C-ker and significant interactions were called using FourCSeq. Regions of differential interactions compared to UN-B are marked with black bars below each 4C-seq track and labeled as “diff. int.”.
Fig. 3
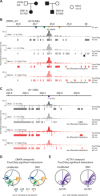
Fig. 3. Chromatin interactions of the DMPK locus in unaffected and DM1 patient cells.
(A) Pedigree of the unaffected and DM1 patient cell lines used. (B) 4C-seq chromatin interaction profiles (average of triplicate smoothed and normalized counts) from the DMPK_d11 viewpoint (11 kb downstream of the CTG repeats of DMPK, yellow triangle) in two unaffected (UN-B and UN-C) and two DM1 patient cell lines (DM1-A and DM1-B). The top blue arrow represents the DMPK gene and the triangles represent the location of the four DMPK viewpoints. The profiles for the three other viewpoints can be found in fig. S7. (C) 4C-seq chromatin interaction profiles (average of triplicate smoothed and normalized counts) from the ACTA1 viewpoint (central purple triangle) in two unaffected and two DM1 patient cell lines. The top blue bar represents the ACTA1 gene. For (B) and (C), high-interacting regions were called using 4C-ker and significant interactions were called using FourCSeq. Regions of differential interactions compared to UN-B are marked with black bars below each 4C-seq track and labeled as “diff. int.”. (D) Circos plot of the significant interactions called with FourCSeq (nominal P < 0.05) from four different viewpoints surrounding the CTG repeats of DMPK in the unaffected and DM1 cell lines (left and right, respectively) (DMPK_u65 in blue, DMPK_u16 in green, DMPK_d11 in yellow, and DMPK_d73 in orange; 65 kb upstream, 16 kb upstream, 11 kb downstream, and 73 kb downstream, respectively). (E) Circos plot of the significant interactions called with FourCSeq (nominal P < 0.05) from the control ACTA1 viewpoint in unaffected and DM1 cell lines (left and right, respectively).
Fig. 4
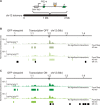
Fig. 4. Chromatin interactions of an expanded CAG repeat locus in isogenic cells.
(A) Diagram of the integration site of the CAG ectopic locus in GFP(CAG)15 and GFP(CAG)270 cells. (B) 4C-seq chromatin interaction profiles (average of triplicate smoothed and normalized counts) from the GFP viewpoint in GFP(CAG)15 (top) and GFP(CAG)270 (bottom) in cells without active transcription of the ectopic CAG locus. Regions of differential interactions compared to GFP(CAG)15 are marked with black bars below the GFP(CAG)270 4C-seq track. (C) 4C-seq chromatin interactions from the GFP viewpoint in GFP(CAG)15 (top) and GFP(CAG)270 (bottom) in cells treated with doxycycline for 5 days to induce transcription of the ectopic CAG locus. Regions of differential interactions compared to GFP(CAG)15 are marked with black bars below the GFP(CAG)270 4C-seq track.

References

    1. Beagan J. A., Phillips-Cremins J. E., On the existence and functionality of topologically associating domains. Nat. Genet. 52, 8–16 (2020). - PMC - PubMed
    1. Bickmore W. A., van Steensel B., Genome architecture: Domain organization of interphase chromosomes. Cell 152, 1270–1284 (2013). - PubMed
    1. Kempfer R., Pombo A., Methods for mapping 3D chromosome architecture. Nat. Rev. Genet. 21, 207–226 (2020). - PubMed
    1. Ibrahim D. M., Mundlos S., Three-dimensional chromatin in disease: What holds us together and what drives us apart? Curr. Opin. Cell Biol. 64, 1–9 (2020). - PubMed
    1. Dion V., Wilson J. H., Instability and chromatin structure of expanded trinucleotide repeats. Trends Genet. 25, 288–297 (2009). - PMC - PubMed

Publication types