. 2020 Jan;1(1):28-45.
doi: 10.1038/s43018-019-0006-x. Epub 2020 Jan 13.

L1CAM defines the regenerative origin of metastasis-initiating cells in colorectal cancer

Affiliations

L1CAM defines the regenerative origin of metastasis-initiating cells in colorectal cancer

Karuna Ganesh et al. Nat Cancer. 2020 Jan.

Erratum in

Abstract

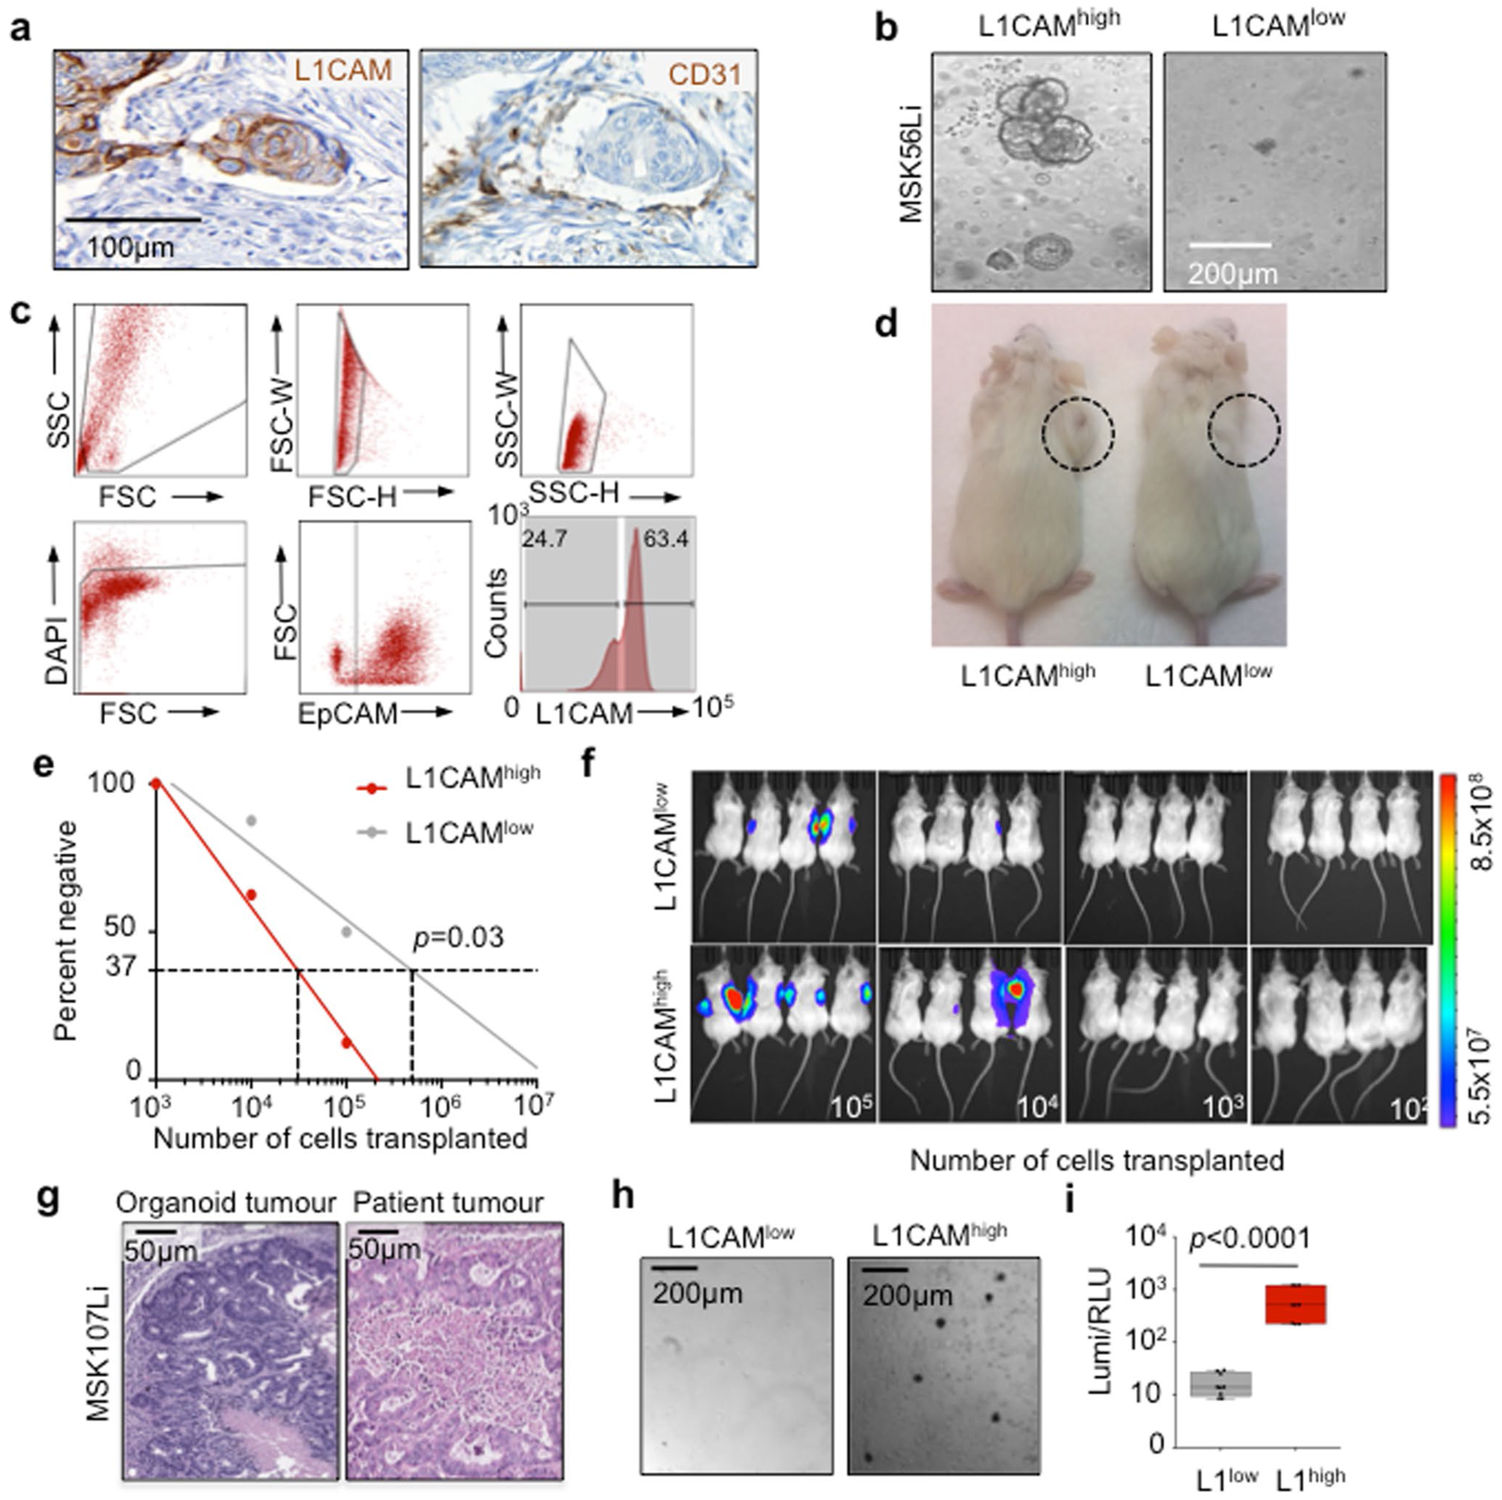
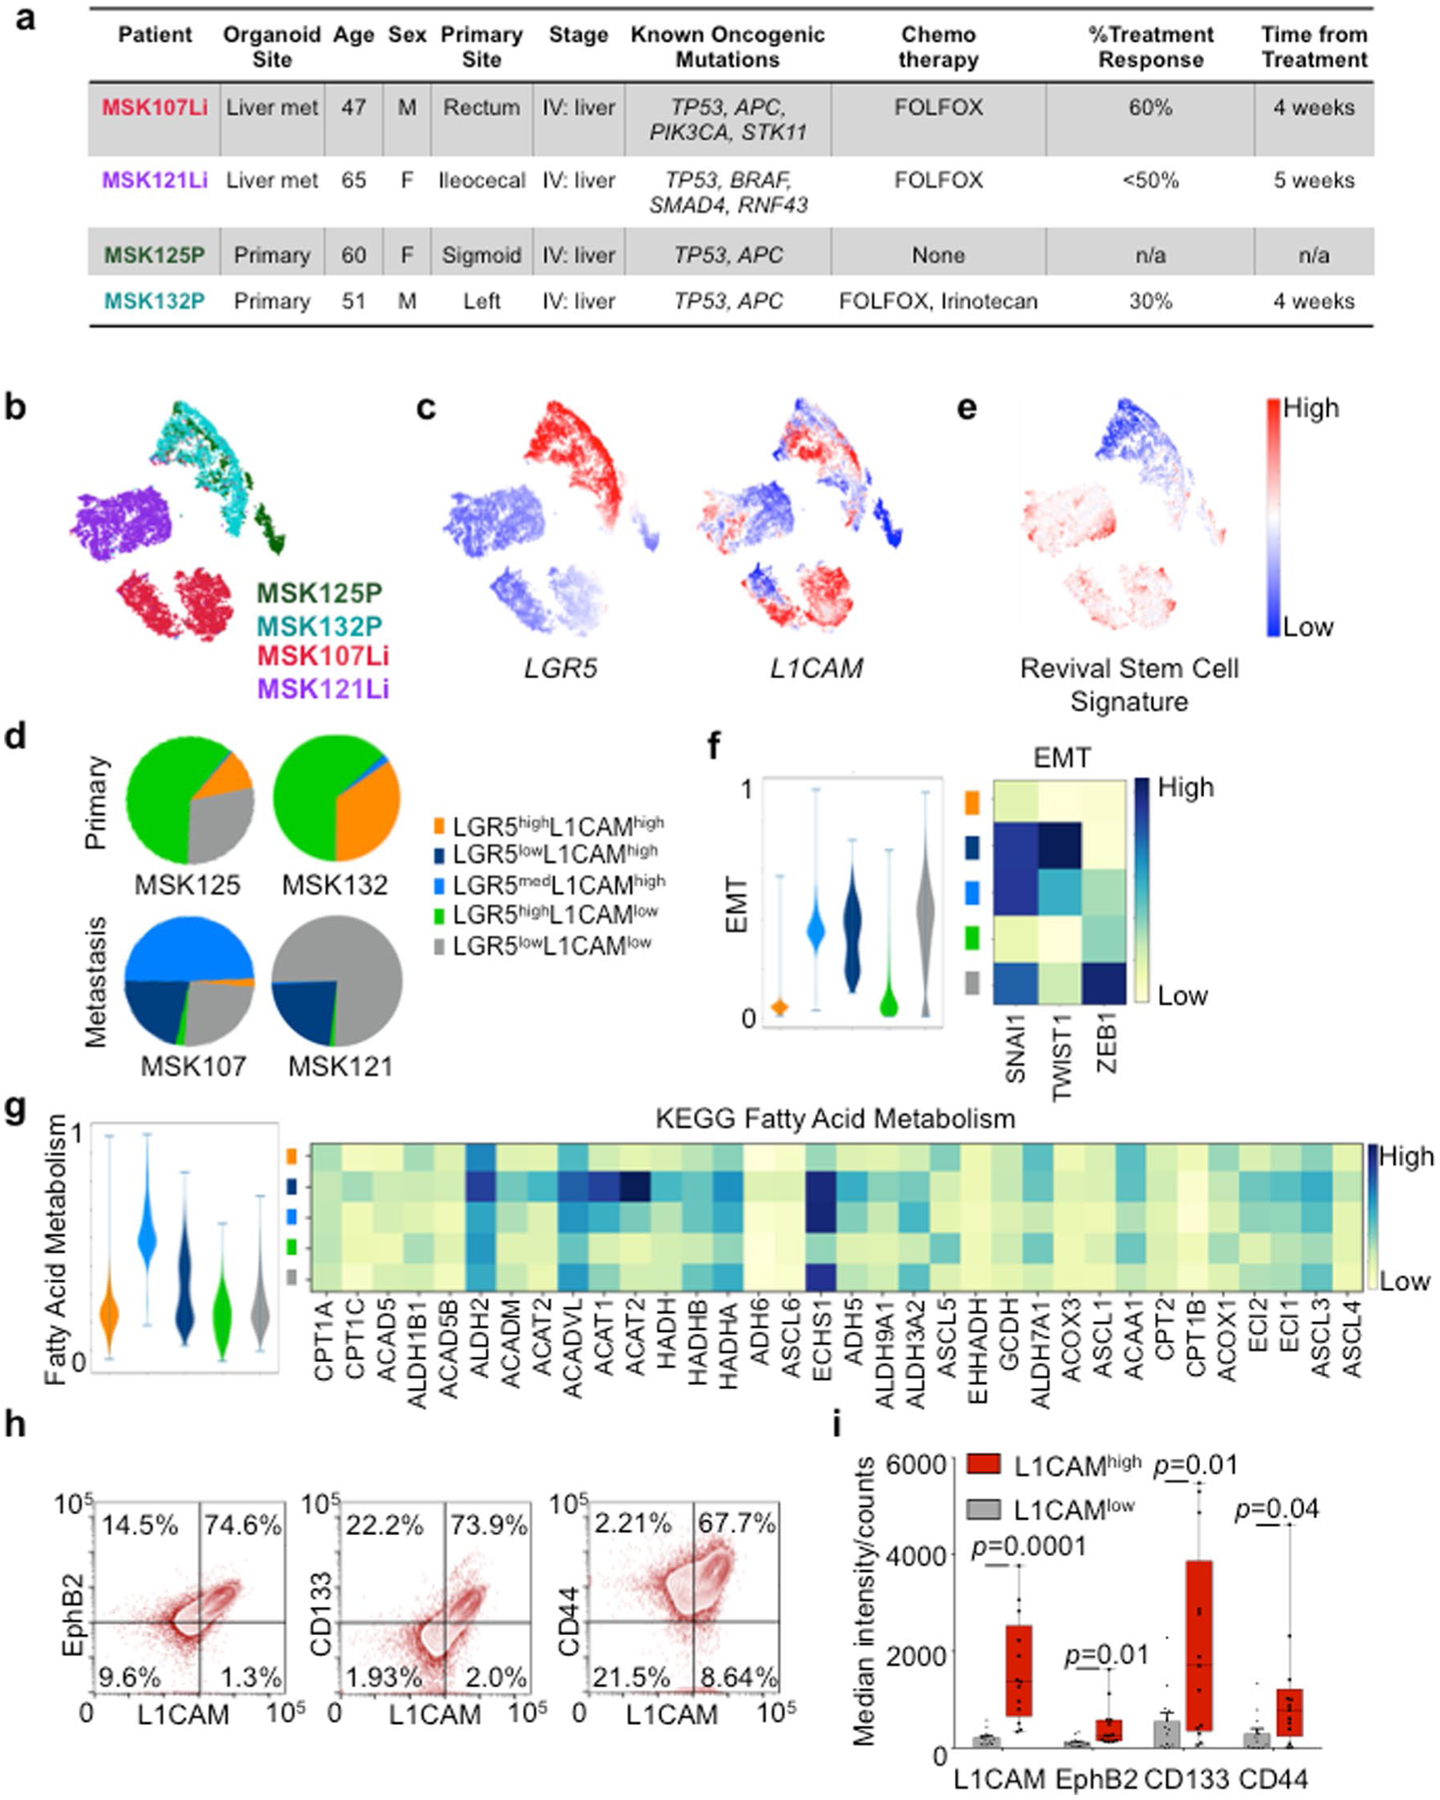
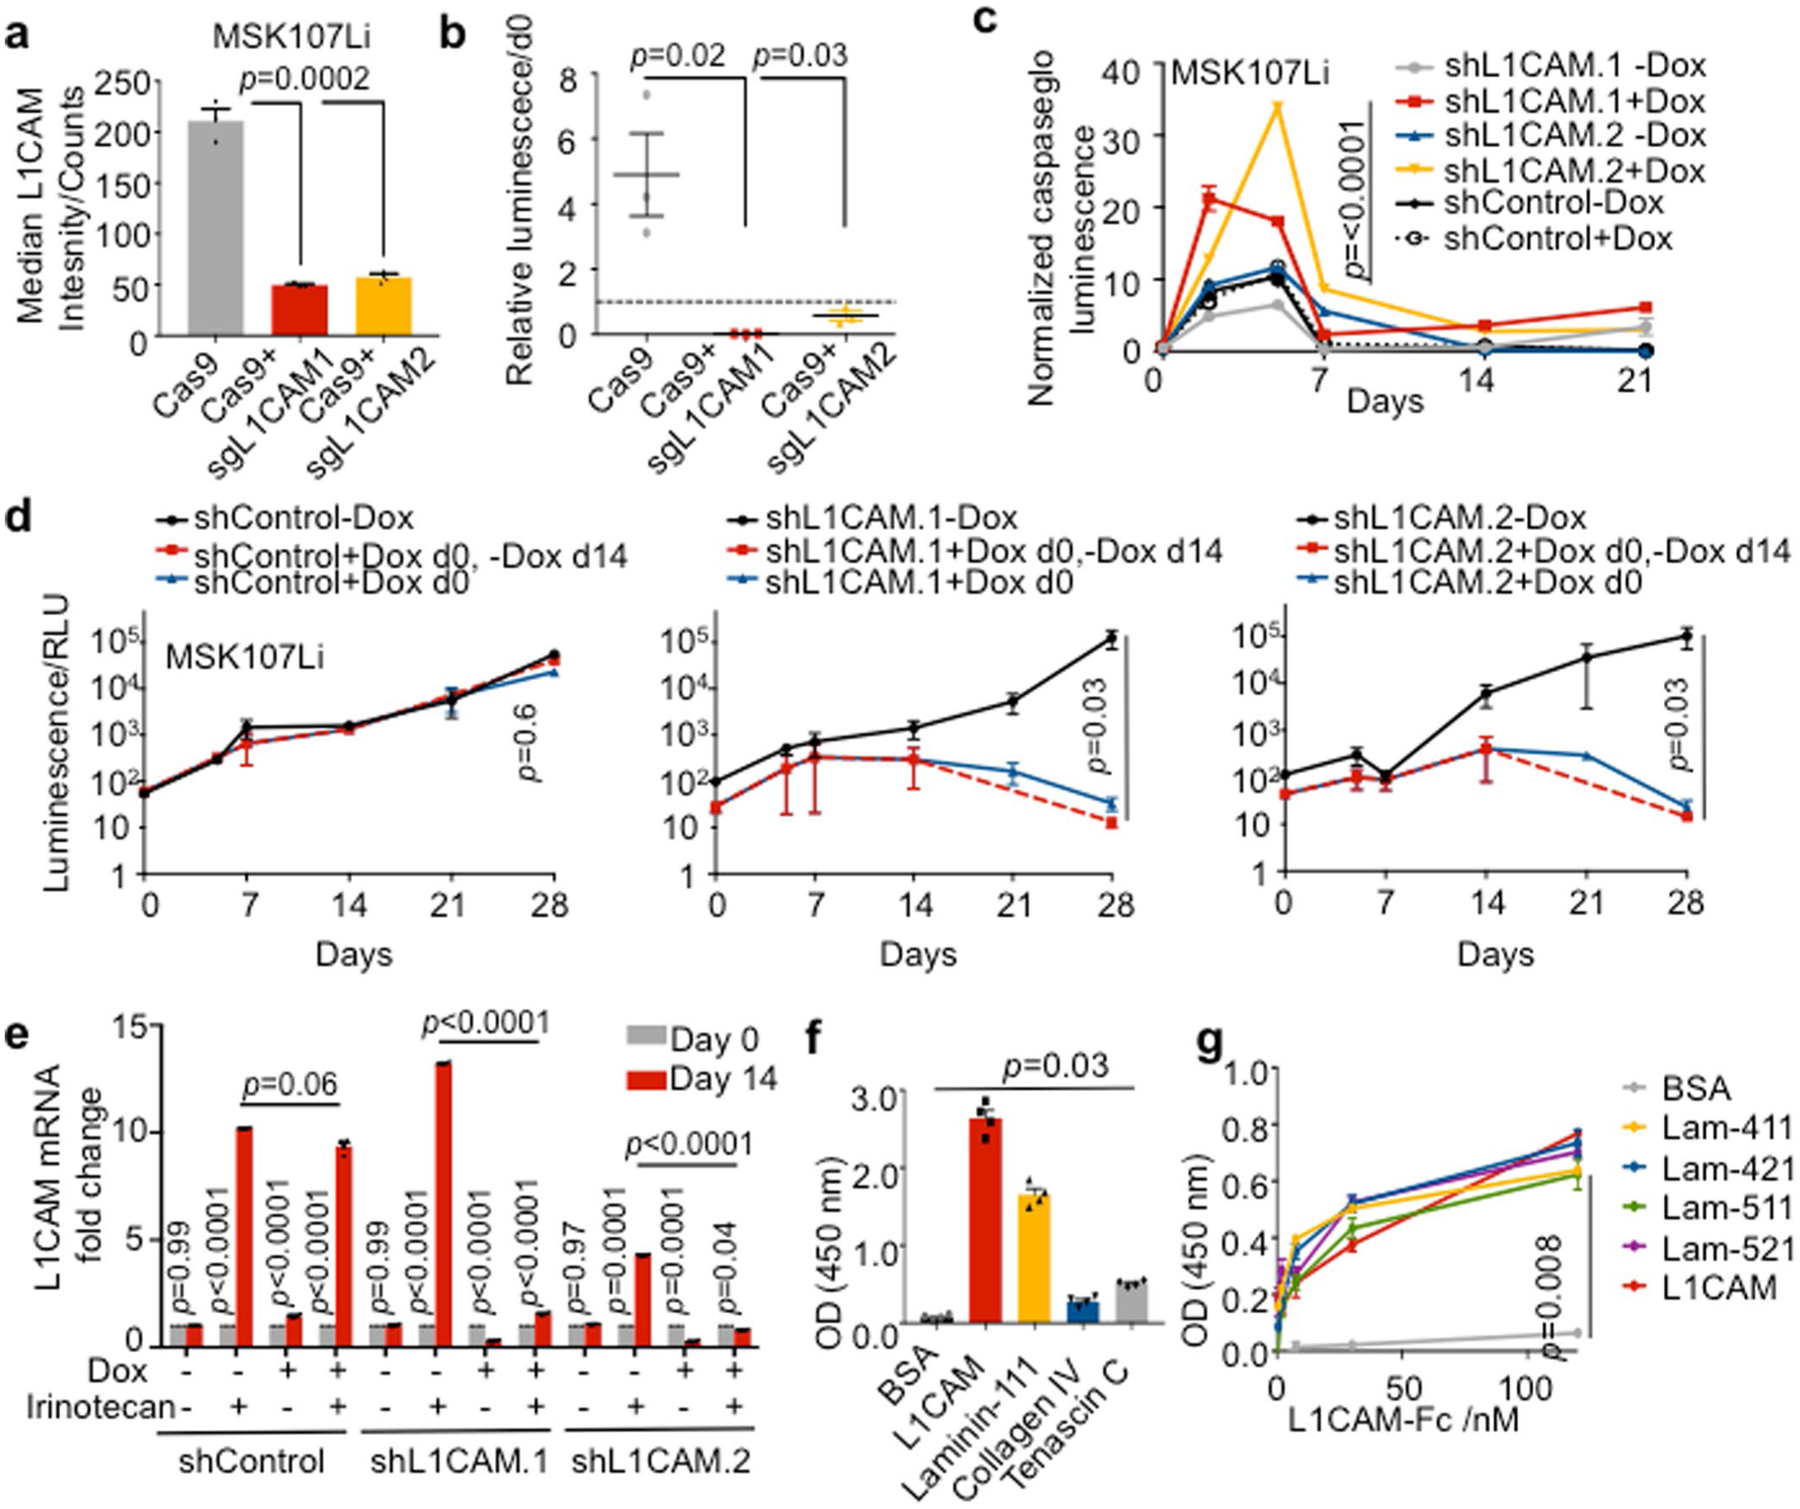
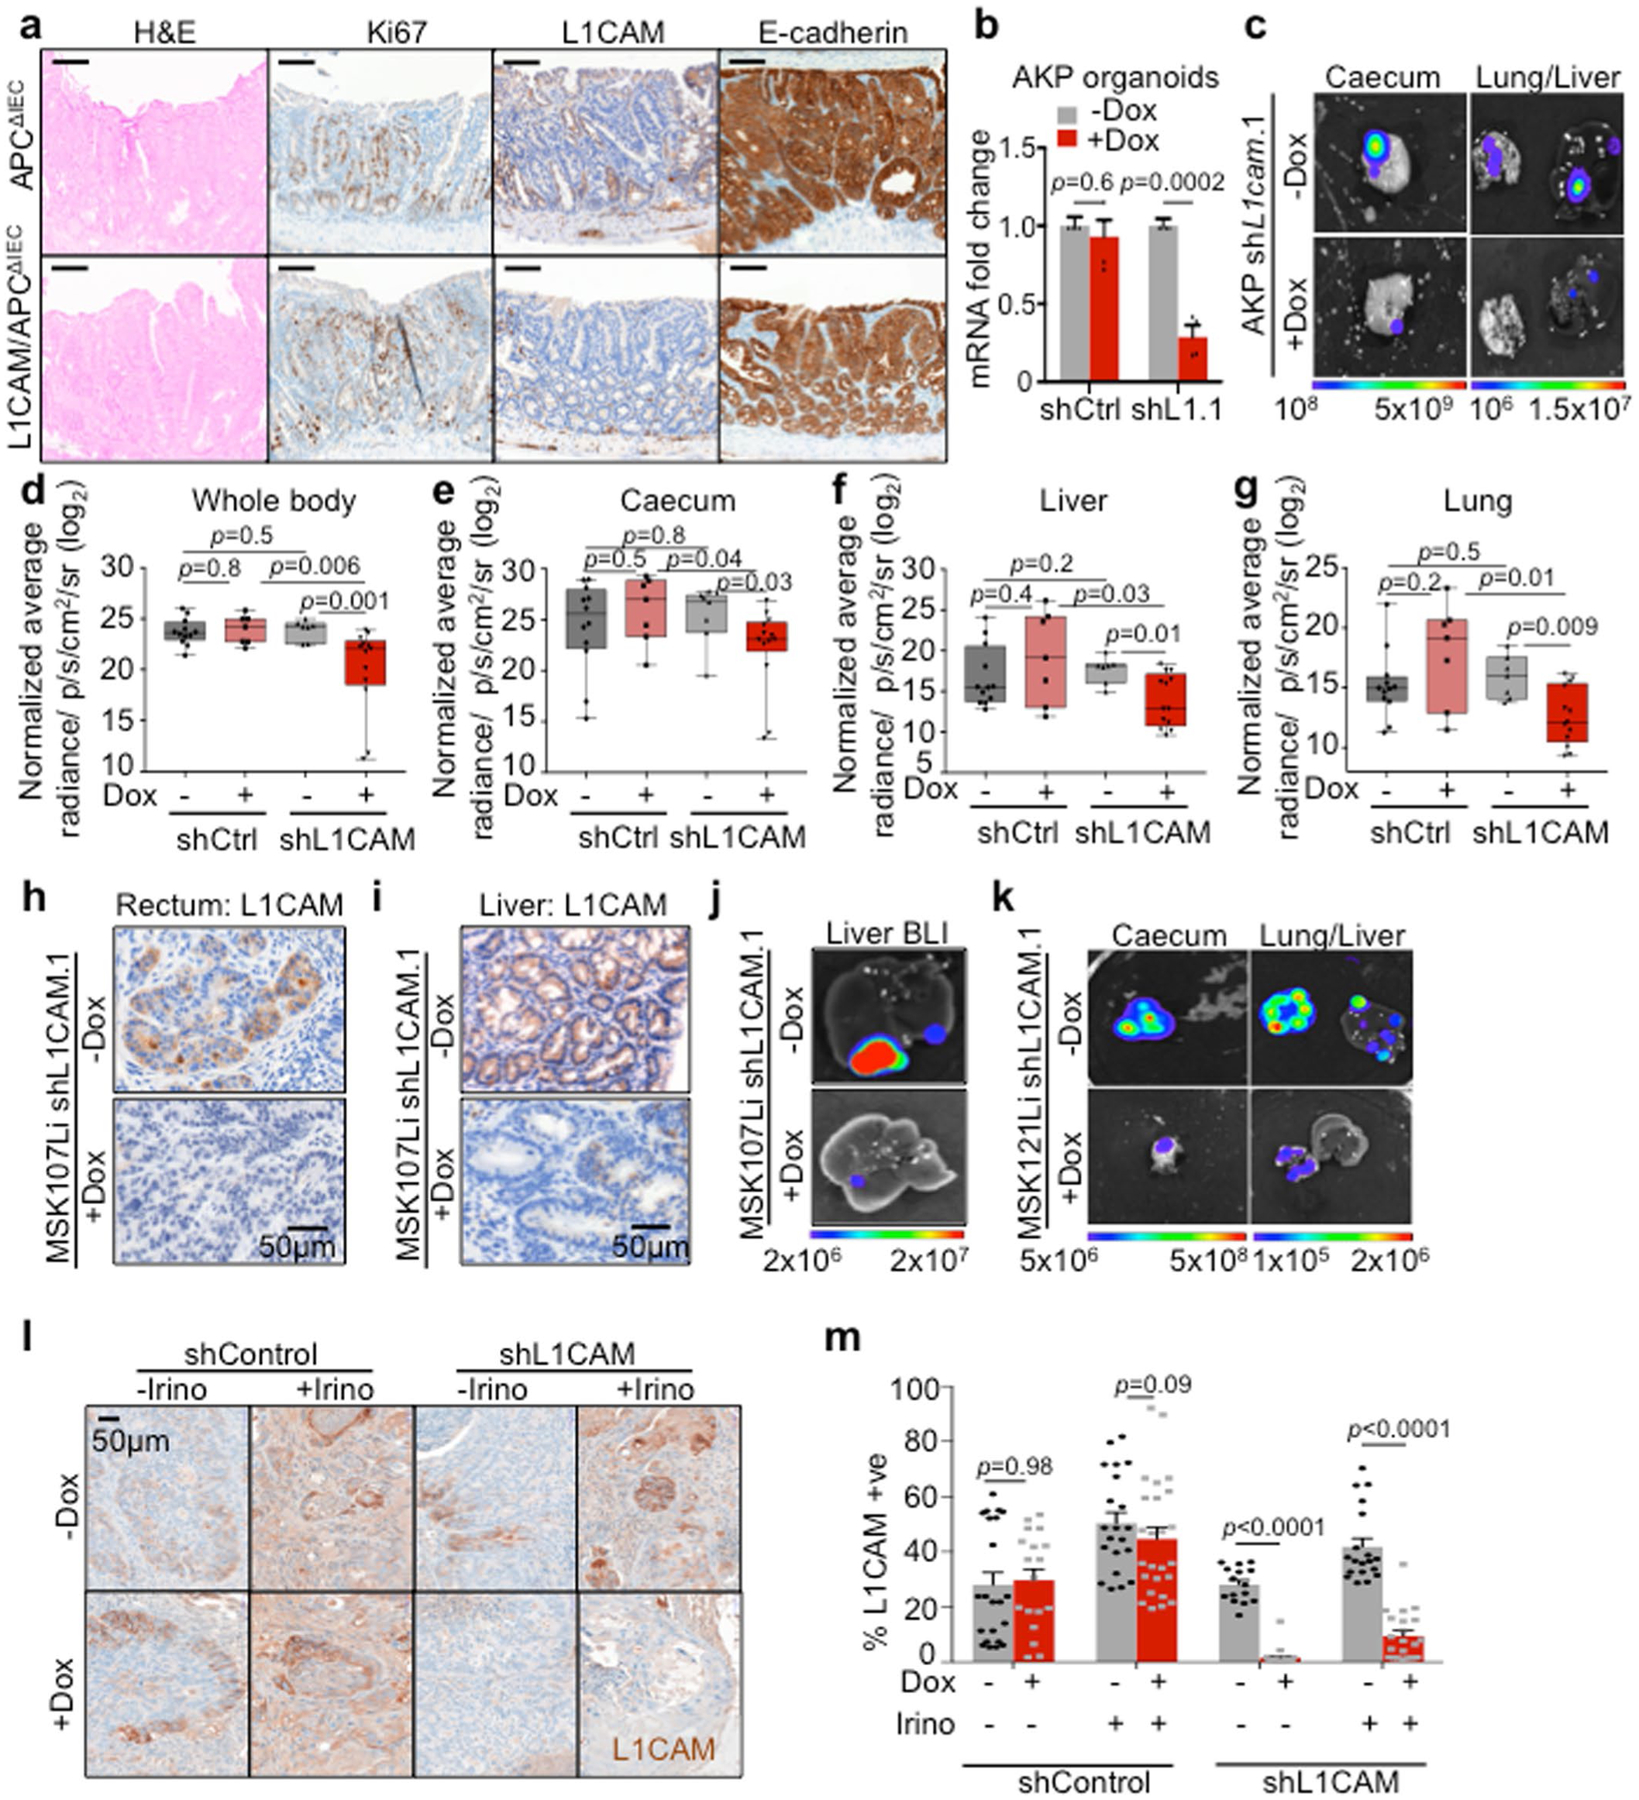
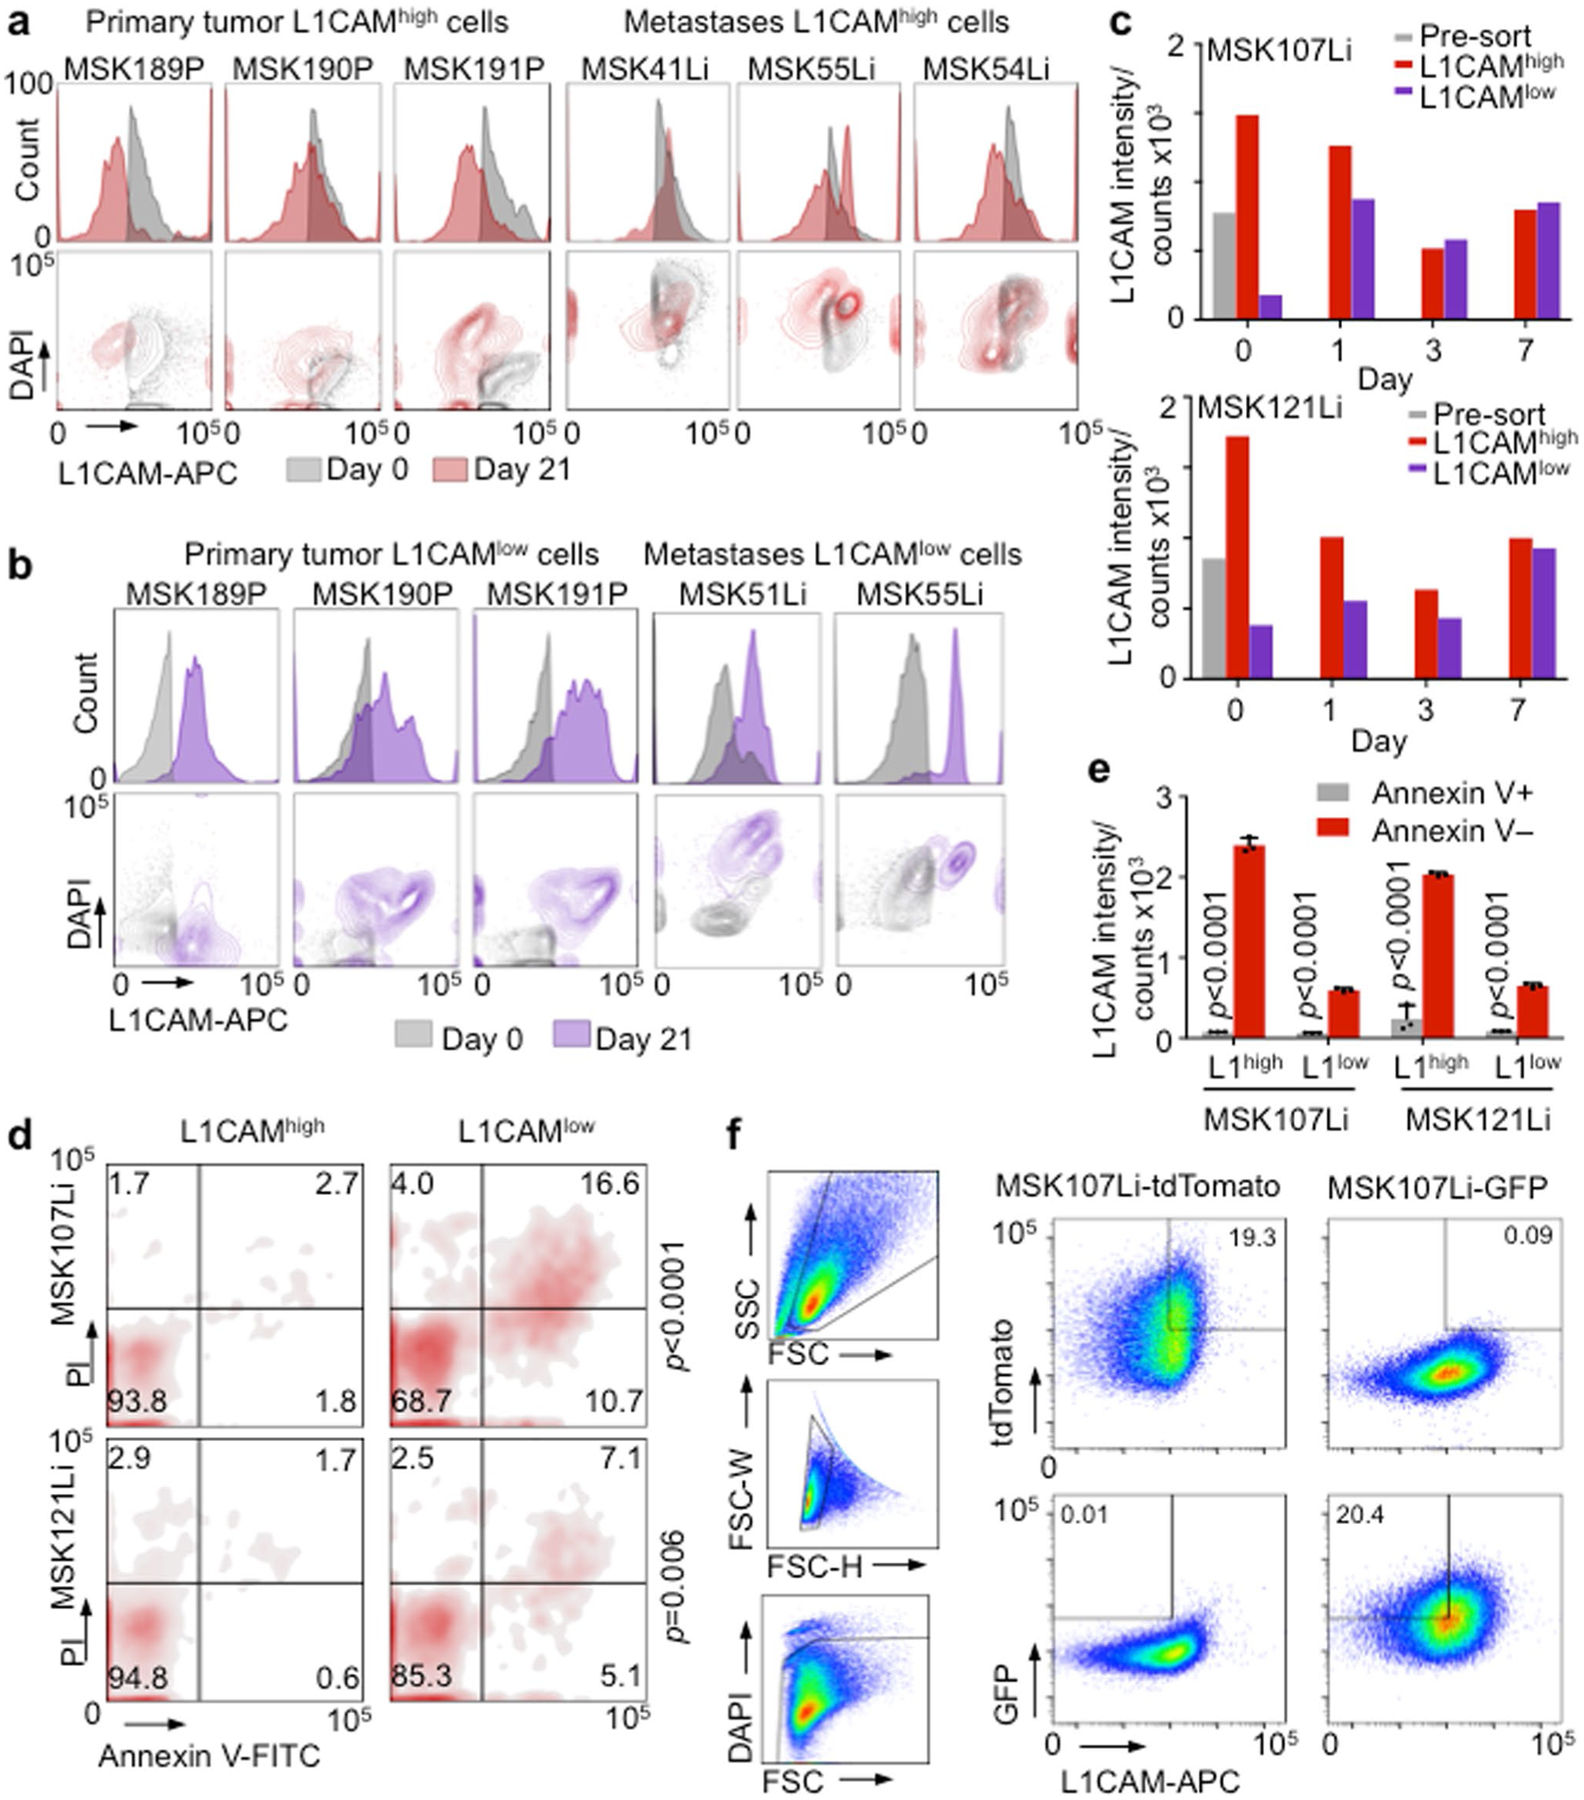
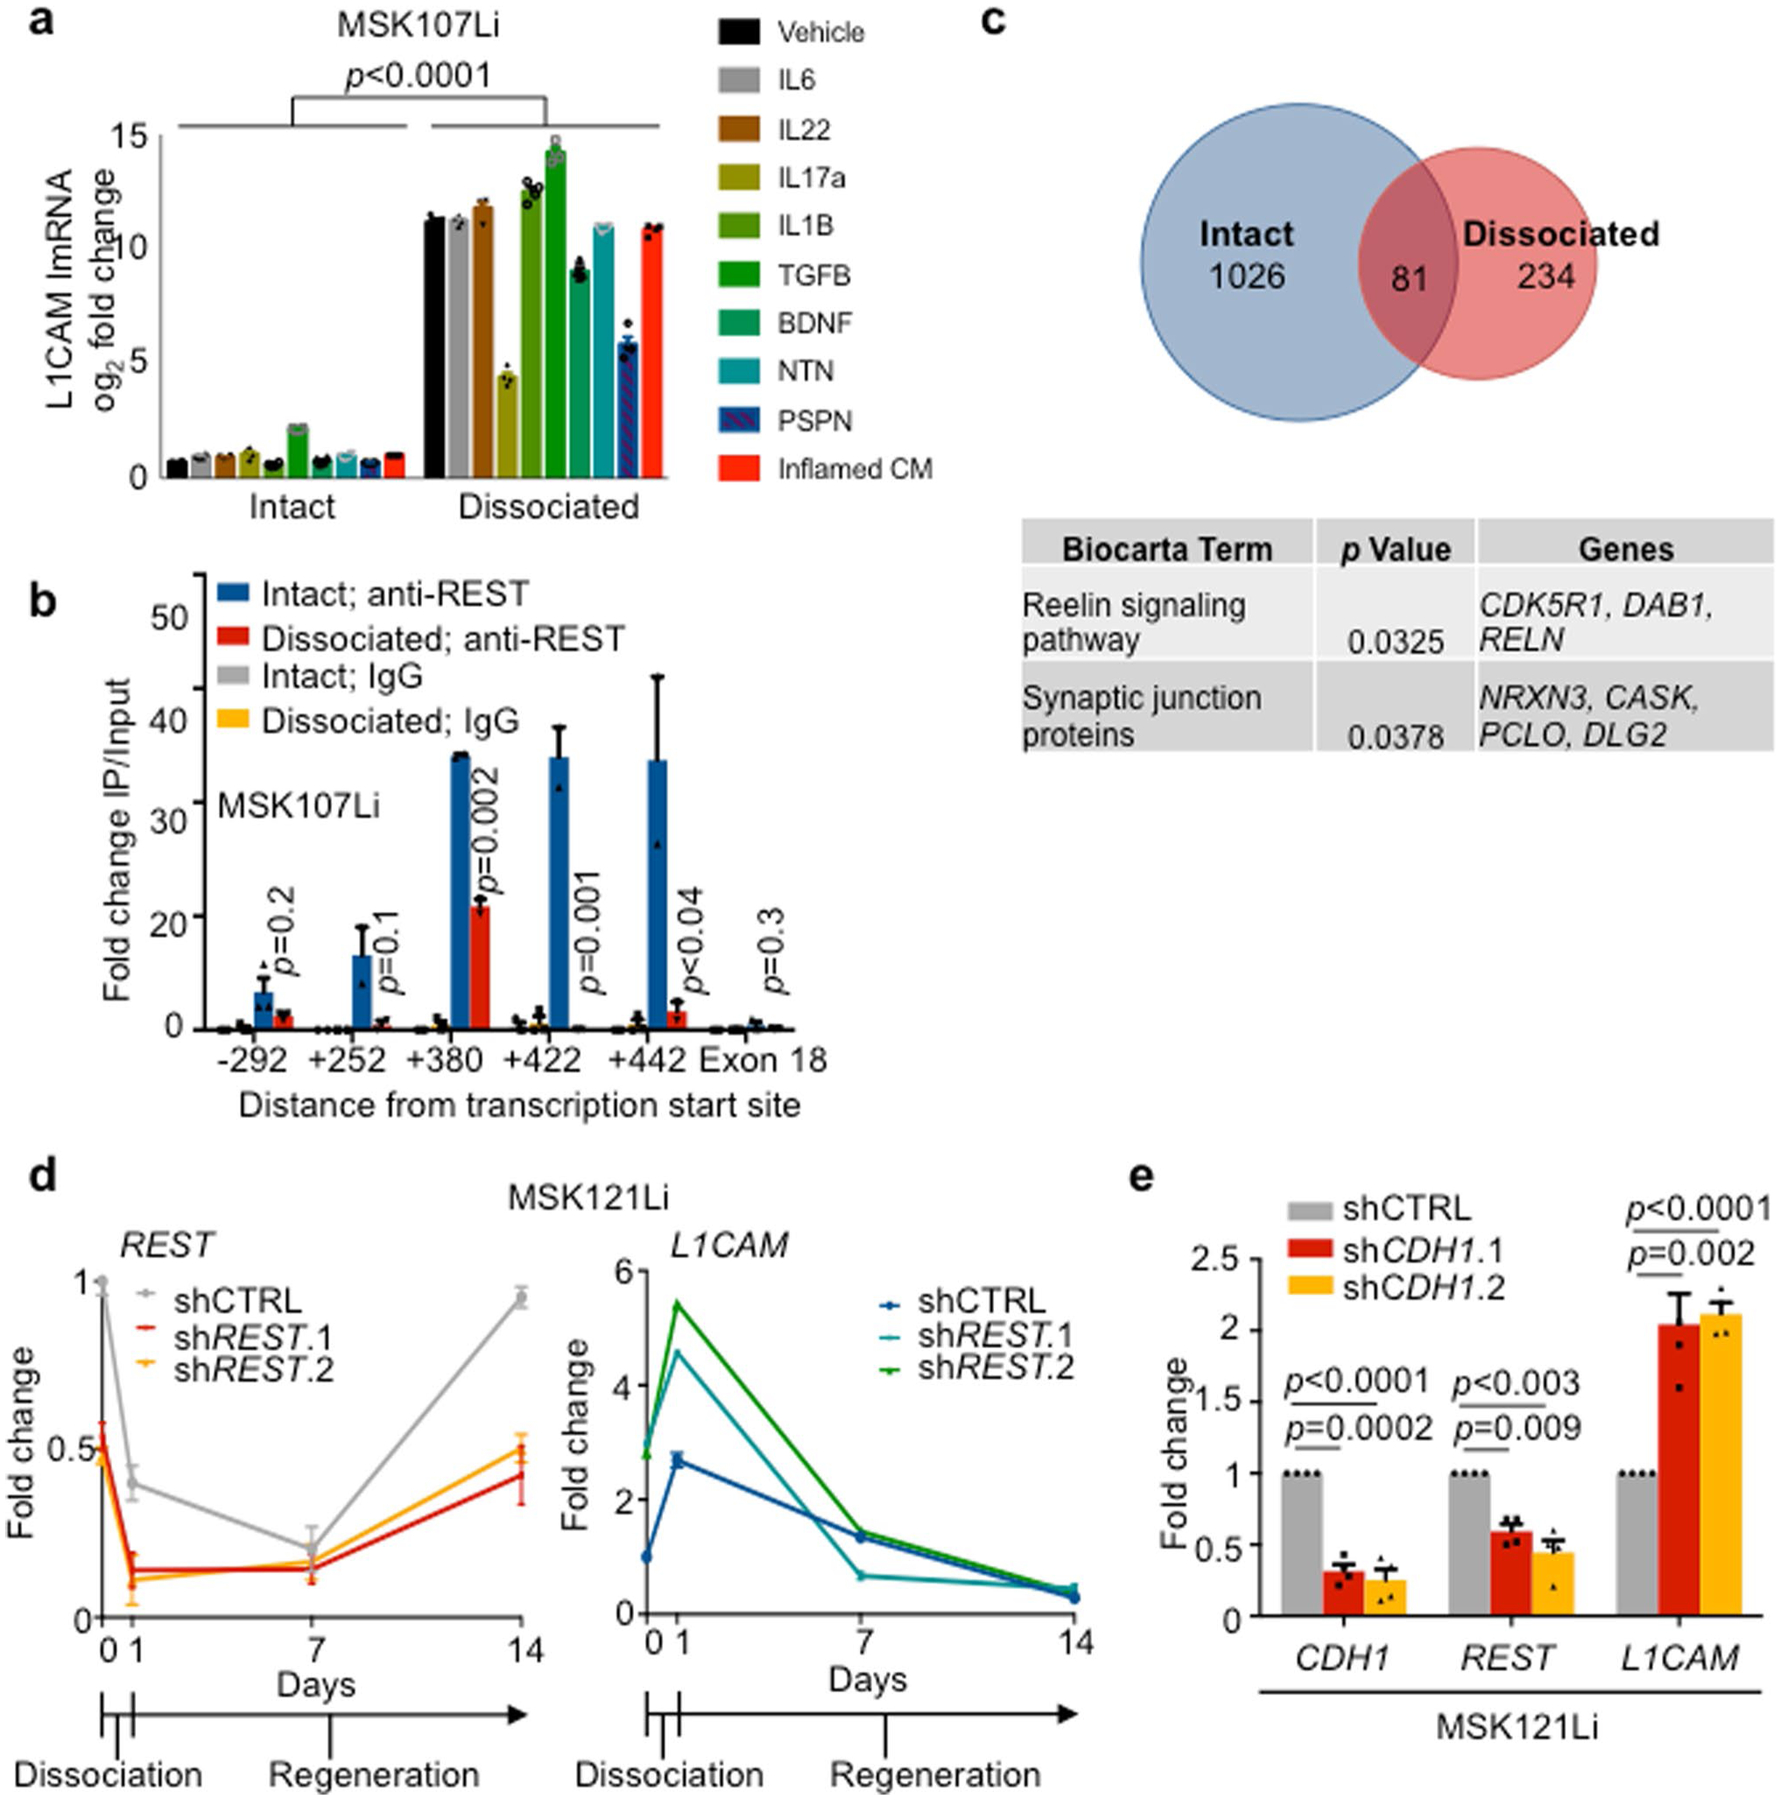
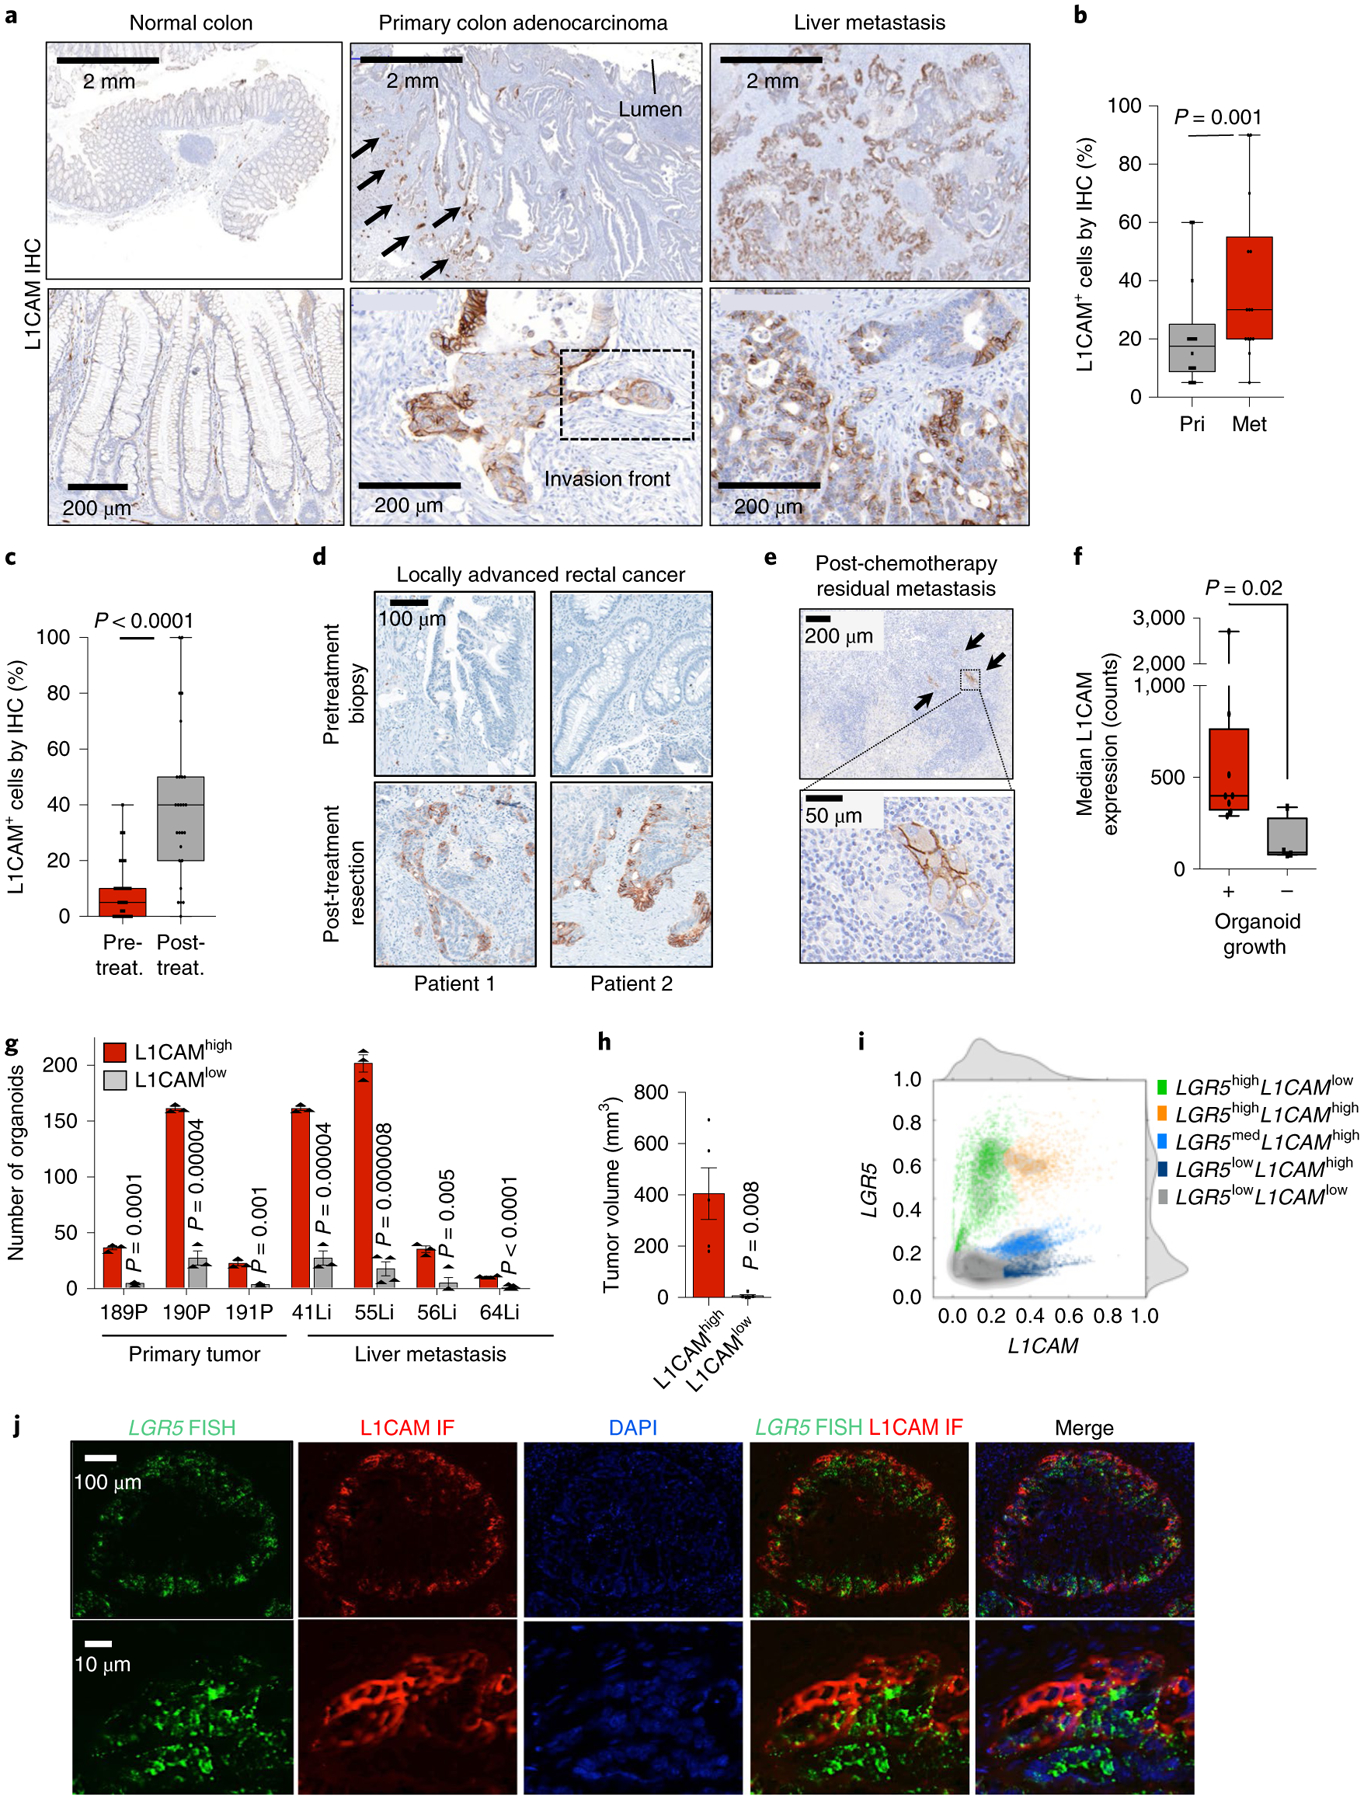
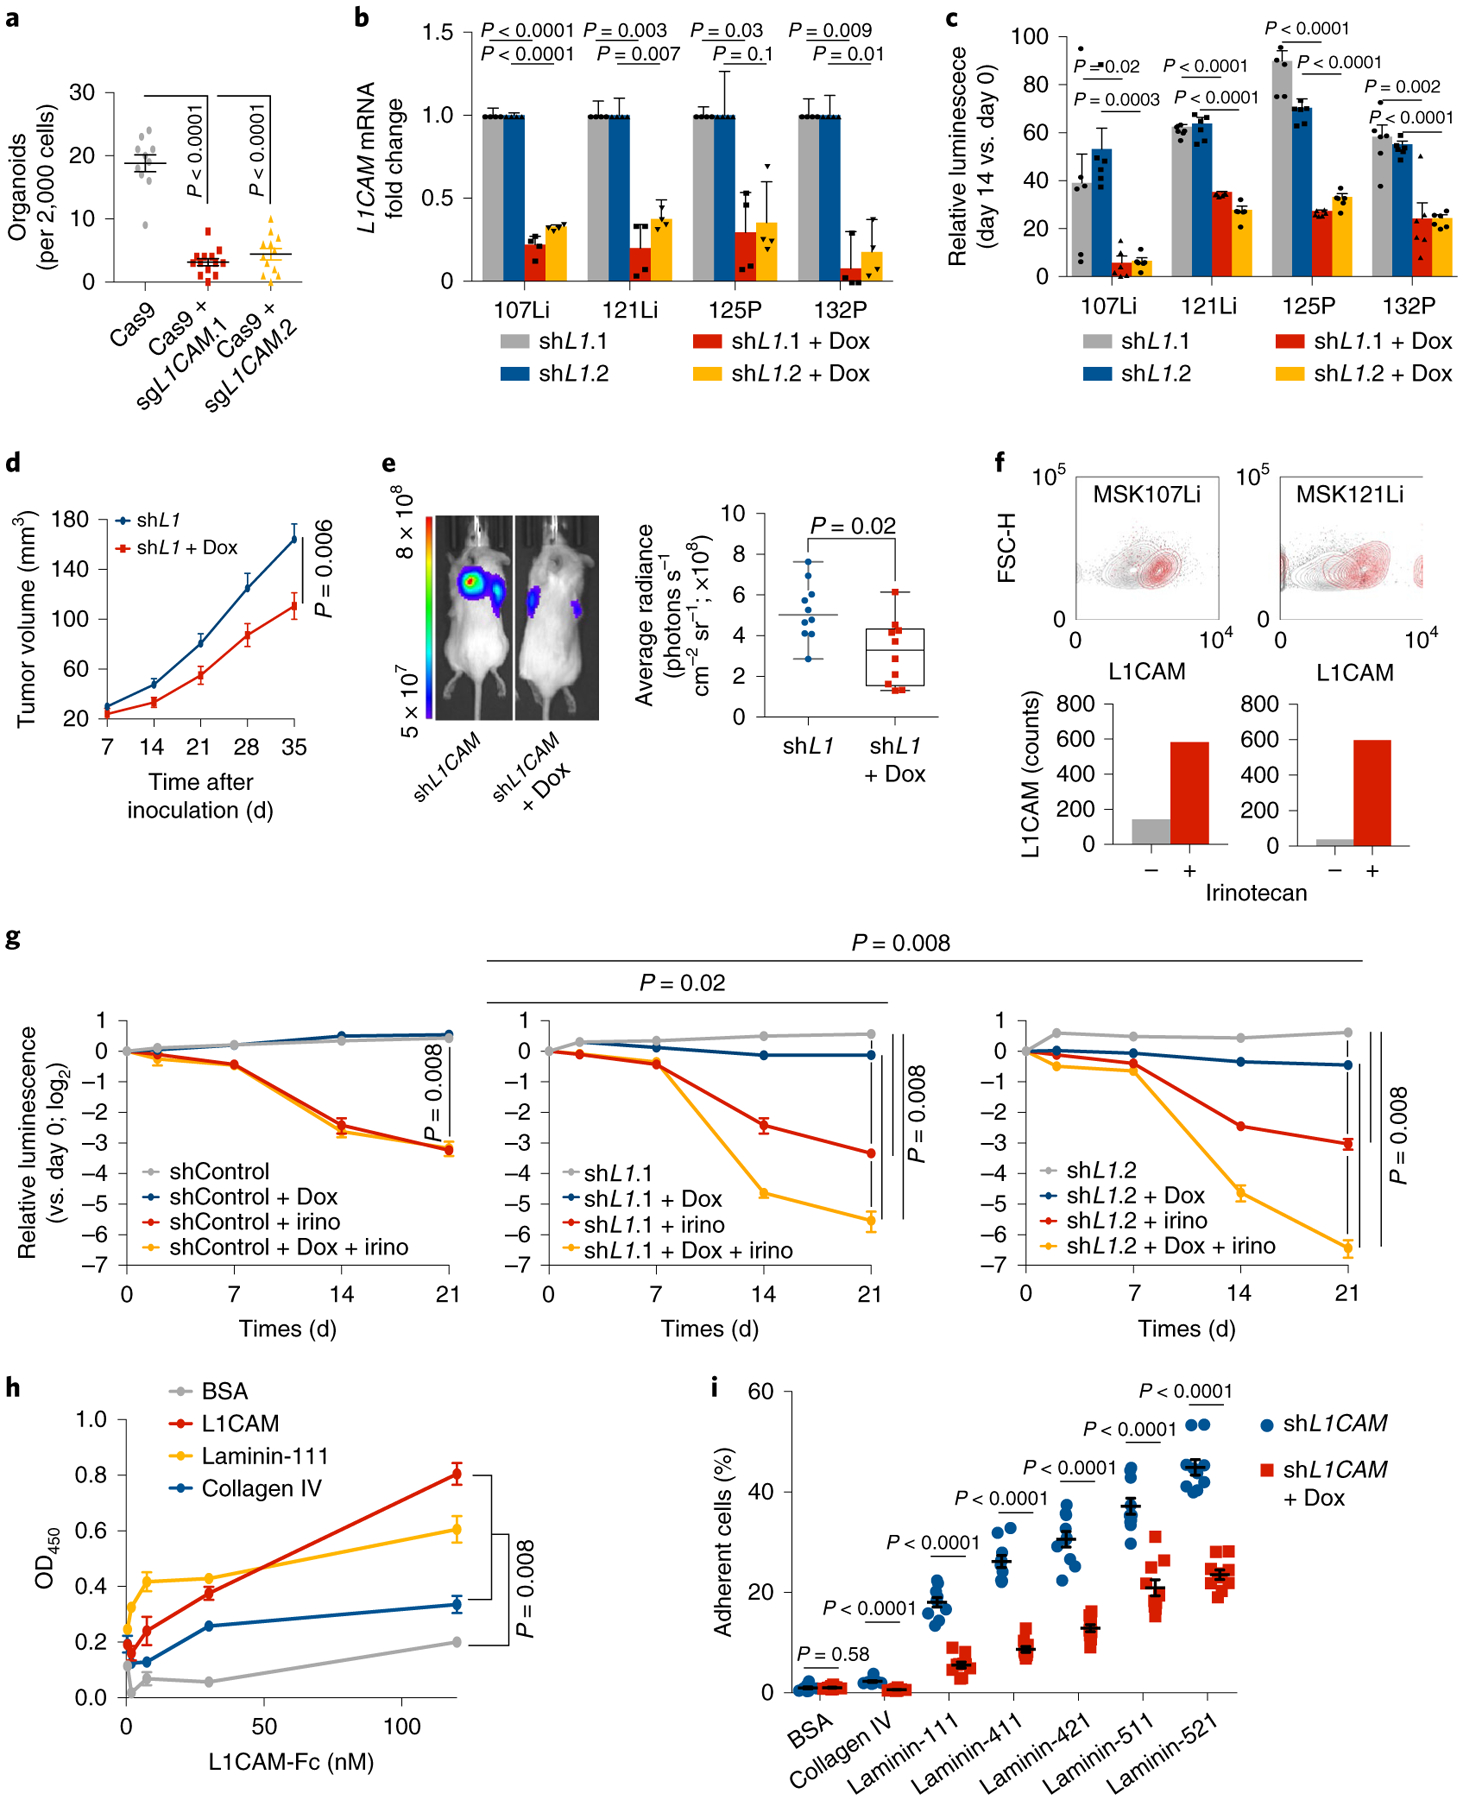
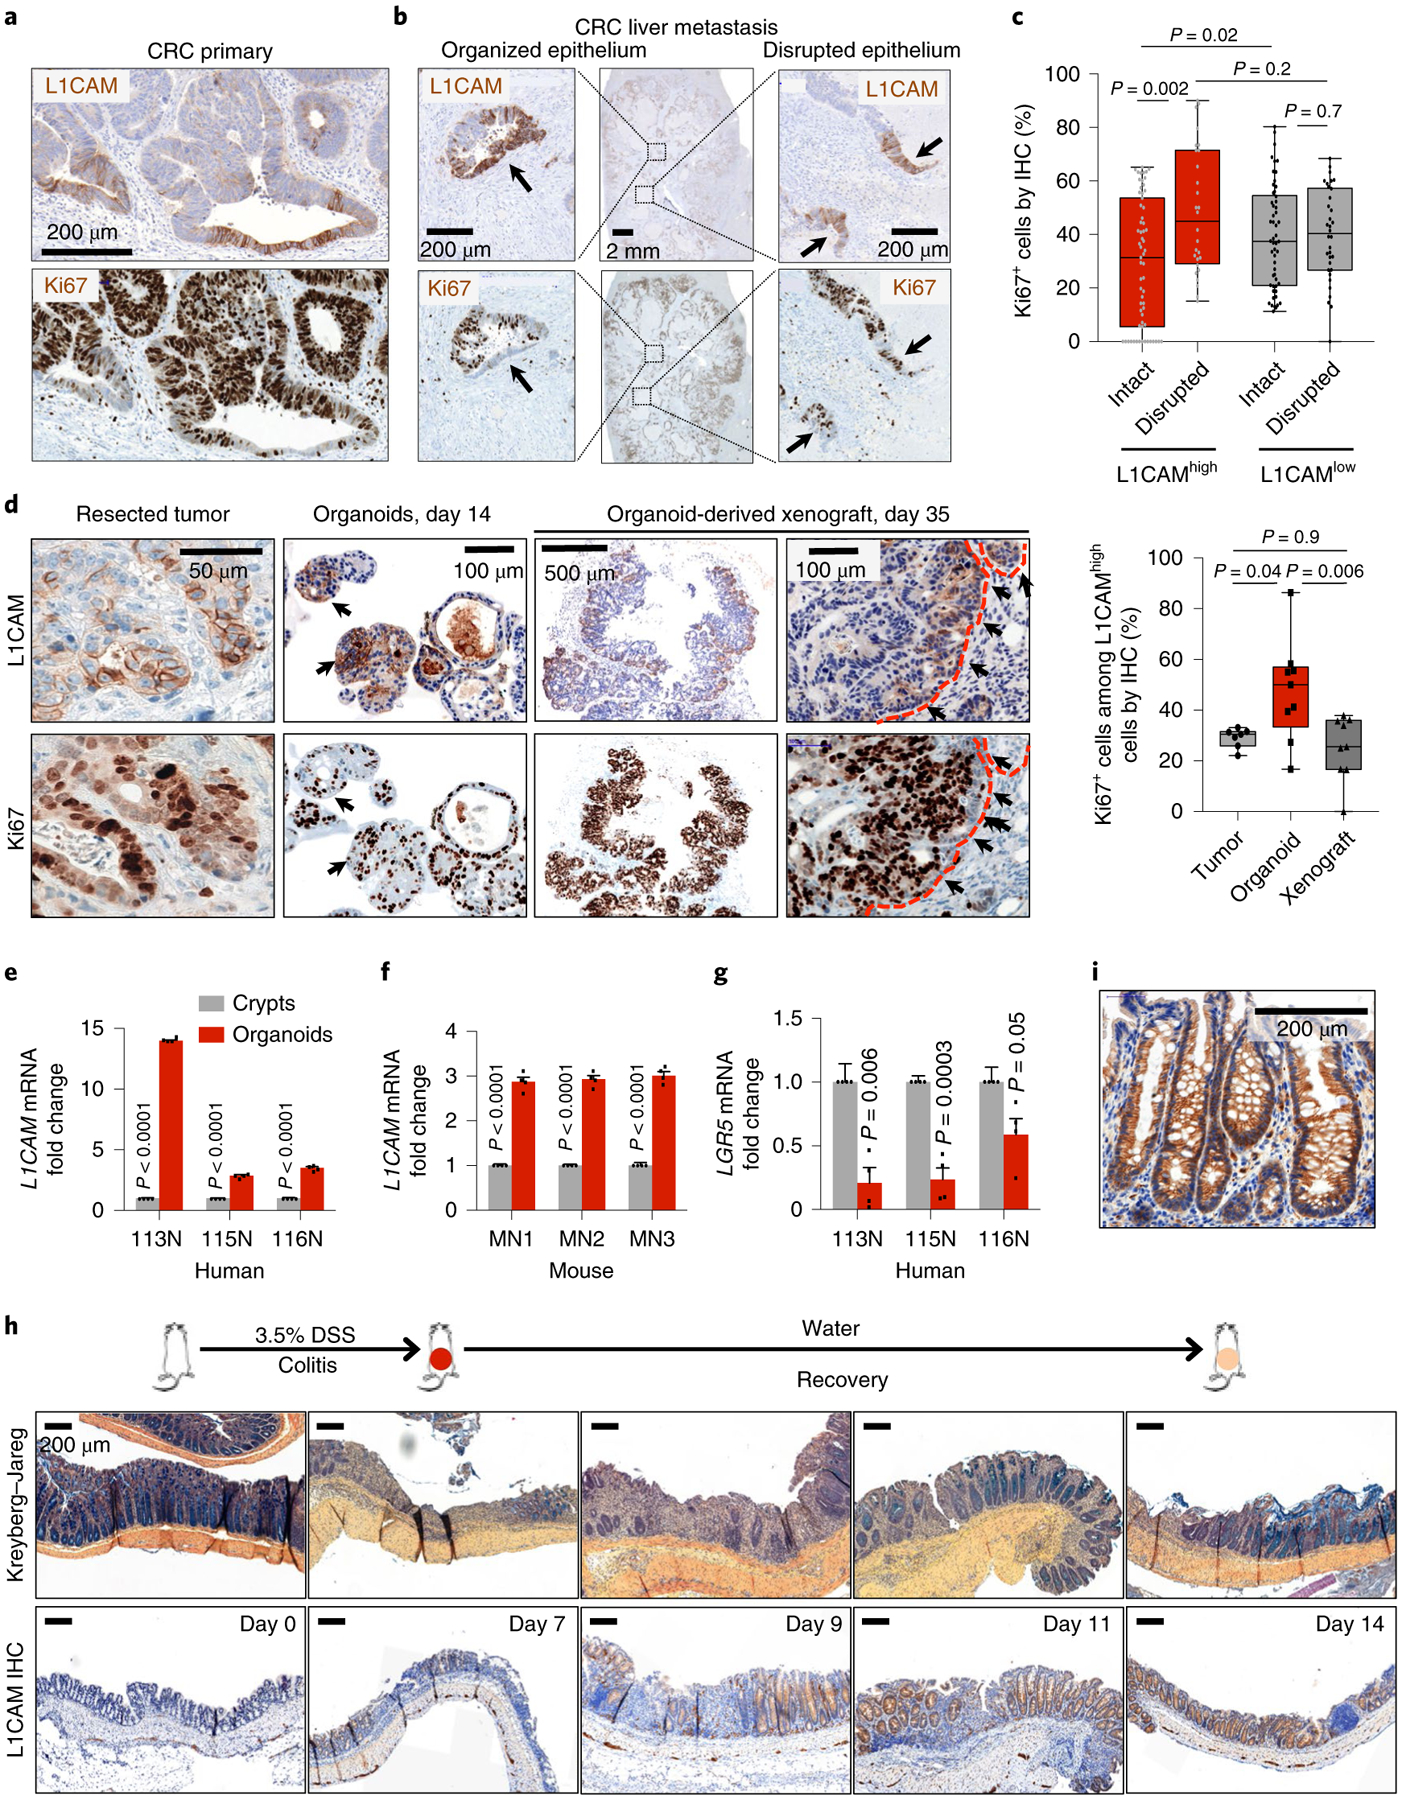
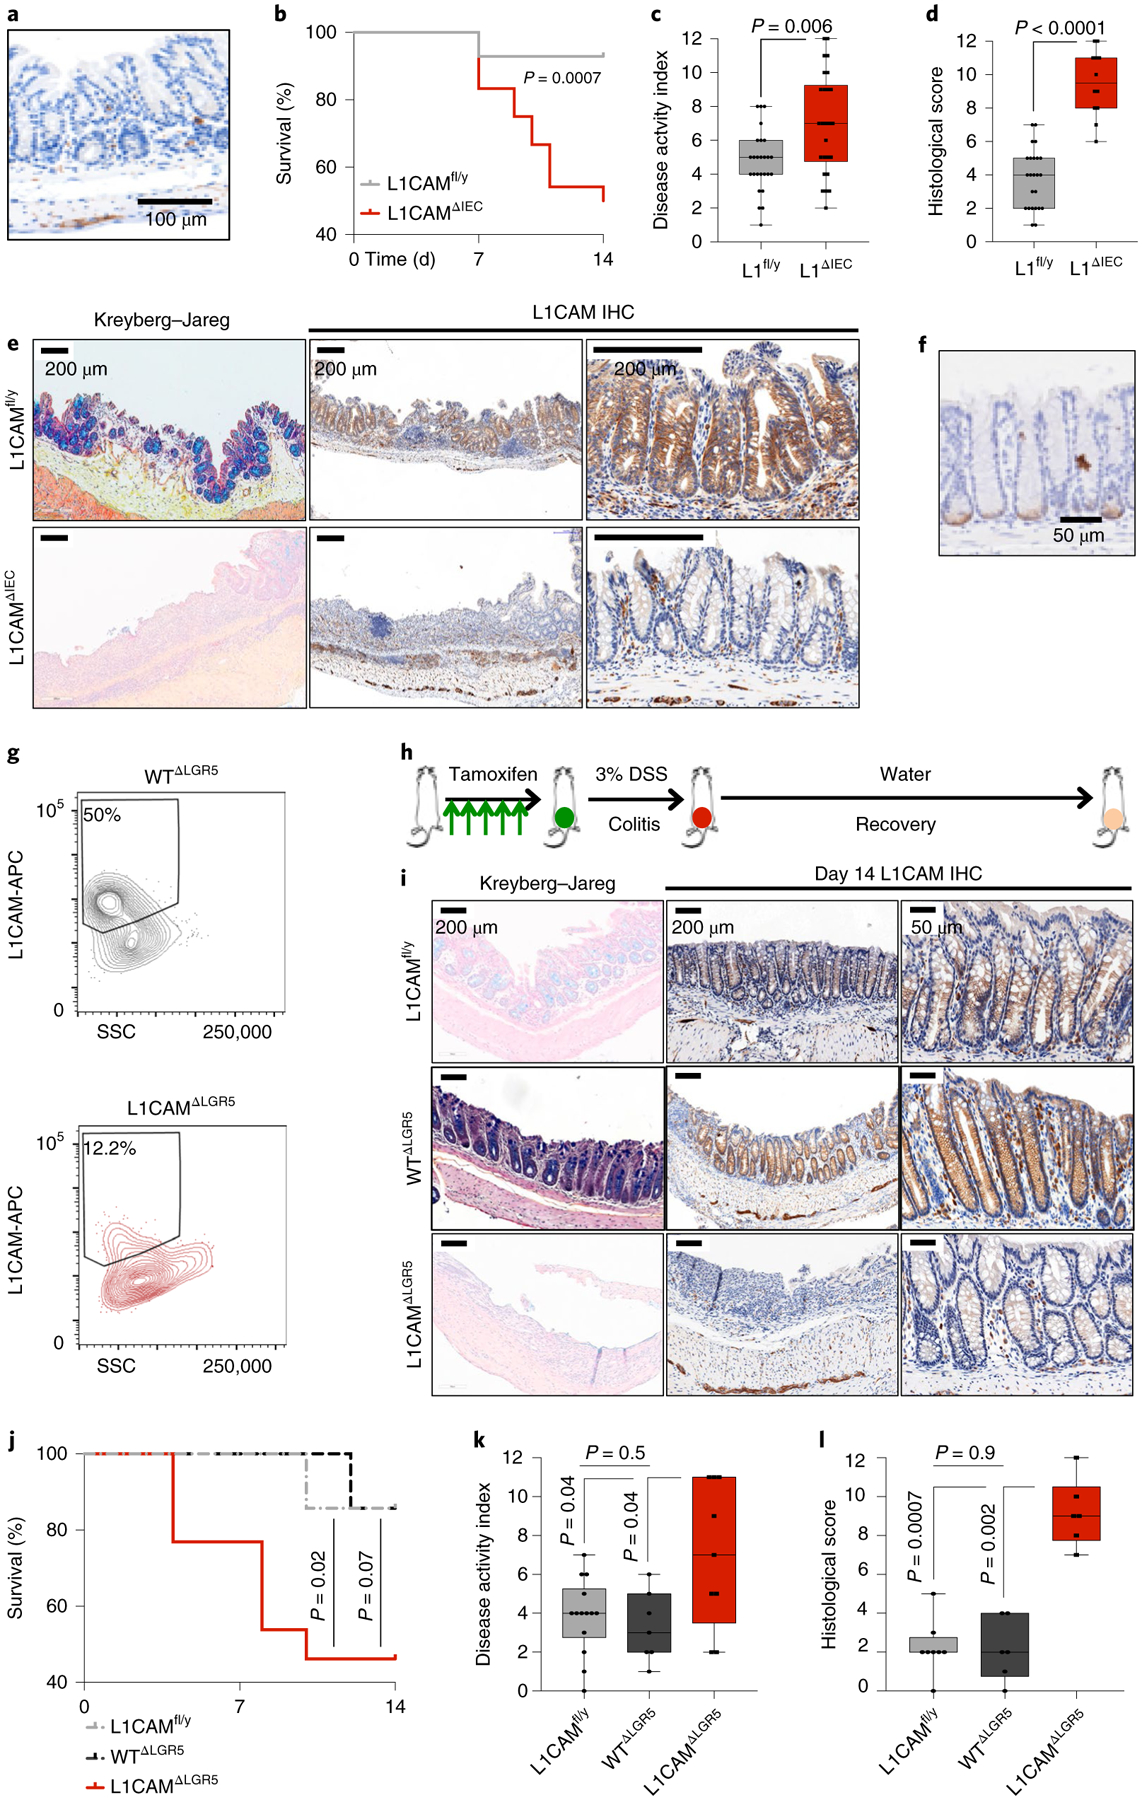
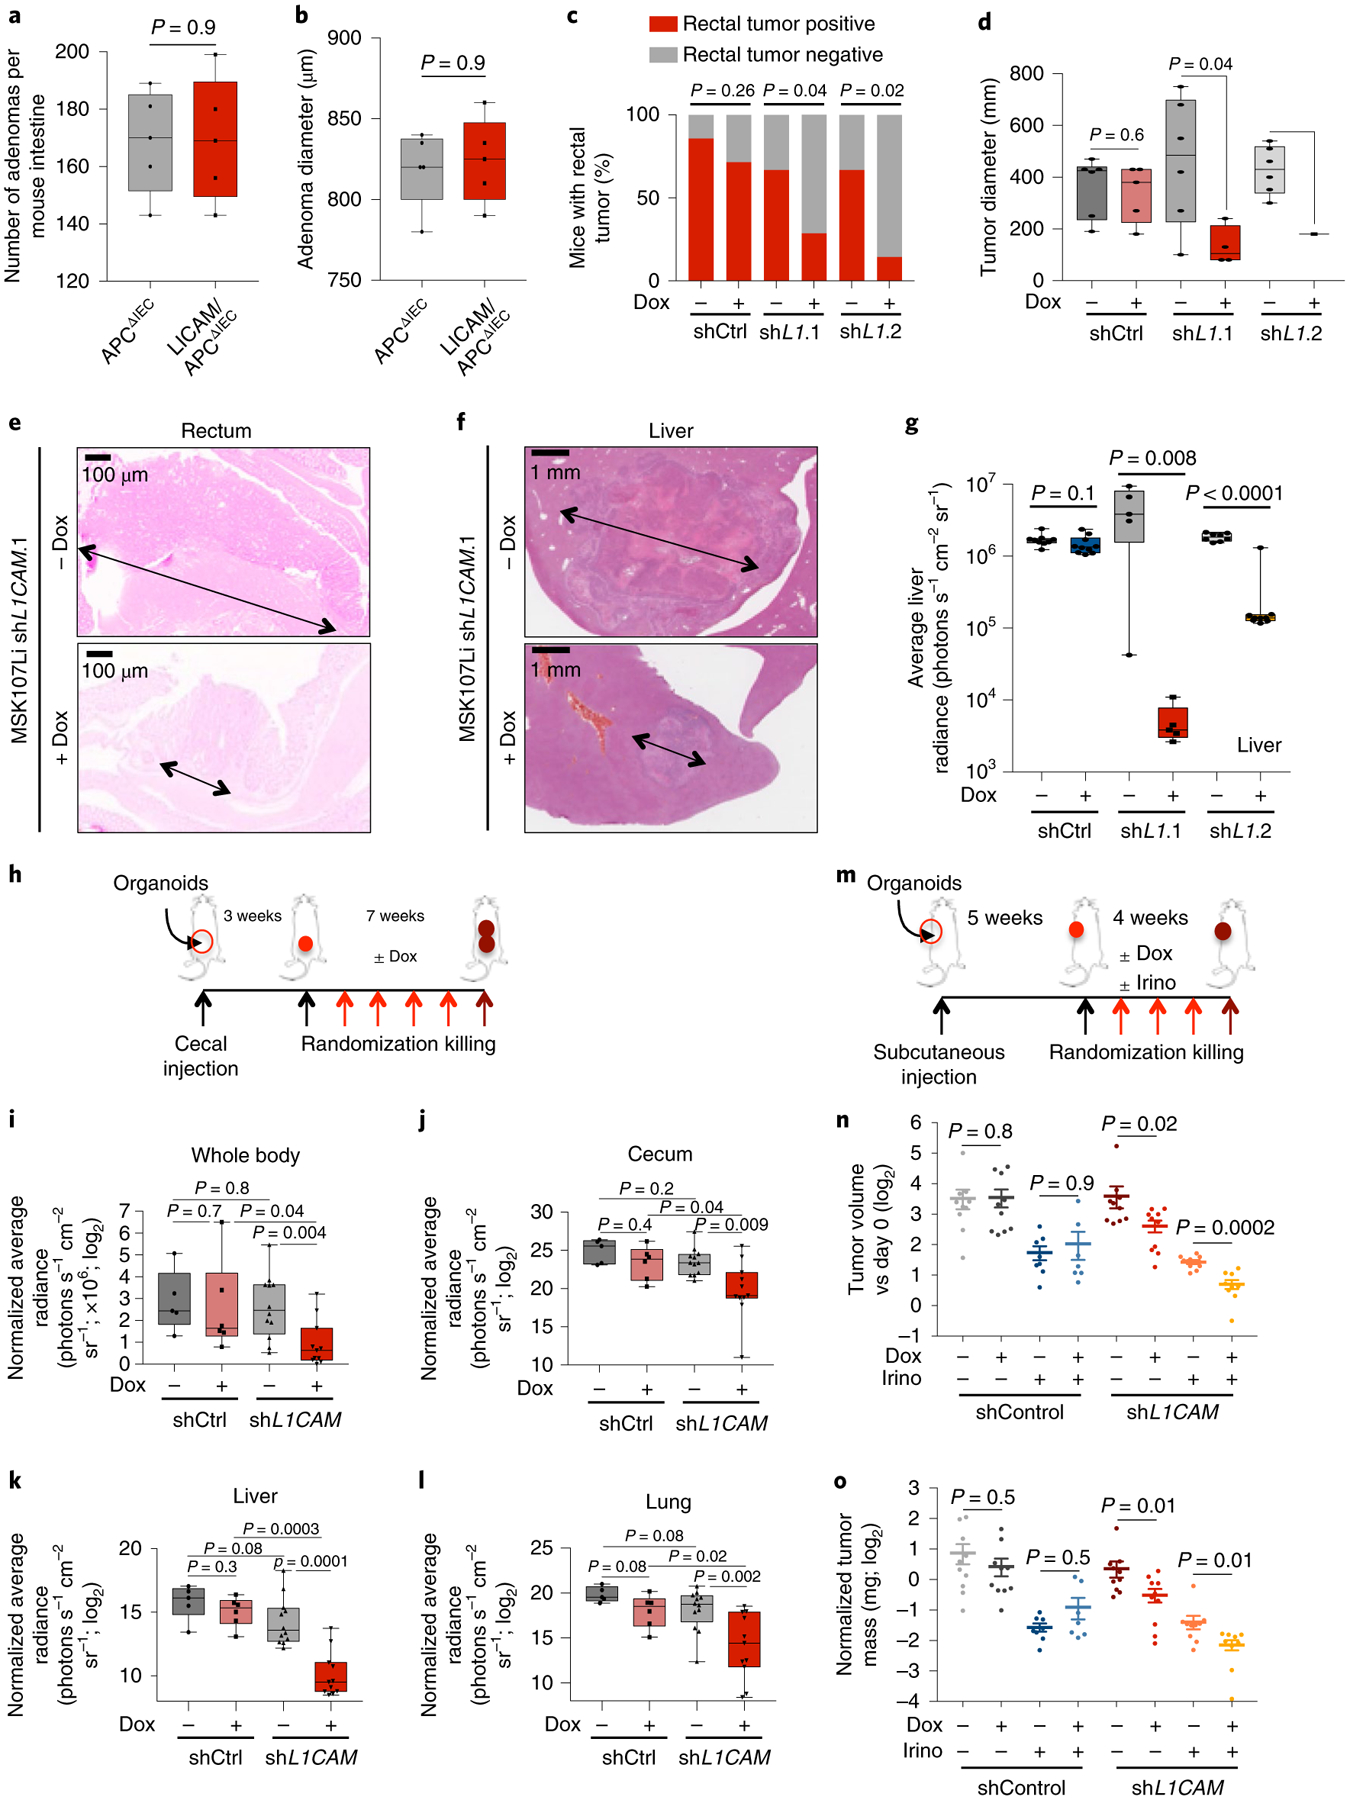
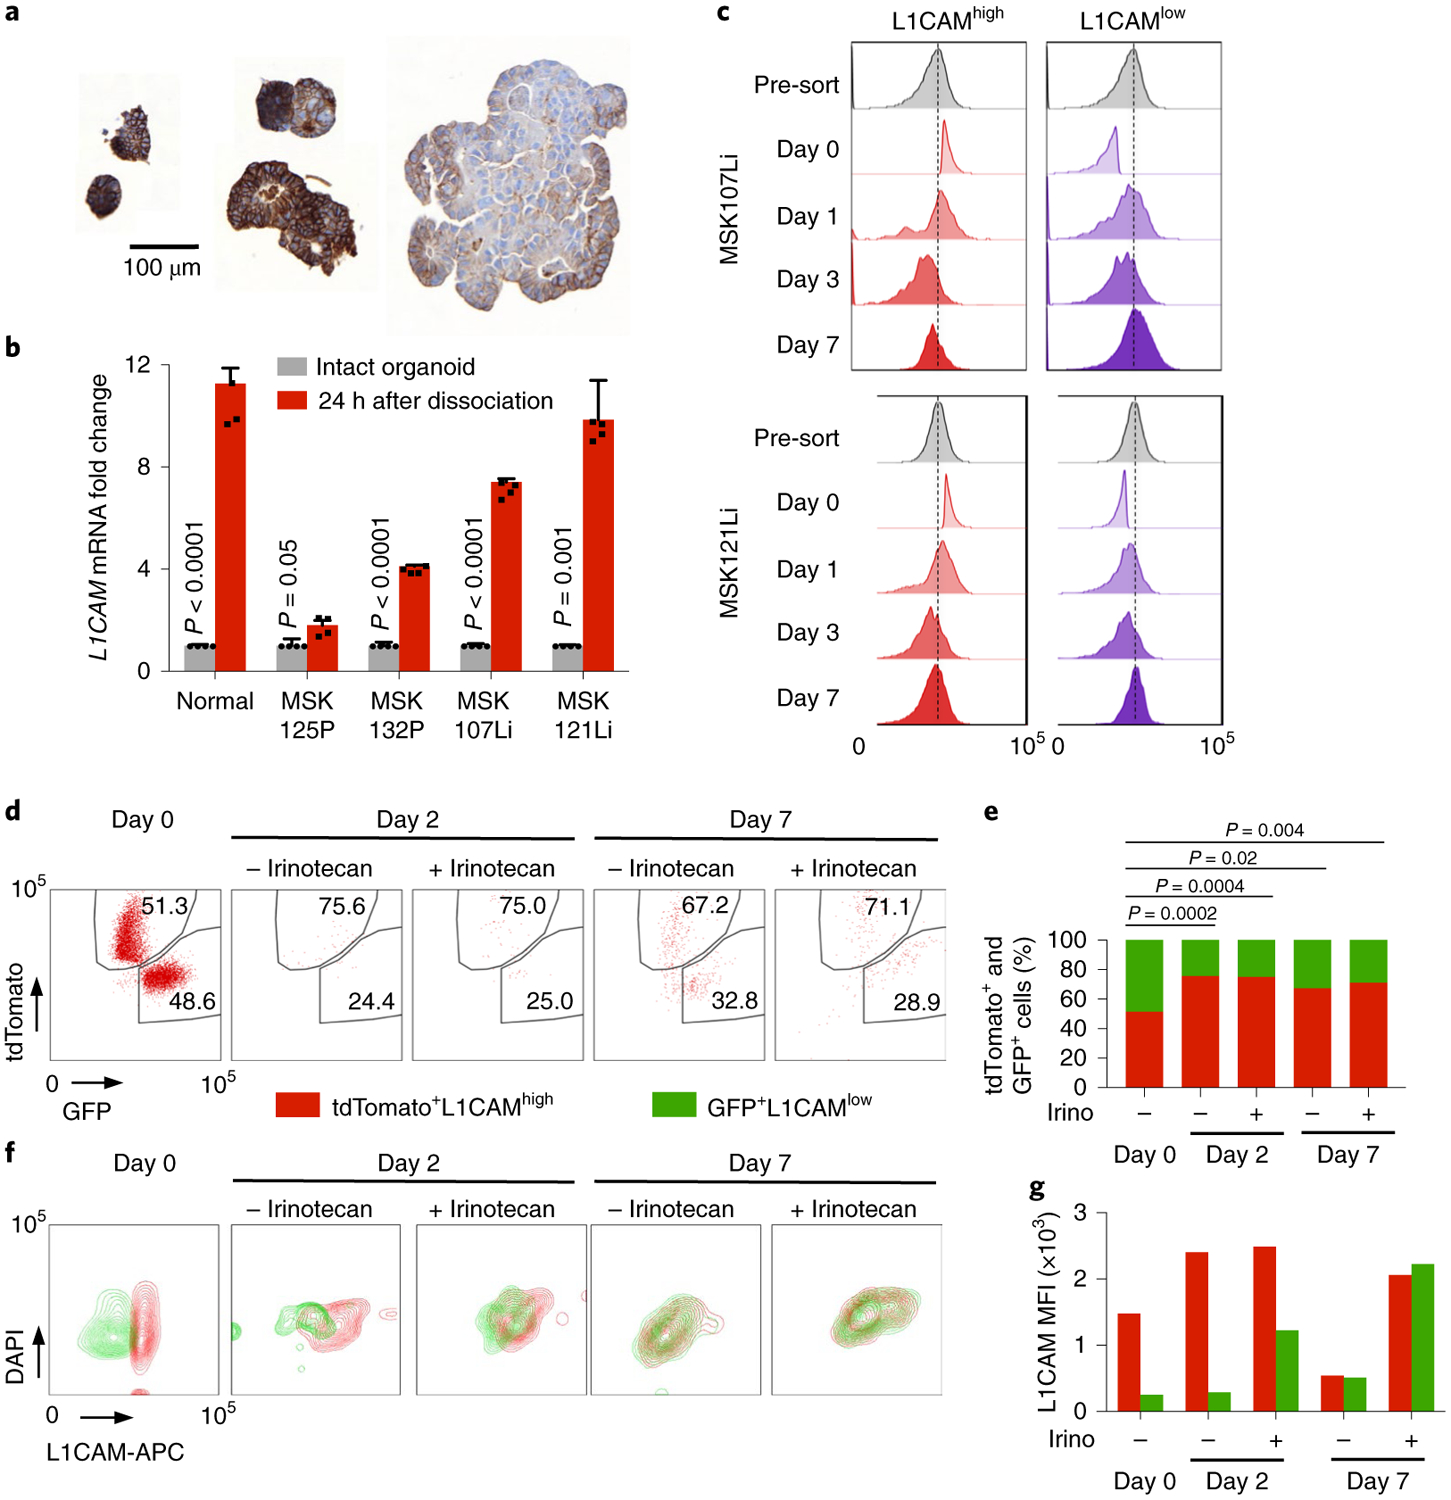
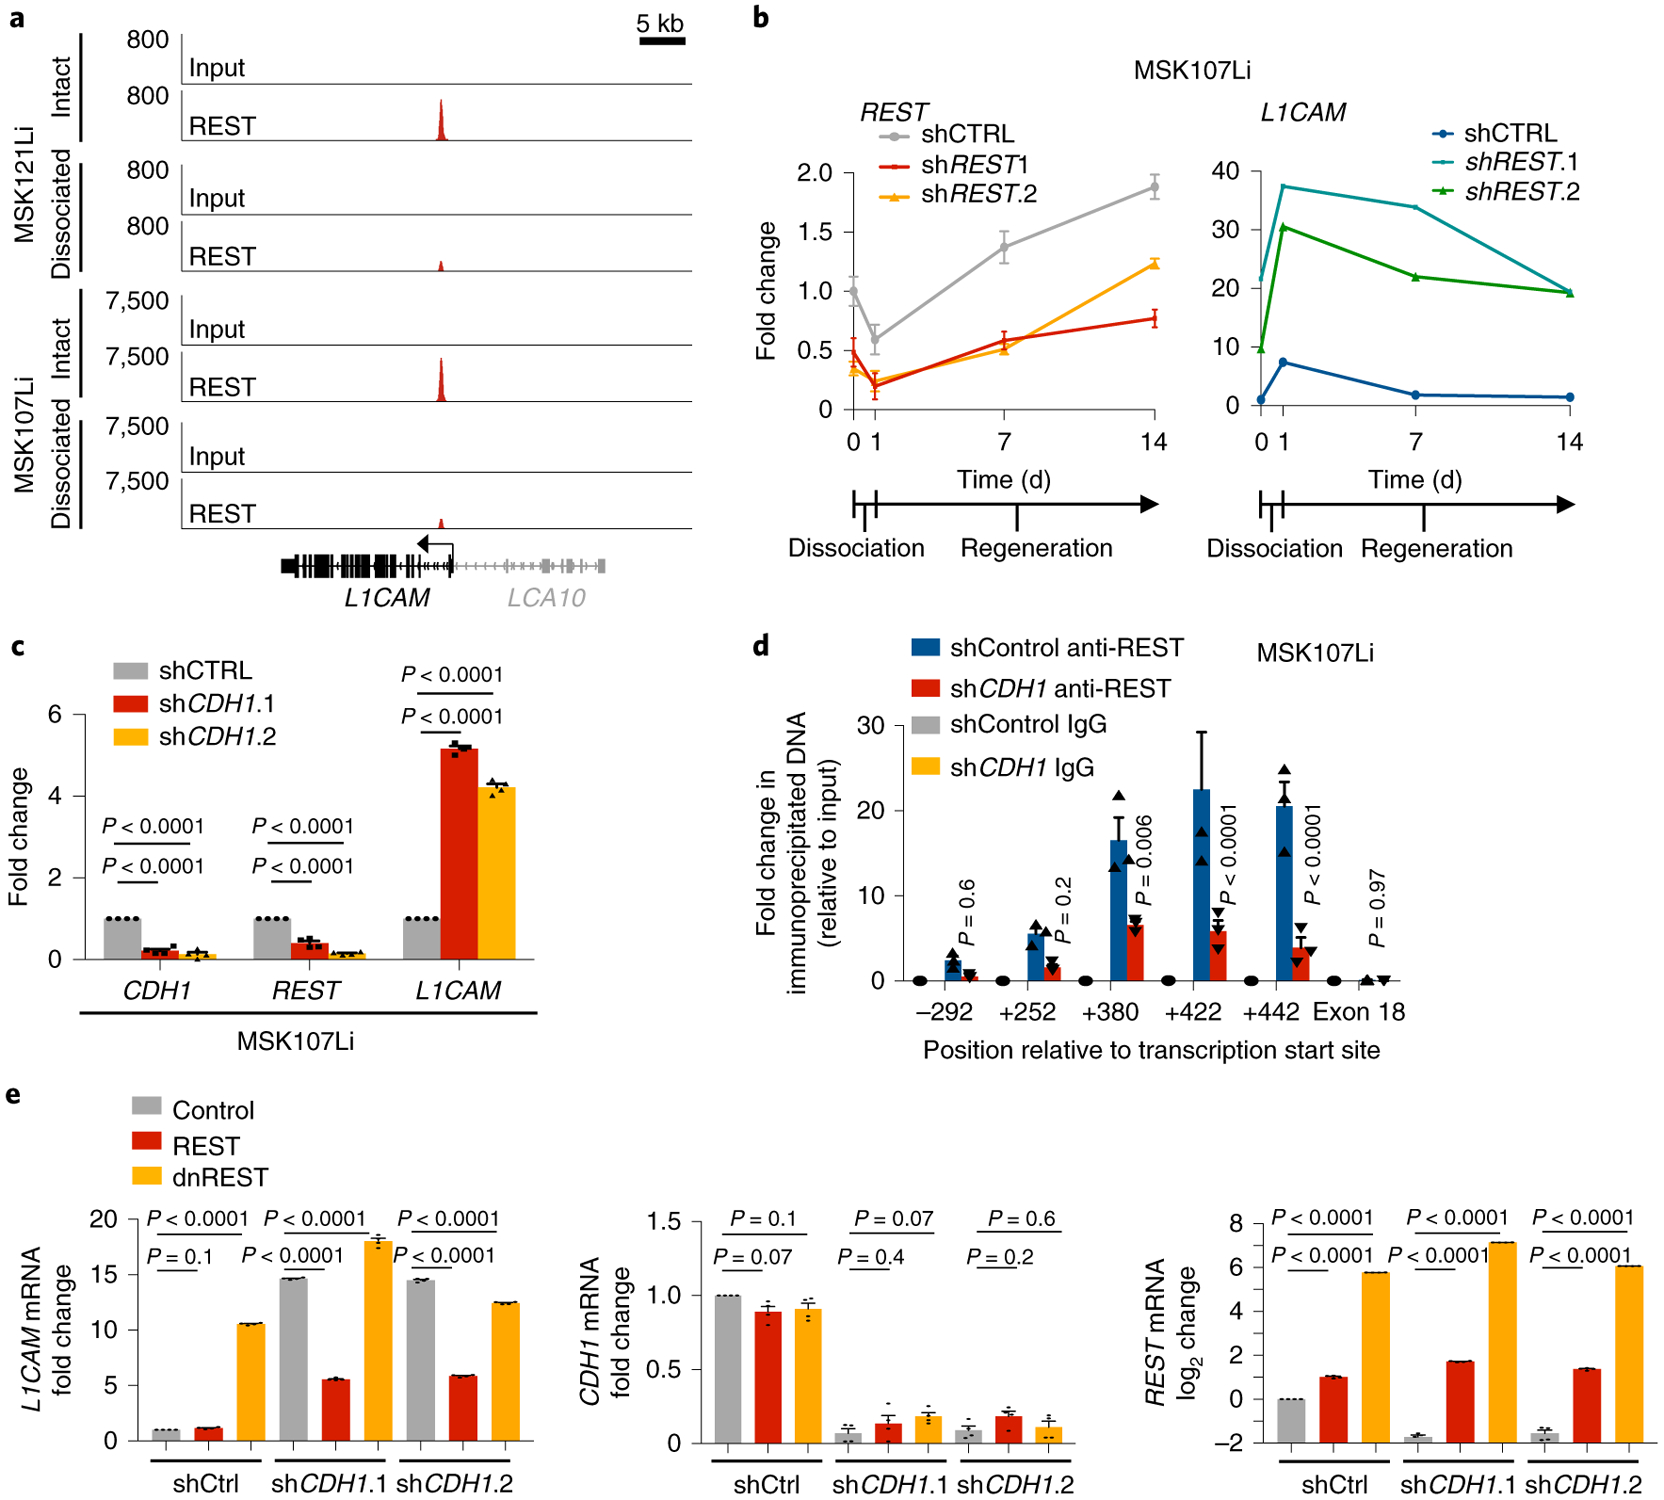
Metastasis-initiating cells with stem-like properties drive cancer lethality, yet their origins and relationship to primary-tumor-initiating stem cells are not known. We show that L1CAM+ cells in human colorectal cancer (CRC) have metastasis-initiating capacity, and we define their relationship to tissue regeneration. L1CAM is not expressed in the homeostatic intestinal epithelium, but is induced and required for epithelial regeneration following colitis and in CRC organoid growth. By using human tissues and mouse models, we show that L1CAM is dispensable for adenoma initiation but required for orthotopic carcinoma propagation, liver metastatic colonization and chemoresistance. L1CAMhigh cells partially overlap with LGR5high stem-like cells in human CRC organoids. Disruption of intercellular epithelial contacts causes E-cadherin-REST transcriptional derepression of L1CAM, switching chemoresistant CRC progenitors from an L1CAMlow to an L1CAMhigh state. Thus, L1CAM dependency emerges in regenerative intestinal cells when epithelial integrity is lost, a phenotype of wound healing deployed in metastasis-initiating cells.


Conflict of interest statement

Competing interests J.M. is a science advisor for and owns company stock in Scholar Rock.

Figures

Extended Data Fig. 1 |
Extended Data Fig. 1 |. Association of L1CAM expression with invasion, post-therapy residual disease and stemness.
a, Immunohistochemistry of serial sections of the primary tumour invasion front in a patient sample (refer to Fig. 1a) showing a cluster of L1CAM-expressing cells (left) invading a CD31 positive blood vessel (right). b, Representative brightfield image of organoids grown from L1CAMhigh (left) or L1CAMlow (right) cells flow-sorted from freshly resected patient CRC liver metastases. Representative of 7 patient tumours. c, Gating strategy for flow cytometry/sorting of epithelial cells from fresh CRC liver metastasis surgical specimens. Bottom right: histogram of mode normalized cell counts based on L1CAM expression. Gates identify L1CAMhigh and L1CAMlow cells in the EpCAM + population. Representative of 7 patient tumours d, Representative image showing subcutaneous tumour growth in mice transplanted with 50,000 organoid-derived flow-sorted L1CAMhigh (left) or L1CAMlow (right) cells. Representative of 5 mice per group. e, In vivo limiting dilution assay. NSG mice were transplanted with the indicated numbers of FACS sorted L1CAMhigh or L1CAMlow cells derived from MSK107Li organoids (n = 8 injections per dilution per group, 2 injections per mouse). Tumour formation was assayed 90 days following injection. Tumour-initiating cell frequency by limiting dilution analysis was 1 in 31,027 for L1CAMhigh cells, 1 in 491,441 for L1CAMlow cells (p = 0.03, χ2 test). f, Day 90 bioluminescent images (n = 8 injections per dilution per group, 2 injections per mouse). g, CRC metastasis organoid-derived xenografts retain patient tumour morphology. Hematoxylin & eosin staining of matched MSK107Li patient CRC liver metastasis (top) and organoid-derived subcutaneous xenograft (bottom) showing similar glandular tumour histology surrounding central necrosis. Representative of 4 tumour/organoid pairs (h, i) L1CAMhigh cells in organoid-derived xenografts retain selective organoid generation capacity. h, Brightfield images and i, viability (luminescence) of organoids grown from flow-sorted L1CAMlow (left) or L1CAMhigh (right) cells plated at 2000 cells/40μL matrigel in organoid media, 14 days following sorting. Boxplots, boxes show 25th-75th percentile with median, whiskers show min-max, n = 9 independently plated wells each, representative of 3 experiments from independent xenografts, two-sided Mann-Whitney U test.
Extended Data Fig. 2 |
Extended Data Fig. 2 |. Relationship between L1CAM expression and stemness.
a, Summary of clinical, genetic and treatment features of the patient-derived organoids assayed by scRNA-seq. Organoids were profiled using MSK-IMPACT next-generation sequencing to determine the presence of known oncogenic mutations based on OncoKB annotations. FOLFOX = 5-fluorouracil, leucovorin, oxaliplatin. (b–g) scRNAseq analysis of 9,974 cells from 4 patient-derived CRC organoids. (b, c) tSNE projection of all cells analysed, b, colored by patient, c, indicating expression levels of LGR5 and L1CAM (red = high, blue = low), d, Population distribution of L1CAM/LGR5 subpopulations identified in each primary tumour or metastasis organoid assayed. e, tSNE projection indicating expression of the revival stem cell signature (red = high, blue = low) (f, g) Violin plots (left) indicating expression of an EMT signature (f) or the KEGG fatty acid metabolism signature (g) comprising the genes shown on the heatmaps (right) in each L1CAM/LGR5 subpopulation. Bars indicated min to max. Heatmaps indicate relative expression of the indicated genes in each cluster. h, Flow cytometric analysis of stem cell marker expression in L1CAMhigh and L1CAMlow epithelial cells from freshly resected human CRC liver metastases, gated as in Figure S1C. Representative (of 12 independent patient tumours) flow cytometry contour plots showing stem cell marker expression in EpCAM+cells. i, Median EphB2, CD133 and CD44 expression in L1CAMhigh and L1CAMlow cells sorted from freshly resected and dissociated patient CRC liver metastases. Boxplots, boxes show 25th–75th percentile with median, whiskers show min-max, n = 12 tumours (one tumour per patient), two-sided Mann-Whitney U test.
Extended Data Fig. 3 |
Extended Data Fig. 3 |. L1CAM is required for laminin binding, survival and organoid regeneration by single cells.
a, L1CAM protein expression by flow cytometry (median ± s.e.m.) of MSK107Li cells 14 days following transduction with plasmids expressing Cas9 alone or together with sgRNA targeting L1CAM, shown as a percentage of the population transduced with Cas9 alone. n = 3 replicates per group, two-sided Student’s t-test. b, FACS sorted cells were seeded at a concentration of 2000 cells/40 μL and permitted to grow for 14 days. Viability assay showing luminescence (mean ± s.e.m.) of each population relative to luminescence on day 0 (dashed line); n = 3 organoid cultures per group, two-sided Mann-Whitney U test. c, Relative caspase-glo luminescence (mean ± s.e.m.) at the indicated timepoints during MSK107Li organoid growth relative to the time of single cell seeding (day 0). Data were normalized to cell viability measured at the same time points. (n = 3 organoid cultures per timepoint, p values compare shL1CAM.1-Dox vs. shL1CAM.1 + Dox and shL1CAM.2-Dox vs. shL1CAM.2 + Dox, two-sided Student’s t tests). d, MSK107Li organoid-derived single cells expressing a doxycycline-inducible L1CAM shRNA or control were seeded in the presence or absence of doxycycline as indicated. After 14 days, culture media was aspirated and replaced with doxycycline-free media, and permitted to grow for a further 14 days prior to measuring cell viability (luminescence, mean ± s.e.m.). n = 3 organoid cultures per timepoint, two-sided Mann-Whitney U test. e, Relative L1CAM mRNA expression (mean ± s.e.m.) in steady-state day 14 organoids, or residual organoid cells following 14 days of treatment with doxycycline and/or irinotecan as indicated. Data were normalized to GAPDH mRNA expression levels. n = 4 organoid cultures, two-sided Student’s t tests. f, Solid phase assay showing binding of 120 nM recombinant human L1CAM-Fc to plates coated with 30 nM of each of the indicated ligands. L1CAM-Fc was detected using HRP-conjugated anti-human IgG, chromogenic substrate was added and OD(450 nM) measured. Mean ± s.e.m., n = 4 wells per condition, representative of 2 independent experiments, two-sided Mann-Whitney U test. g, Dose-response curves showing binding of increasing concentrations of recombinant human L1CAM-Fc to plates coated with 30 nM of each of the indicated ligands. L1CAM-Fc was detected using HRP-conjugated anti-human IgG, chromogenic substrate was added and OD(450 nM) measured. Mean ± s.e.m., n = 5 wells/dose/condition, two-sided Mann-Whitney U test.
Extended Data Fig. 4 |
Extended Data Fig. 4 |. L1CAM is dispensable for adenoma formation but required for orthotopic tumour engraftment, local expansion, metastasis and chemoresistance.
Representative sections of colons from APCΔIEC and L1CAM/APCΔIEC mice stained with hematoxylin & eosin, and antibodies against Ki67, L1CAM or E-cadherin, showing no histopathological differences between the two groups. Representative of 5 mice in each group. (b–g) L1CAM inhibition impairs local tumour expansion and metastasis from murine orthotopic caecal transplants. b, Relative L1cam mRNA expression (mean ± s.e.m) in murine AKP organoids stably transduced with lentivirus directing the expression of doxycycline-inducible shRNA targeting L1cam or control, and treated with or without doxycycline for 48 h. Data were normalized to Gapdh mRNA expression levels. n = 4 organoid cultures, two-sided Student’s t test. c, Dissociated cells derived from AKP organoids transduced with lentivirus directing the expression of tdTomato-luciferase and shRNA against L1cam or control were injected into the caecal submucosa. Mice were monitored until caecal tumours were evident by ex vivo BLI imaging 3 weeks following injection, randomized based on BLI signal, and maintained on or off doxycycline diet for 5 weeks prior to euthanasia. Representative of 7 (−Dox), 13 mice (+Dox). (d–g) Quantification of whole animal or ex vivo BLI signal in each indicated organ per group, normalized to BLI at the time of randomization, is shown. Boxplot, boxes show 25th–75th percentile with median, whiskers show min to max, n = 12, 7, 7, 13 mice per group (left to right), two-sided Mann-Whitney U test. h, L1CAM immunohistochemistry in sections of orthotopic rectal xenografts (representative of 3 animals analysed per group) or i, liver metastases (representative of 3 animals analysed per group) from mice injected with cells derived from MSK107Li organoids expressing doxycycline-inducible shRNA targeting L1CAM. Mice were maintained on or off doxycycline (dox) diet as indicated. j, Representative (n = 8 (−Dox), n = 9 (+Dox)) ex vivo liver bioluminescence images related to i. k, Representative (n = 12 (−Dox, n = 11 (+Dox)) bioluminescent images of orthotopic caecal xenografts, liver and lung metastases derived from MSK121Li organoids expressing doxycycline-inducible shRNA targeting L1CAM, and randomized to treatment with or without doxycycline. (l, m) L1CAM immunohistochemistry in sections of subcutaneous xenograft tumours derived from MSK107Li organoids expressing doxycycline-inducible shRNA targeting L1CAM. Mice were treated with doxycycline diet and/or irinotecan chemotherapy as indicated. Mean ± s.e.m, n = 22, 15, 21, 19, 18, 23, 25, 21 fields from 3 mice per group (left to right), two-sided Mann-Whitney U test.
Extended Data Fig. 5 |
Extended Data Fig. 5 |. Apoptosis and plasticity of L1CAMlow cells.
a, Proportion of L1CAM expressing cells decreases as organoids grow. Flow cytometry mode-normalized histograms (top) and contour plots (bottom) showing L1CAM expression in the L1CAMhigh population in freshly resected, dissociated and flow-sorted CRC primary tumours and liver metastases (grey), and in organoids grown from these L1CAMhigh cells 21 days following initial sorting (red), showing a left shift in the population over time. n = 6 independent patient tumours. b, Organoid generation selects for L1CAM expression in L1CAMlow cells. Flow cytometry mode-normalized histograms (top) and contour plots (bottom) showing L1CAM expression in the L1CAMlow population in freshly resected, dissociated and flow-sorted CRC primary tumours and liver metastases (grey), and in organoids grown from these L1CAMlow cells 21 days following initial sorting (purple), showing a right shift in the population over time. n = 5 independent patient tumours. c, Median L1CAM fluorescence intensity of the unselected population of MSK107Li (top) or MSK121Li (bottom) organoid derived cells pre-sort (grey), and viable cells regenerated from flow-sorted L1CAMhigh (red) or L1CAMlow (purple) populations at the indicated time points after sorting. Histograms indicating the distribution of the populations are shown in Fig. 5c. Representative of 3 independent experiments. d, Flow cytometry density plots showing staining with Annexin V-FITC and propidium iodide (PI) in populations derived from L1CAMhigh or L1CAMlow cells flow-sorted from MSK107Li (top) or MSK121Li (bottom) organoids and analysed 48 h after reseeding. Representative of 3 independent experiments. n = 2807 cells (MSK107Li), 2182 cells (MSK121Li), two-sided χ2 tests. e, Median L1CAM-APC staining intensity of Annexin V-FITC + (apoptotic) or Annexin V-FITC- (non-apoptotic) populations derived from L1CAMhigh or L1CAMlow cells flow-sorted from MSK107Li/MSK121Li organoids and analysed 48 h after reseeding, gated and distributed as in d. Mean ± s.e.m, n = 3 independent organoid cultures, two-sided Student’s t test. f, Gating strategy for isolating mutually exclusive tdTomato+;GFP;L1CAMhigh and tdTomato;GFP+;L1CAMlow cells from organoids stably expressing each fluorescent protein.
Extended Data Fig. 6 |
Extended Data Fig. 6 |. Loss of membrane E-cadherin contacts drives L1CAM expression.
a, Epithelial disruption is a potent inducer of L1CAM expression. Relative L1CAM mRNA expression (mean ± s.e.m.) in intact normal colon organoids or organoid-derived single cells 24 h following dissociation. Gene expression was normalized to GAPDH mRNA expression. Organoids were cultured in media containing the indicated cytokines, or in conditioned media derived from DSS-colitis affected mouse colon. n = 4 organoid cultures per condition, two-sided Student’s t test. b, ChIP-PCR using antibodies against REST, or isotype control immunoglobulin in intact MSK107Li organoids or organoid-derived single cells 24 h following dissociation. Fold enrichment (mean ± s.e.m.) compared to the corresponding 2% input is shown. PCR primers (Extended Data Table 3) were selected to amplify immunoprecipitated DNA at the indicated number of residues from the L1CAM transcription site. p values indicate intact α-REST vs. dissociated α-REST, n = 3 independent experiments, two-sided Student’s t tests. c, Top: Venn diagram showing the number of genes in the vicinity of REST binding peaks observed in both MSK107Li and MSK121Li organoids, either in one integrity state or in both. Bottom: Table showing Biocarta pathway terms significantly enriched in the list of genes that lose REST ChIP-seq peaks upon dissociation of both MSK107Li and MSK121Li organoids. n = 2 independent experiments from 2 patient-derived organoids per integrity condition. Poisson-enrichment p value over background tag count. d, qRT-PCR showing relative REST and L1CAM mRNA expression (mean ± s.e.m.) in intact MSK121Li organoids (day 0), 24 h after dissociation and plating as single cells (day 1) and at the indicated time points during organoid regeneration. Organoids were transduced with lentivirus constitutively expressing shRNA targeting REST or control shRNA. Gene expression was normalized to the mRNA expression of GAPDH. Day 1 shCTRL vs. shREST.1: p = 0.01 (REST), p < 0.0001 (L1CAM); shCTRL vs. shREST.2: p = 0.02 (REST), p < 0.0001 (L1CAM); n = 4 organoid cultures per sample per time point, two-sided Student’s t tests. e, Relative mRNA expression (mean ± s.e.m.) of CDH1, REST and L1CAM in intact MSK121Li organoids transduced with lentivirus constitutively expressing shRNA targeting CDH1 or control shRNA. n = 4 organoid cultures per group, two-sided Student’s t tests.
Fig. 1 |
Fig. 1 |. L1CAM marks chemoresistant organoid-generating cells in human CRC.
a, L1CAM expression is increased in liver metastases (Met) as compared to matched primary tumors (Pri). Immunohistochemistry (IHC) for L1CAM is shown in matched normal colon, primary CRC tumor and liver metastasis sections from a representative patient. Arrows indicate L1CAM staining at the invasion front of the primary tumor. Detail of the boxed region is shown in Extended Data Fig. 1a. b, The percentage of L1CAM-expressing tumor cells in each section. In box plots, boxes show the 25th–75th percentile with the median, and whiskers show the minimum-maximum; n = 18 paired patient samples; two-sided Wilcoxon matched-pairs signed-rank test. c, Percentage of L1CAM-expressing cells in matched pretreatment (pre-treat.) biopsies and post-treatment (post-treat.) surgically resected residual disease in patients with locally advanced rectal cancer. In box plots, boxes show the 25th–75th percentile with the median, and whiskers show the minimum-maximum; n = 31 patients; two-sided Wilcoxon matched-pairs signed-rank test. d, Representative sections of paired pretreatment core biopsies and matched surgical resection specimens obtained after chemoradiation, from two patients with rectal adenocarcinoma, showing L1CAM expression in peripheral areas of residual adenocarcinoma after treatment. e, L1CAM immunohistochemistry in a human CRC liver metastasis resected after neoadjuvant chemotherapy, showing dense stromal infiltration and L1CAM-expressing residual tumor cell clusters. Representative of 18 samples analyzed. f, Tumor L1CAM expression is associated with greater organoid generation capacity. Median L1CAM expression is shown for freshly resected and dissociated patient CRC liver metastases measured by flow cytometry before plating of 10,000 cells in 40 μl of Matrigel using organoid medium. Organoid generation ability was assessed 14 d after plating. In box plots, boxes show the 25th–75th percentile with the median, and whiskers show the minimum-maximum; n = 14 paired patient tumor samples; two-sided Mann-Whitney U test. g, Number of organoids (mean ± s.e.m.) grown from 10,000 L1CAMhigh or L1CAMlow cells flow-sorted from freshly resected patient CRC primary tumors (P, left) or liver metastases (Li, right), counted 14 d after surgical resection and flow sorting. From left to right, n = 3, 3, 3, 3, 3, 3, 3, 3, 3, 4, 3, 4, 4 and 11 replicates per group from each of seven patients; two-tailed Student’s t tests. h, Subcutaneous tumor volumes measured 35 d after transplantation of mice with 50,000 organoid-derived flow-sorted L1CAMhigh or L1CAMlow cells (mean ± s.e.m.); n = 5 mice per group; two-tailed Mann-Whitney U test. i, Biaxial density plot showing relative expression of L1CAM and LGR5 in 9,974 cells from four independent patient-derived metastatic CRC organoids subjected to scRNA-seq. Five clusters identified according to relative L1CAM and LGR5 expression are overlaid as colors on the density plot. j, Dual LGR5 mRNA FISH and L1CAM immunofluorescence (IF) on a patient primary CRC tissue section (top, low magnification; bottom, high magnification), showing discrete expression levels of LGR5 and L1CAM in different cell clusters, including double-positive cells. Representative field of eight tumor sections from four patients analyzed.
Fig. 2 |
Fig. 2 |. L1CAM is a mediator of organoid and tumor regeneration.
a, L1CAM is required for organoid regeneration. CRC107Li organoid-derived cells were transduced with lentivirus directing the expression of either Cas9 alone or Cas9 with sgRNAs targeting L1CAM and allowed to grow under antibiotic selection for 14 d, when they were flow-sorted and seeded at a concentration of 2,000 cells per 40 μl of Matrigel in independent wells of a 96-well plate. The number of organoids (mean ± s.e.m.) established from each population 14 d after sorting and seeding is shown. From left to right, n = 10, 13 and 11 organoid cultures per group; two-tailed Mann-Whitney U test. b,c, L1CAM knockdown inhibits regrowth of multiple patient-derived organoids. Organoids derived from four patients with metastatic CRC were transduced with lentiviruses directing the expression of doxycycline (Dox)-inducible shRNA targeting L1CAM, expanded and, where indicated, treated with doxycycline for 48 h before dissociation and seeding at a concentration of 2,000 cells per 40 μl of Matrigel. Knockdown efficiencies of two independent L1CAM-targeting shRNAs in four patient-derived organoids (b) and relative cell viability on day 14 as compared to day 0 (mean ± s.e.m.) after plating of organoid-derived single cells (c) are shown. n = 6 organoid cultures per group; two-sided Student’s t tests. d, L1CAM is required for subcutaneous tumor growth in vivo. MSK107Li organoid-derived cells (50,000) expressing a doxycycline-inducible shRNA targeting L1CAM were injected subcutaneously into each flank of immunodeficient NSG mice. Where indicated, organoids were treated with doxycycline 2 d before transplantation and mice were maintained on a doxycycline diet for the duration of the experiment. Tumor volume (mean ± s.e.m.) was measured with calipers at the indicated time points after subcutaneous inoculation. n = 10 tumors from five mice per group; two-tailed Mann-Whitney U test. e, Representative image and quantification of tumor bioluminescence measured 35 d after inoculation. In box plots, boxes show the 25th–75th percentile with the median, and whiskers show the minimum-maximum; n = 10 tumors from five mice per group; two-sided Mann-Whitney U test. f, Day 21 steady-state MSK107Li and MSK121Li organoids were incubated in medium containing 50 μM irinotecan, and L1CAM expression was measured in residual DAPI cells 7 d later. Top- flow cytometry plots showing distribution of the data. Bottom: bars showing median fluorescence intensity of L1CAM expression in each population. From left to right, n = 6,512, 130, 8,542 and 49 cells per group, representative of three independent experiments. g, Single cells derived from CRC107Li organoids transduced with lentivirus directing expression of the indicated shRNAs were seeded at a concentration of 2,000 cells per 40 μl grown as organoids for 21 d and then treated with doxycycline and/or irinotecan (irino) as indicated. The viability assay shows the luminescence (mean ± s.e.m.) of each population relative to the luminescence at the time that drug treatment was started (day 0); n = 5 organoid cultures per group; two-sided Mann-Whitney U test. h, Solid-phase binding assay showing dose-response curves of recombinant human L1CAM-Fc binding to plates coated with equimolar concentrations of the indicated proteins. After washing, bound L1CAM-Fc was detected with horseradish peroxidase (HRP)-conjugated anti-human IgG, HRP substrate was added and OD450 was measured. Data are shown as the mean ± s.e.m; n = 5 wells per time point, representative of three independent experiments; two-tailed Mann-Whitney U test. i, L1CAM mediates the interaction of dissociated CRC cells with laminin isoforms. Single cells derived from MSK121Li organoids (3,000) cultured in the presence or absence of doxycycline to knock down L1CAM were seeded in wells coated with 30 nM of the indicated proteins. After 1 h of adhesion and extensive washing, the percentage of adherent cells (mean ± s.e.m.) was measured as the relative luminescence of each well immediately after plating. n = 10 organoid cultures per condition; two-tailed Mann-Whitney U tests.
Fig. 3 |
Fig. 3 |. Disruption of the epithelial niche induces L1CAM expression.
a, Immunohistochemistry for L1CAM (top) and Ki67 (bottom) in serial sections of a representative human CRC primary tumor invasion front showing an inverse relationship between L1CAM and Ki67 expression. Representative of 16 tumors analyzed. b, Immunohistochemistry for L1CAM (top) and Ki67 (bottom) in serial sections of a representative post-treatment human CRC liver metastasis demonstrating L1CAMhighKi67low cells in organized epithelial structures and L1CAMhighKi67high cells in disrupted epithelia. Representative of 16 tumors analyzed. c, Percentage of L1CAMhigh and L1CAMlow cells that are also Ki67high in regions of intact versus disrupted glandular epithelial architecture within CRCs. In box plots, boxes show the 25th–75th percentile with the median, and whiskers show the minimum-maximum; from left to right, n = 64, 54, 28 and 34 independent fields from 16 patient tumors; two-sided Mann-Whitney U tests. d, Immunohistochemistry for L1CAM (top) and Ki67 (bottom) in serial sections of MSK107Li matched surgically resected patient CRC liver metastasis, metastasis-derived organoids and organoid-derived subcutaneous xenograft. Dashed red lines indicate the tumor-stromal boundary. Box plots indicate the percentage of Ki67+ cells among L1CAMhigh cells in the indicated sections. In box plots, boxes show the 25th–75th percentile with the median, and whiskers show the minimum-maximum; from left to right, n = 7, 9 and 9 independent fields; two-sided Mann-Whitney U tests. e,f, L1CAM is induced during normal epithelial organoid formation. Relative L1CAM mRNA levels (mean ± s.e.m.) are shown for human (e) and mouse (f) cells freshly isolated from intact colons or collected after 14 d of growth in organoid conditions. Data were normalized to GAPDH mRNA levels. n = 4 crypts or organoid cultures from each of three patients or mice; two-sided Student’s t tests. g, Relative LGR5 mRNA levels (mean ± s.e.m.) in human cells freshly isolated from intact colons or collected after 14 d of growth in organoid conditions. Data were normalized to GAPDH mRNA levels. n = 4 crypts or organoid cultures from each of three patients; two-sided Student’s t tests. h, L1CAM is induced during epithelial regeneration after colitis. C57BL/6J mice were given 3.5% DSS in their drinking water for 5 d, inducing maximal colitis by day 7, and were then maintained on water without DSS for 12 d. Mice were killed at each of the indicated time points, and their colons were collected, sectioned and either stained with Kreyberg-Jareg stain (blue, mucin; pink, collagen) or subjected to immunohistochemistry for L1CAM. Representative images of three independent experiments are shown. i, High-magnification view showing detail of L1CAM immunohistochemical staining throughout the length of the intestinal crypt, representative of three mice each from three independent experiments.
Fig. 4 |
Fig. 4 |. L1CAM is required for epithelial regeneration after colitis.
a, L1CAM immunohistochemistry in a representative colon section from an L1CAMΔIEC mouse maintained on water with DSS, showing L1CAM staining restricted to submucosal neurons and no L1CAM expression in the epithelial cells of the crypt. Representative of three independent mice. bf, L1CAM deficiency impairs epithelial healing following DSS-induced colitis. L1CAMfl/y and L1CAMΔIEC mice were given 3.5% DSS in their drinking water for 5 d, followed by 12 d of water without DSS before being killed. b, Kaplan-Meier survival curves. n = 26 mice per group from three independent experiments; two-sided Mantel-Cox test. c, Disease activity index (composite of weight loss, diarrhea and rectal bleeding) measured at the time of maximal colitis on day 7. In box plots, boxes show the 25th–75th percentile with the median, and whiskers show the minimum-maximum; n = 26 mice per group; two-sided Mann-Whitney U test. d, Histological score (composite of inflammation, mucosal denudation and crypt dysmorphia) on day 14. L1CAMfl/y, n = 24; L1CAMΔIEC, n = 12. In box plots, boxes show the 25th–75th percentile with the median, and whiskers show the minimum-maximum; two-sided Mann-Whitney U test. e, Representative histological sections with Kreyberg-Jareg staining (blue, mucin; pink, collagen) and immunohistochemical staining for L1CAM showing denudation of mucin-producing crypts in L1CAMΔIEC mice on day 14. Panels on the right show higher magnification of less damaged areas of the colon exhibiting loss of L1CAM immunostaining in crypts of L1CAMΔIEC mice. Representative of three independent experiments. fl, L1CAM deficiency in the progeny of LGR5-expressing cells impairs epithelial healing after DSS-induced colitis. f, Immunohistochemistry for GFP in a representative colon section from an L1CAMΔLGR5 mouse killed after 5 d of daily tamoxifen treatment. n = 3 mice. g, WTΔLGR5 and L1CAMΔLGR5 mice were treated as in f and killed, and their colon crypts were isolated and seeded for organoid generation. Representative flow cytometry assessment is shown of L1CAM expression 24 h after seeding. n = 2 mice per genotype. h, Schematic of experimental design. Mice were treated with tamoxifen for 5 d to induce Lgr5-GFP-IRES-creERT2 expression and subsequently treated with 3% DSS for 5 d, with maximal colitis by day 7. They were then maintained on water without DSS for a further 12 d before being killed. i, Representative histological sections with Kreyberg-Jareg staining (blue, mucin; pink, collagen) and immunohistochemical staining for L1CAM showing denudation of mucin-producing crypts in the distal colon in L1CAMΔLGR5 mice on day 14, while crypts are restored in L1CAMfl/y and WTΔLGR5 mice. The panels on the right show higher magnification of less damaged areas of the colon exhibiting loss of L1CAM immunostaining in crypts in L1CAMΔLGR5 mice in comparison to L1CAMfl/y and WTΔLGR5 mice. Representative of 20 evaluable mice from two independent experiments. j, Kaplan-Meier plot showing cumulative survival of L1CAMfl/y, WTΔLGR5 and L1CAMΔLGR5 mice. n = 33 mice from two independent experiments; two-sided Mantel-Cox tests. k, Disease activity index (composite of weight loss, diarrhea and rectal bleeding) measured at the time of maximal colitis on day 7. In box plots, boxes show the 25th–75th percentile with the median, and whiskers show the minimum-maximum; n = 33 mice from two independent experiments; two-sided Mann-Whitney U tests. l, Histological scores (composite of inflammation, mucosal denudation and crypt dysmorphia) on day 14. In box plots, boxes show the 25th–75th percentile with the median, and whiskers show the minimum-maximum; n = 20 evaluable mice from two independent experiments; two-sided Mann-Whitney U tests.
Fig. 5 |
Fig. 5 |. L1CAM is dispensable for adenoma formation but is required for orthotopic tumor engraftment, local expansion, metastasis and chemoresistance.
a,b, L1CAM is not required for intestinal adenoma formation. Male APCΔIEC and L1CAM/APCΔIEC mice were killed at 3 months of age, and their colons were collected, sectioned and examined for adenoma formation. a, Number of adenomas per mouse intestine. In box plots, boxes show the 25th–75th percentile with the median and whiskers show the minimum-maximum; n = 5 mice per group; two-sided Mann-Whitney U test. b, Mean adenoma diameter per mouse. In box plots, boxes show the 25th–75th percentile with the median, and whiskers show the minimum-maximum; n = 5 mice per group; two-sided Mann-Whitney U test. ce, L1CAM inhibition impairs orthotopic rectal tumor engraftment. NSG mice were given 3% DSS in their water for 5 d and then maintained on water without DSS for 2 d before intraluminal transplantation with 2 × 10⁵ cells from dissociated MSK107Li organoids expressing doxycycline-inducible shRNA targeting L1CAM or control shRNA. Where indicated, organoids were treated in vitro with doxycycline starting 2 d before transplantation, and mice were maintained on a doxycycline diet. Mice were killed 90 d after transplantation, and their colons were collected and examined for tumor engraftment. c, Percentage of mice with an engrafted orthotopic tumor. From left to right, the stacked bar graphs show n = 7, 7, 10, 13, 9 and 7 mice per group from three independent experiments; two-sided chi-squared tests. d,e, Tumor diameter per engrafted mouse (in box plots, boxes show the 25th–75th percentile with the median, and whiskers show the minimum-maximum; from left to right, n = 6, 5, 6, 4, 5 and 1 mice from three independent experiments; two-sided Mann-Whitney U tests) (d) and representative H&E-stained sections (e). Arrows indicate tumour diameter. f,g, L1CAM inhibition impairs metastatic colonization of the liver. Cells (5 × 10⁴) were derived from dissociated MSK107Li organoids with doxycycline-inducible expression of shRNA targeting L1CAM. Where indicated, organoids were treated with doxycycline starting 2 d before transplantation and mice were maintained on a doxycycline diet. Representative H&E-stained sections of liver metastases at the experimental endpoint (arrows indicate tumour diameter) (f) and quantification of ex vivo liver bioluminescence signal measured 60 d after transplantation (g) are shown. In box plots, boxes show the 25th–75th percentile with the median, and whiskers show the minimum-maximum; from left to right, n = 9, 10, 8, 9, 5 and 5 mice per group; two-sided Mann-Whitney U tests. hl, L1CAM inhibition impairs local tumor expansion and metastasis from orthotopic cecal xenografts. h, Schematic of the experiment: cells (4 × 10⁵) derived from MSK121Li organoids transduced with lentivirus directing the expression of tdTomato-luciferase and shRNA targeting L1CAM or control shRNA were injected into the cecal submucosa. Mice were monitored until cecal tumors were evident by ex vivo bioluminescence imaging 3 weeks after injection, randomized on the basis of bioluminescence signal and maintained on or off a doxycycline diet for 7 weeks before being killed. il, Quantification of whole-mouse bioluminescence signal (i) and ex vivo bioluminescence signal in the cecum (j), liver (k) and lung (l), normalized to bioluminescence at the time of randomization. In box plots, boxes show the 25th–75th percentile with the median, and whiskers show the minimum-maximum; from left to right, n = 5, 6, 12 and 11 mice per group; two-sided Mann-Whitney U tests. mo, Combination of L1CAM inhibition with chemotherapy impairs tumor growth to a greater extent than chemotherapy alone. m, Schematic of the experiment. Cells (2 × 10⁵) derived from MSK107Li organoids transduced with lentivirus directing the expression of tdTomato-luciferase and shRNA targeting L1CAM or control shRNA were injected subcutaneously; mice were randomized on the basis of bioluminescence intensity 5 weeks after injection and maintained on a doxycycline diet and/or treated weekly with irinotecan as indicated for 4 weeks before being killed. n,o, Ex vivo tumor volume (n) and mass (o), normalized to tumor bioluminescence at the time of randomization. From left to right, n = 10, 10, 8, 7, 10, 10, 10 and 9 tumors per group; mean ± s.e.m.; two-sided Mann-Whitney U tests.
Fig. 6 |
Fig. 6 |. Plasticity of the L1CAMhigh phenotype.
a, L1CAM expression is dynamically regulated during organoid growth. L1CAM immunohistochemistry of CRC organoids of varying size shows progressive restriction of L1CAM expression to cells at the periphery and an overall decrease in L1CAM expression with increasing organoid size. Representative of six organoid lines analyzed. b, L1CAM is induced by dissociation of normal, primary tumor and metastatic human organoids. Relative L1CAM mRNA levels, normalized to GAPDH mRNA levels (mean ± s.e.m.), were measured in intact organoids versus organoid-derived single-cell suspensions plated in Matrigel and assayed 24 h after dissociation. n = 4 replicates per group; two-sided Student’s t tests. c, Time course of regenerating organoids derived from L1CAMhigh (left) and L1CAMlow (right) cells flow-sorted from day 21 MSK107Li (top) and MSK121Li (bottom) organoids. Histograms show the distribution of L1CAM expression (measured by APC fluorescence) in each population at the indicated time points after flow sorting. Representative of three independent experiments. d,e, Dynamic induction of the L1CAMhigh phenotype by a subset of pre-existing L1CAMlow cells. CRC107Li organoids were labeled with lentivirally expressed tdTomato or GFP, and flow-sorted tdTomato+GFPL1CAMhigh and tdTomatoGFP+L1CAMlow cells were mixed in equal proportions and allowed to regrow as organoids in the presence or absence of irinotecan. Flow plots of the distribution of tdTomato- and GFP-expressing cells (d) and the relative proportions of these cells in the population (e) are shown from monitoring by flow cytometry at the indicated time points after mixing; from left to right, n = 17, 107, 68, 251, 484 and 348 DAPI single cells representative of three independent experiments with two organoid lines; two-sided chi-squared tests. f,g, Flow cytometry contour plots showing the distribution of L1CAM expression at the indicated time points in the presence or absence of chemotherapy (f) and median fluorescence intensity (MFI) of L1CAM expression (measured by APC) in cells derived from tdTomato+GFPL1CAMhigh and tdTomatoGFP+L1CAMlow precursors on each day (g), representative of three independent experiments with two organoid lines.
Fig. 7 |
Fig. 7 |. Loss of E-cadherin-dependent cell contact downregulates REST and enables L1CAM expression.
a, REST ChIP-seq analysis, showing diminution of the REST peak at the L1CAM intronic enhancer in dissociated organoid-derived cells, collected 16 h after dissociation, in comparison to intact organoids. Input control is also shown. LCA10 (gray) is not expressed in CRC organoids. Two independent organoid cultures from two patient-derived organoid lines were analyzed per condition. b, Relative mRNA levels (mean ± s.e.m.) of REST and L1CAM in intact MSK107Li organoids (day 0), cells collected 24 h after dissociation and plating as single cells (day 1), and cells collected at the indicated time points during organoid regeneration. Organoids were transduced with lentivirus constitutively expressing shRNA targeting REST or control shRNA. Gene expression was normalized to GAPDH mRNA levels. Day 1 shControl versus shREST.1: P < 0.0001 (REST), P < 0.0001 (L1CAM); day 1 shControl versus shREST.2: P = 0.007 (REST), P < 0.0001 (L1CAM); n = 4 organoid cultures per sample per time point; two-sided Student’s t tests. c, Relative expression of CDH1, REST and L1CAM (mean ± s.e.m.) in intact MSK107Li organoids transduced with lentivirus constitutively expressing shRNA targeting CDH1 or control shRNA. n = 4 organoid cultures per group; two-sided Student’s t tests. d, ChIP-PCR using antibodies against REST or isotype-control immunoglobulin in intact MSK107Li organoids transduced with lentivirus constitutively expressing shRNA targeting CDH1 or control shRNA. Fold enrichment (mean ± s.e.m.) is shown relative to the corresponding 2% input. PCR primers were selected to amplify immunoprecipitated DNA at the indicated positions relative to the L1CAM transcriptional start site. P values correspond to the comparison between shControl anti-REST and shCDH1 anti-REST; n = 3 organoid cultures per condition; two-sided Student’s t tests. e, Induction of L1CAM expression by E-cadherin knockdown can be rescued by REST but not by dominant-negative REST (dnREST). Relative mRNA levels of L1CAM, CDH1 and REST are shown in MSK107Li organoids stably expressing shRNA targeting CDH1 or control shRNA as well as cDNA expressing REST or dnREST. Gene expression was normalized to the mRNA levels of GAPDH. Data are shown as the mean ± s.e.m.; n = 4 organoid cultures per group; two-sided Student’s t tests.
Fig. 8 |
Fig. 8 |. Epistasis analysis of E-cadherin, REST and L1CAM.
a, L1CAM inhibition rescues the increase in organoid generation secondary to REST inhibition. MSK107Li organoids stably expressing the indicated shRNAs were grown in the presence or absence of doxycycline for 7 d before measuring cell viability (luminescence relative to day 0; in box plots, boxes show the 25th–75th percentile with the median, and whiskers show the minimum-maximum; n = 6 organoid cultures per group; two-sided Mann-Whitney U tests). b, Relative mRNA levels of L1CAM and REST on day 0, normalized to GAPDH, in organoid-derived cells transduced with lentiviruses directing expression of the indicated shRNAs in the presence or absence of doxycycline. Data are shown as the mean ± s.e.m.; n = 4 organoid cultures per group; two-sided Student’s t tests. c, Left: schematic diagram showing how loss of epithelial integrity induces L1CAM expression during wound healing and tumor invasion, ultimately driving metastatic relapse. Right schematic diagram showing that loss of membrane E-cadherin in cells detached from their epithelial niche downregulates and displaces REST from the L1CAM enhancer, thus enabling L1CAM expression.

Comment in

References

    1. Batlle E & Clevers H Cancer stem cells revisited. Nat. Med 23, 1124–1134 (2017). - PubMed
    1. Celia-Terrassa T & Kang Y Distinctive properties of metastasis-initiating cells. Genes Dev. 30, 892–908 (2016). - PMC - PubMed
    1. Lambert AW, Pattabiraman DR & Weinberg RA Emerging biological principles of metastasis. Cell 168, 670–691 (2017). - PMC - PubMed
    1. Massague J & Obenauf AC Metastatic colonization by circulating tumour cells. Nature 529, 298–306 (2016). - PMC - PubMed
    1. Reya T, Morrison SJ, Clarke MF & Weissman IL Stem cells, cancer, and cancer stem cells. Nature 414, 105–111 (2001). - PubMed

Publication types

Substances