. 2021 Mar;529(4):828-852.
doi: 10.1002/cne.24983. Epub 2020 Aug 4.

The entorhinal cortex of the monkey: VI. Organization of projections from the hippocampus, subiculum, presubiculum, and parasubiculum

Affiliations

The entorhinal cortex of the monkey: VI. Organization of projections from the hippocampus, subiculum, presubiculum, and parasubiculum

Menno P Witter et al. J Comp Neurol. 2021 Mar.

Abstract

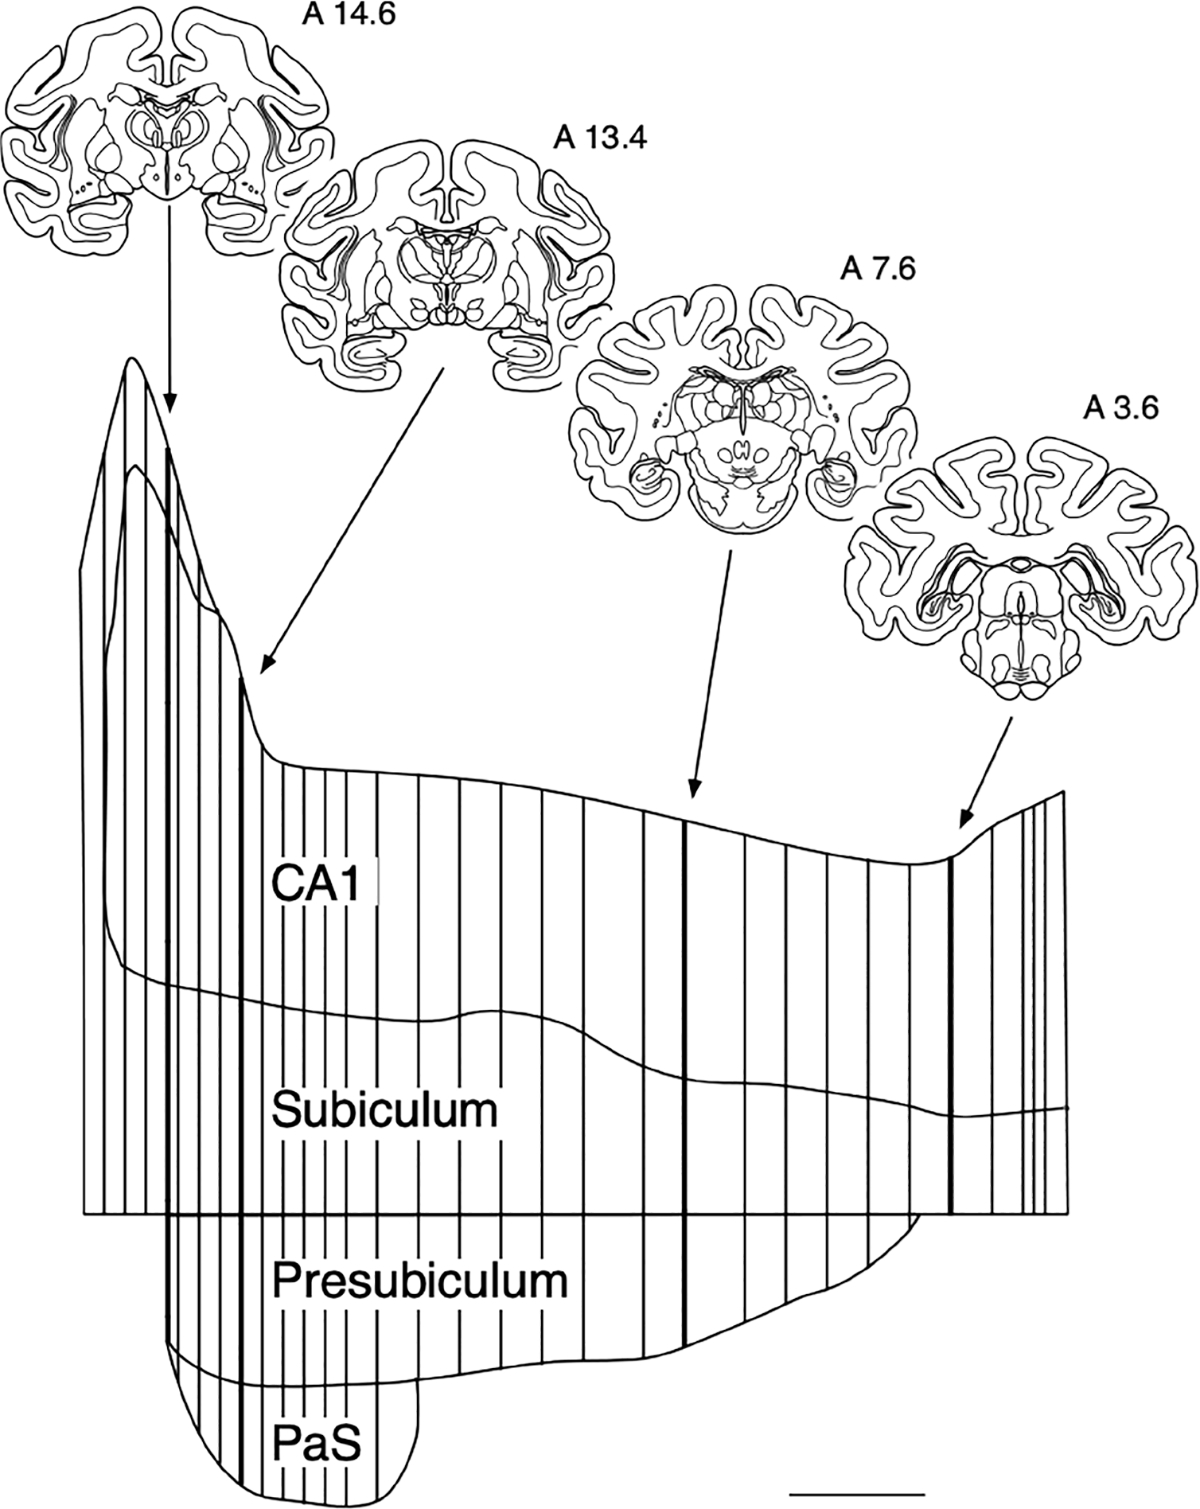
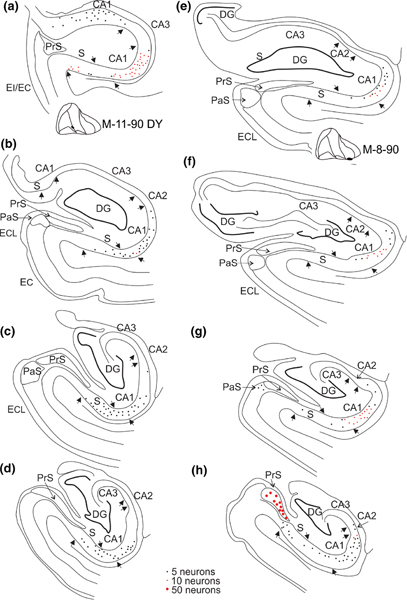
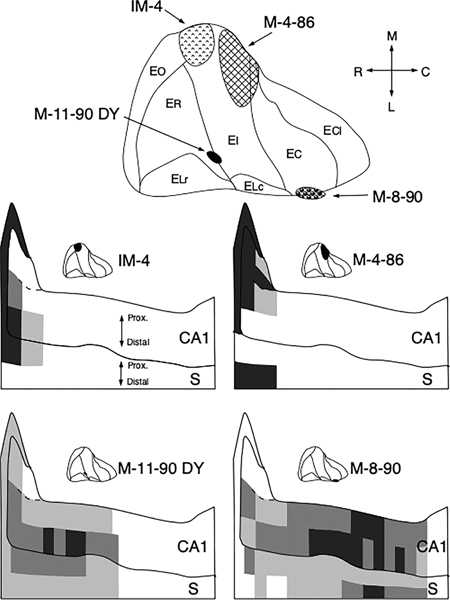
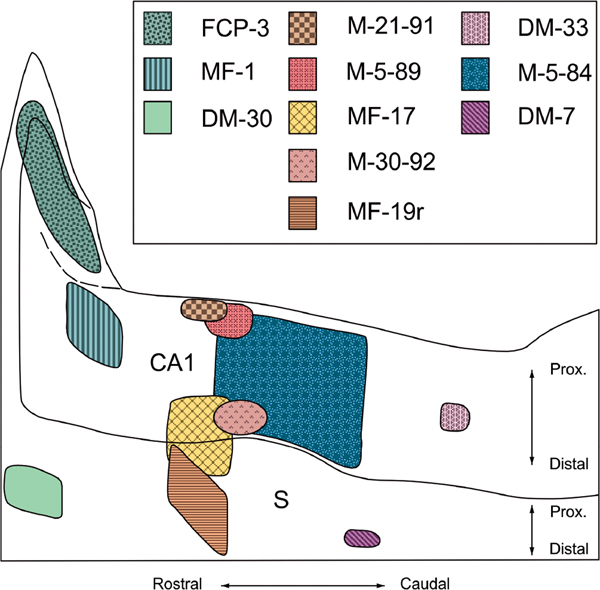
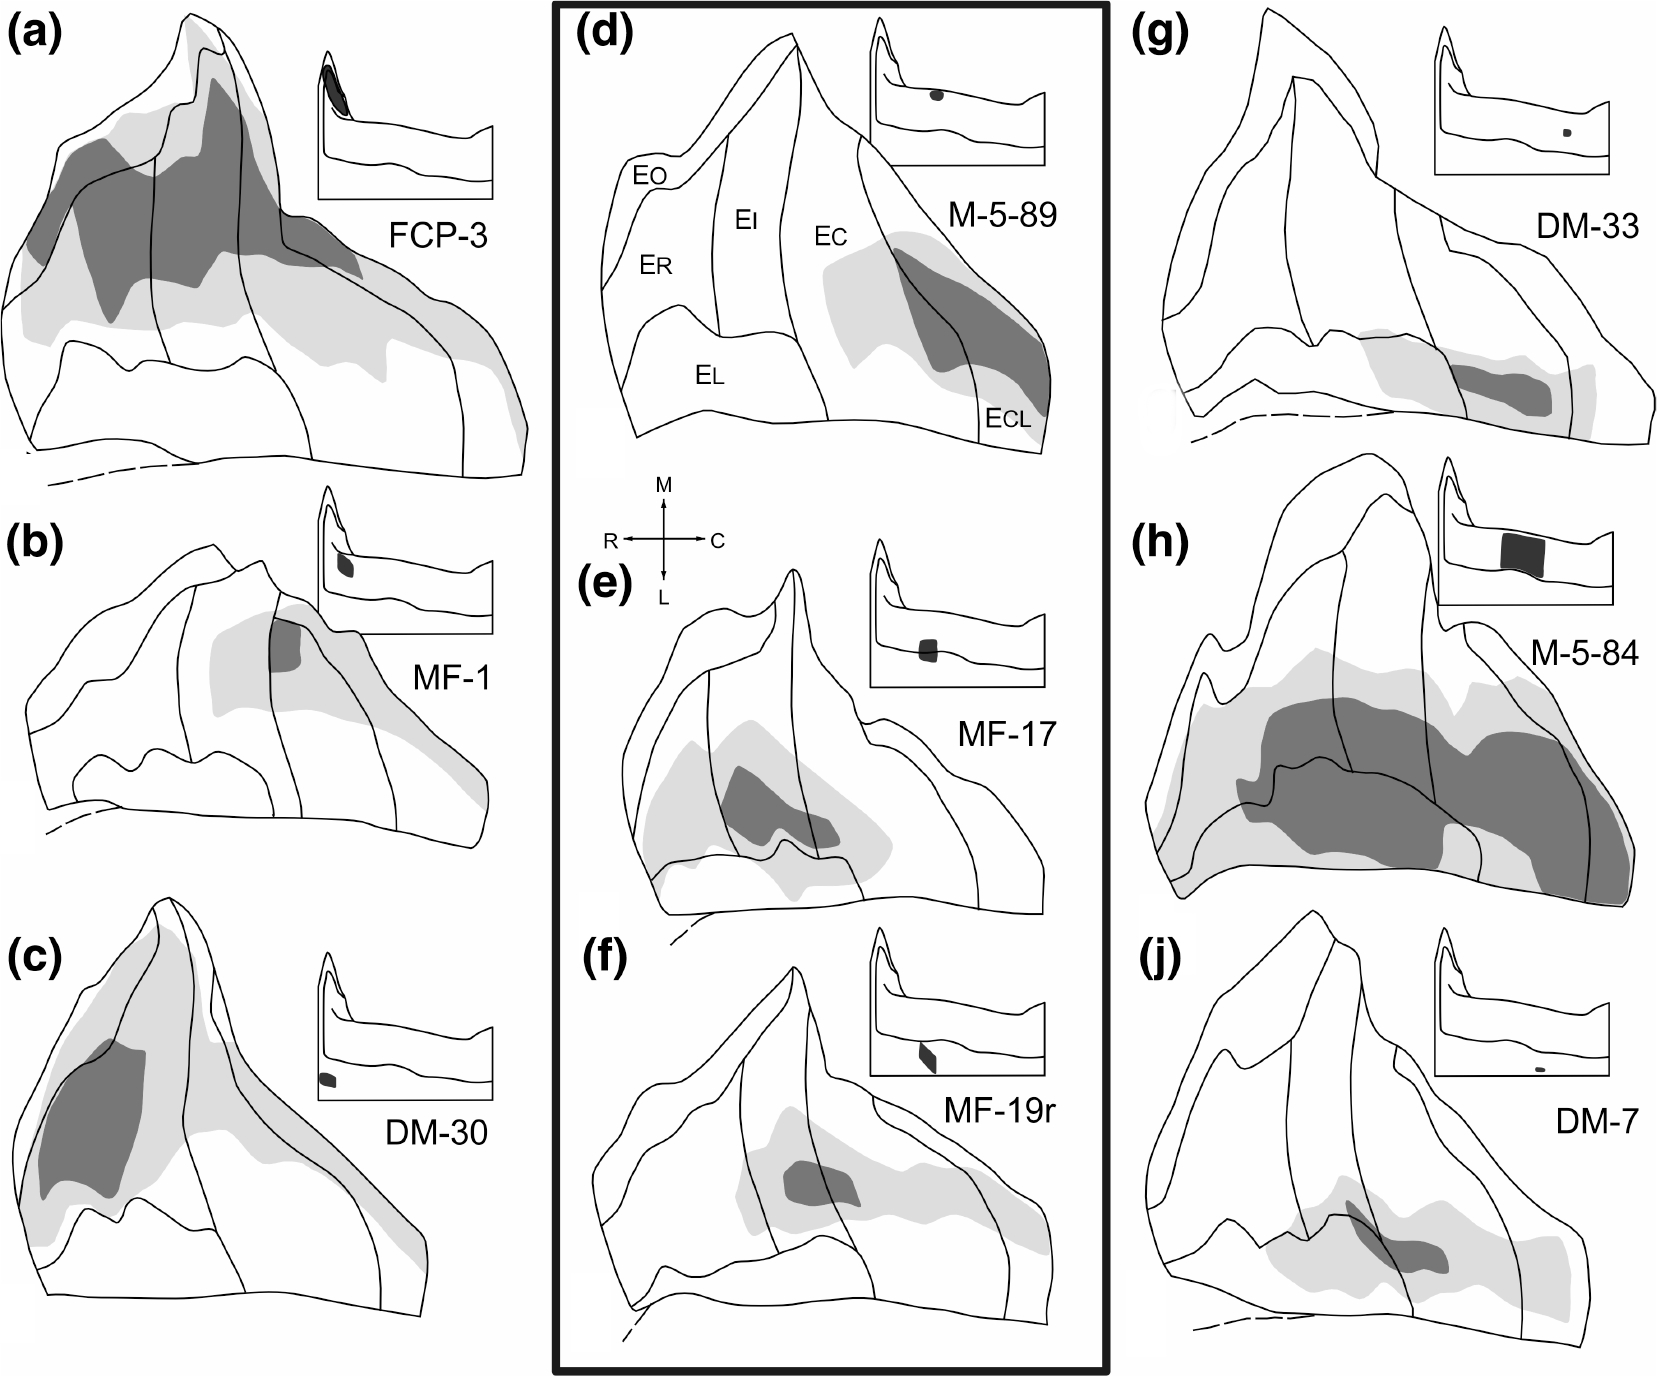
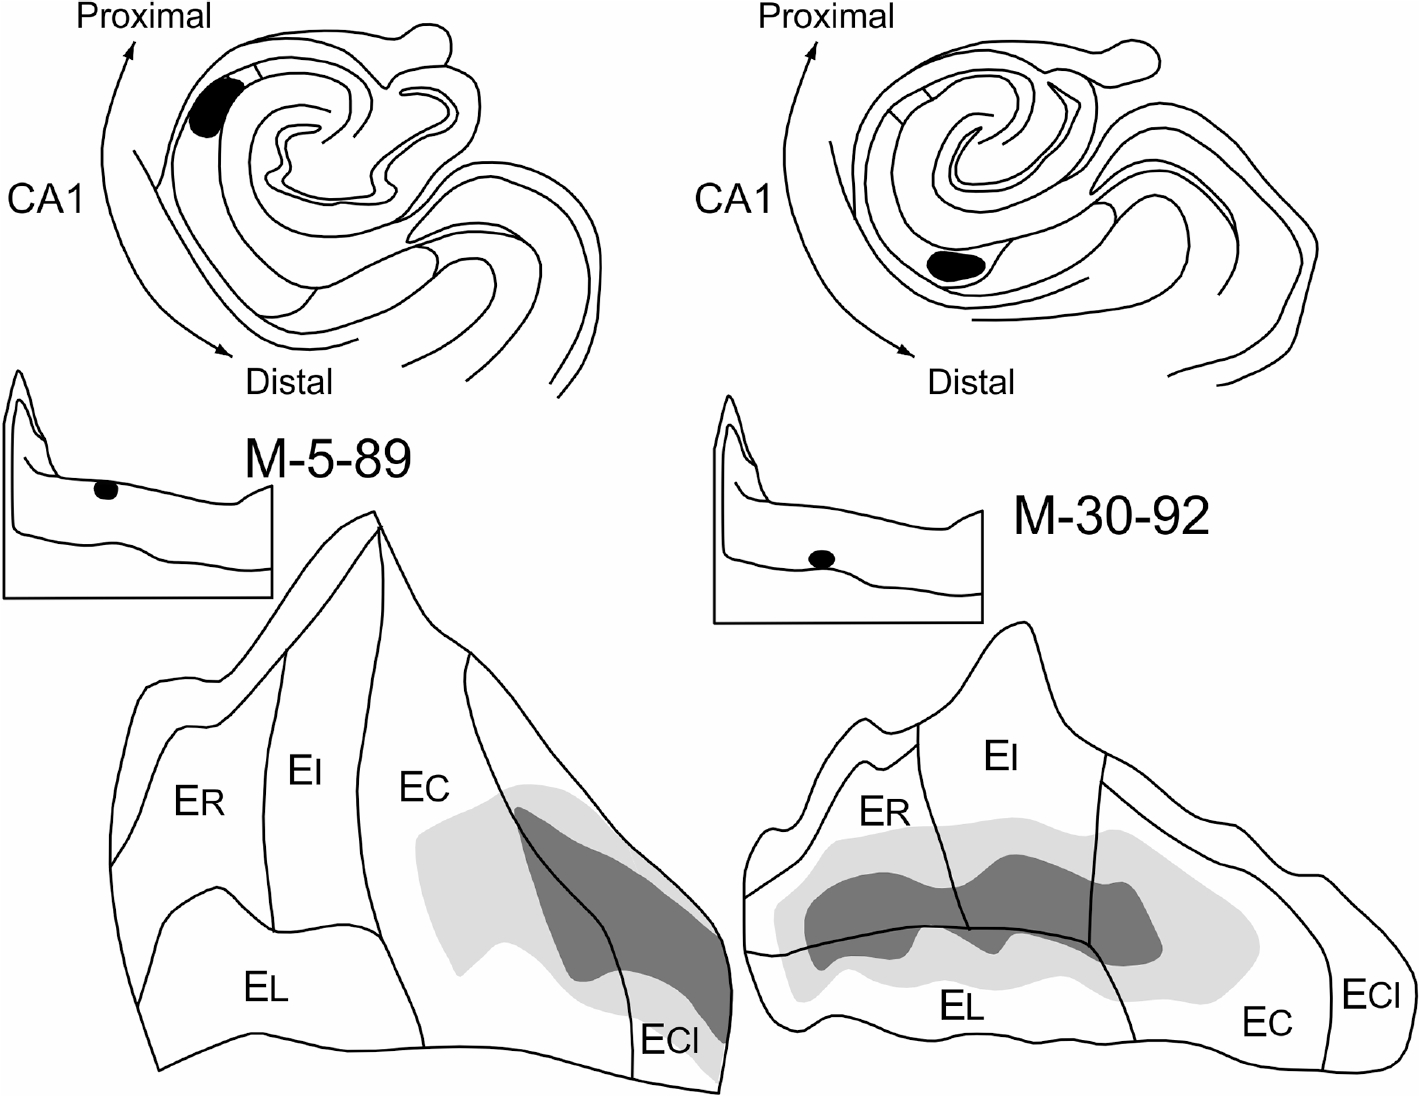
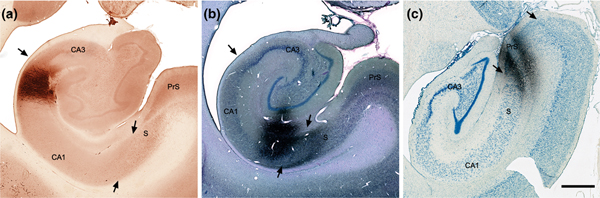
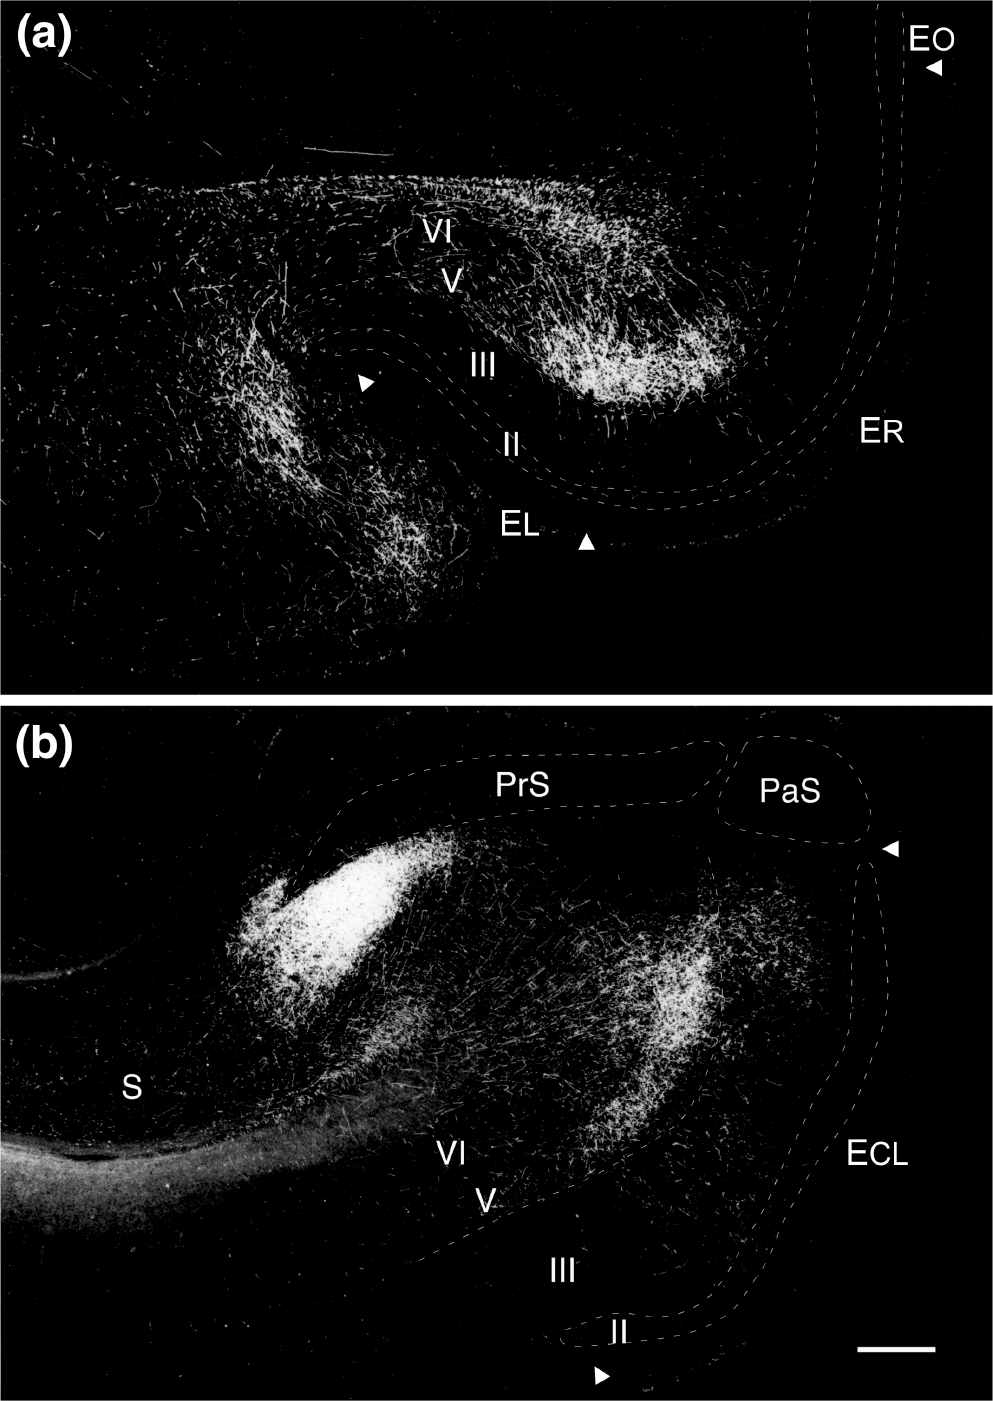
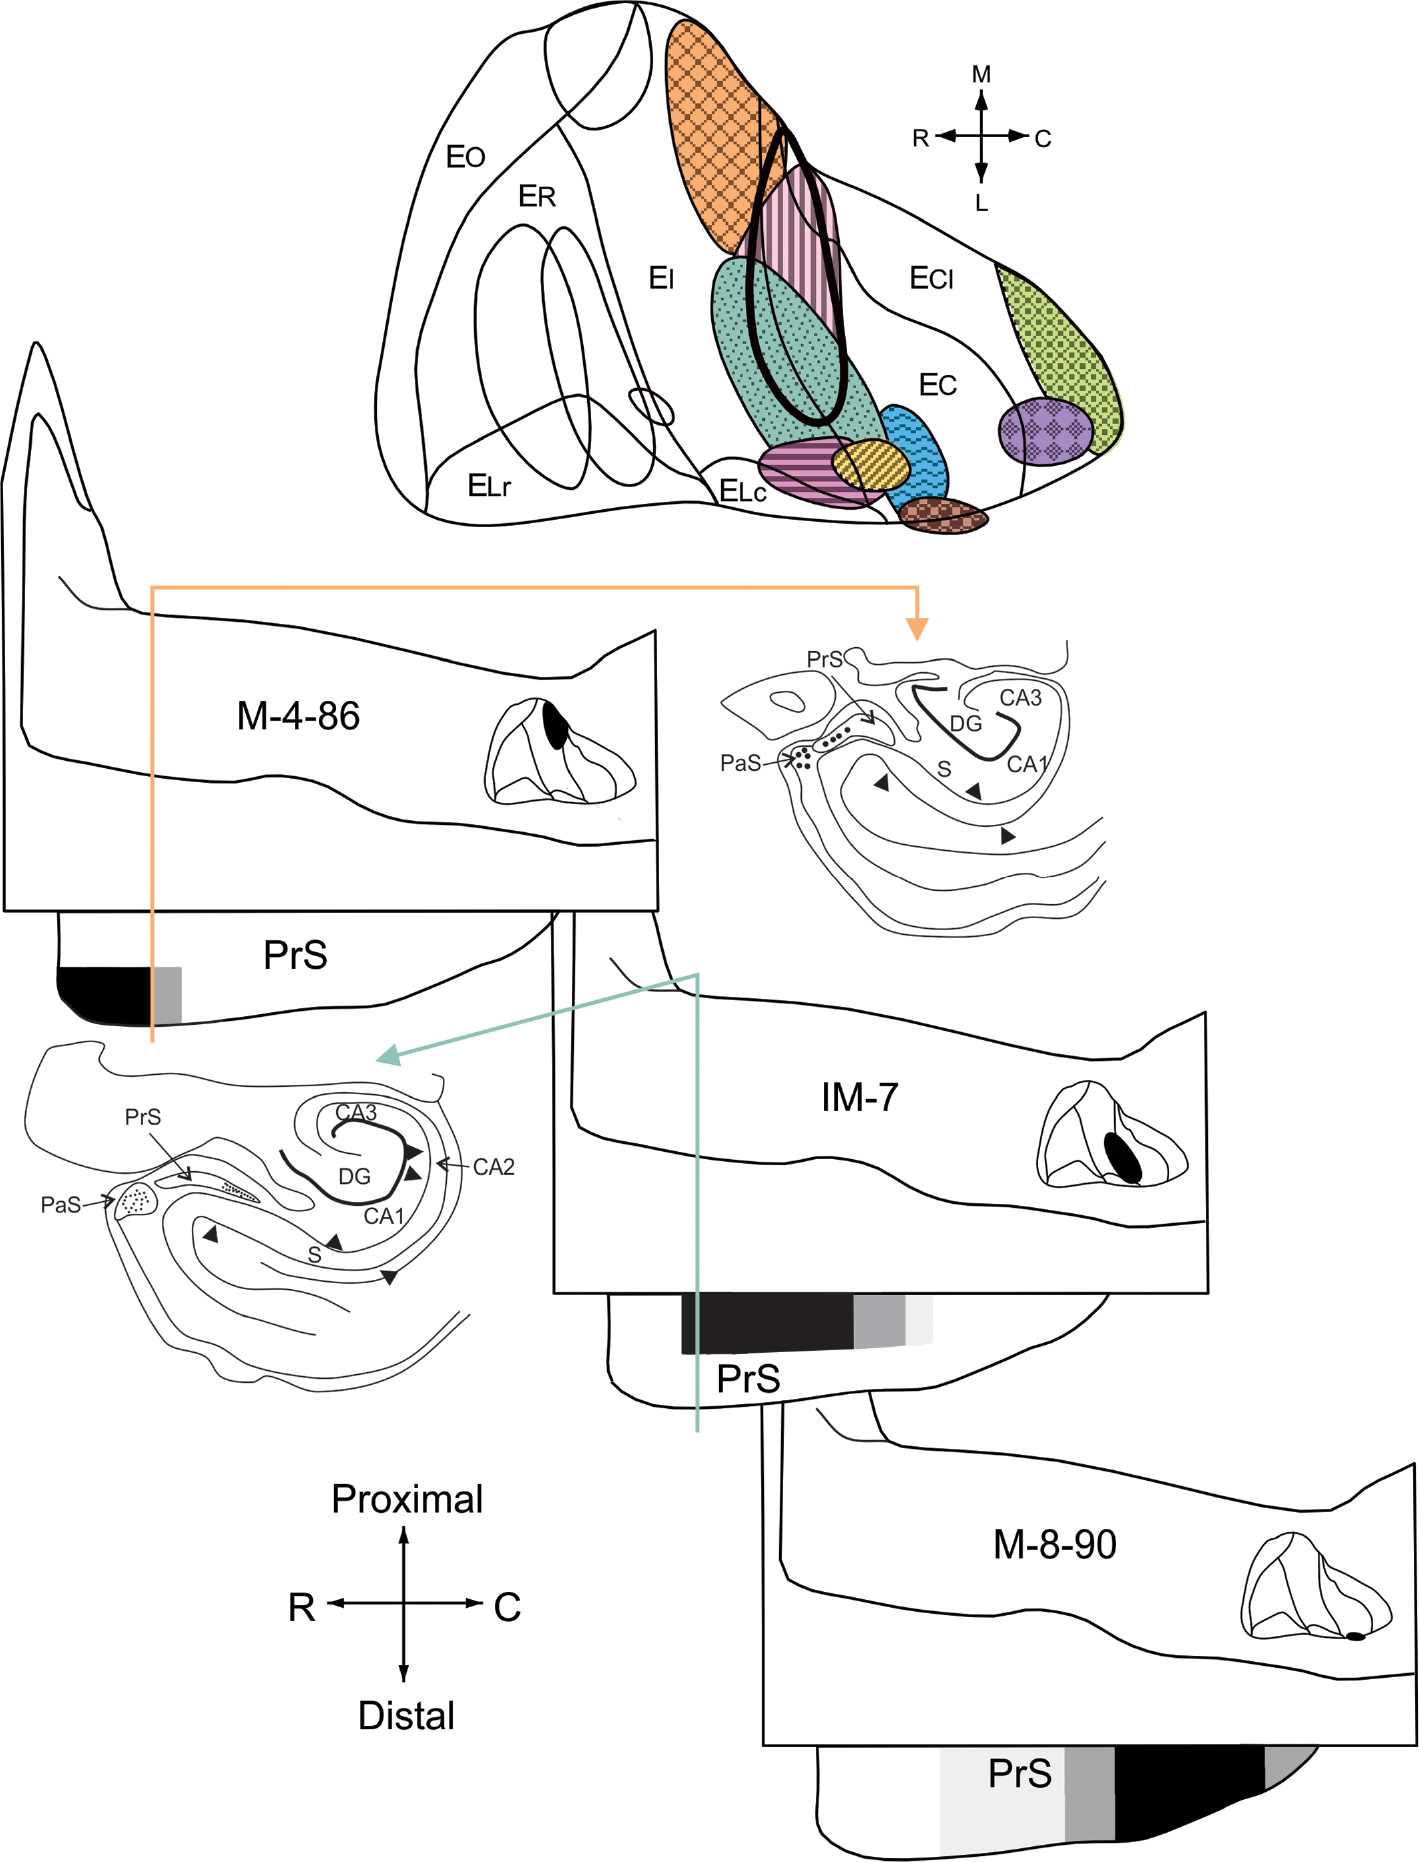
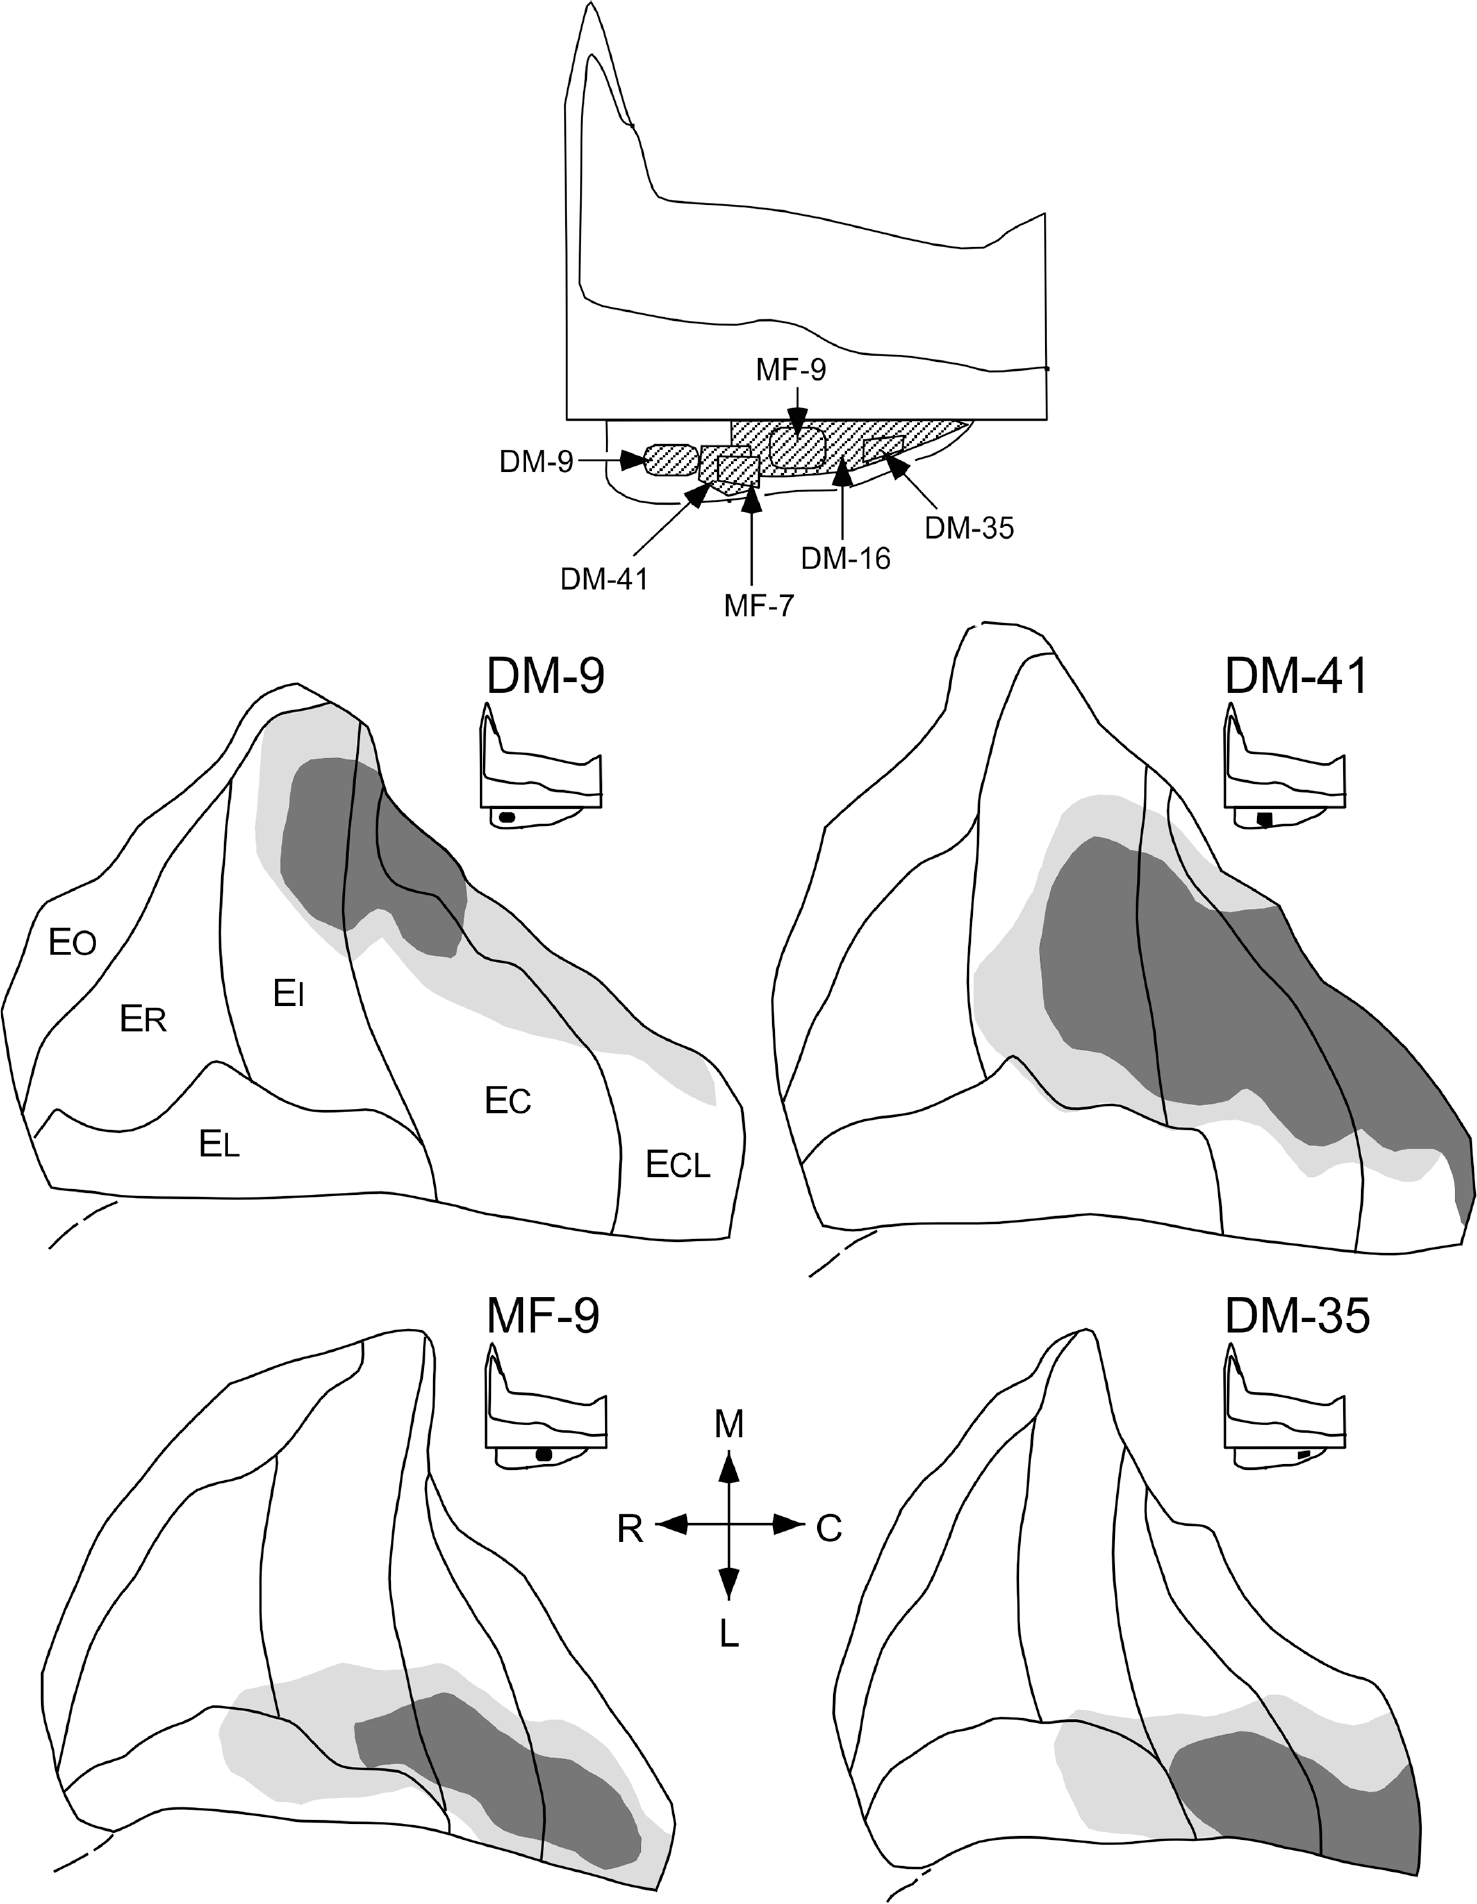
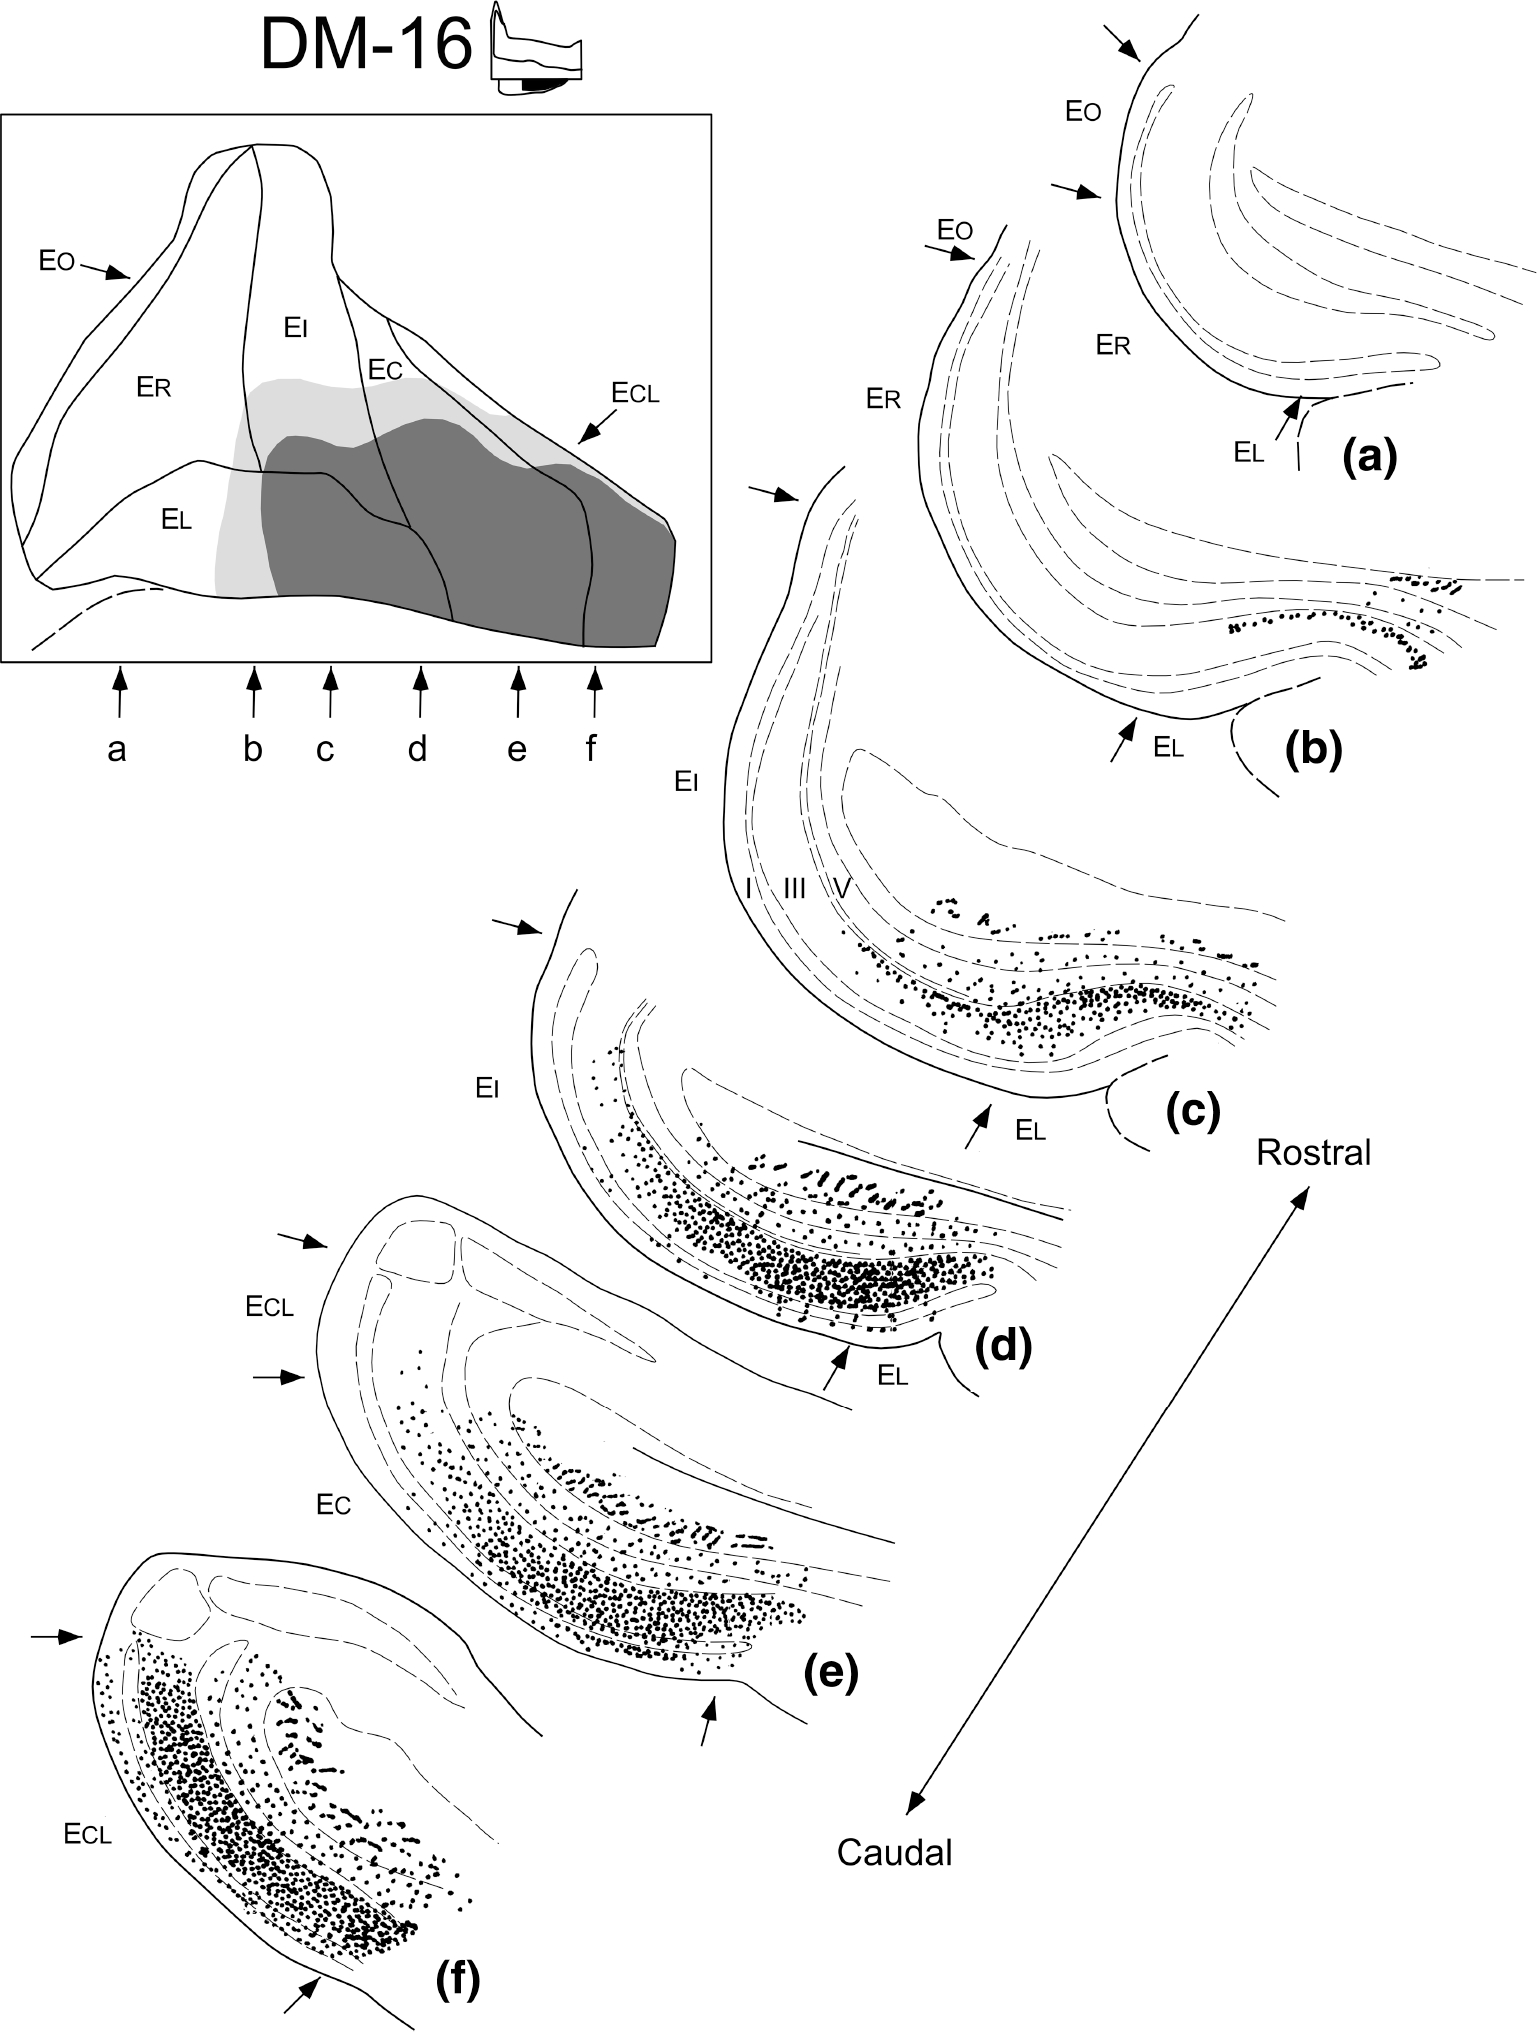
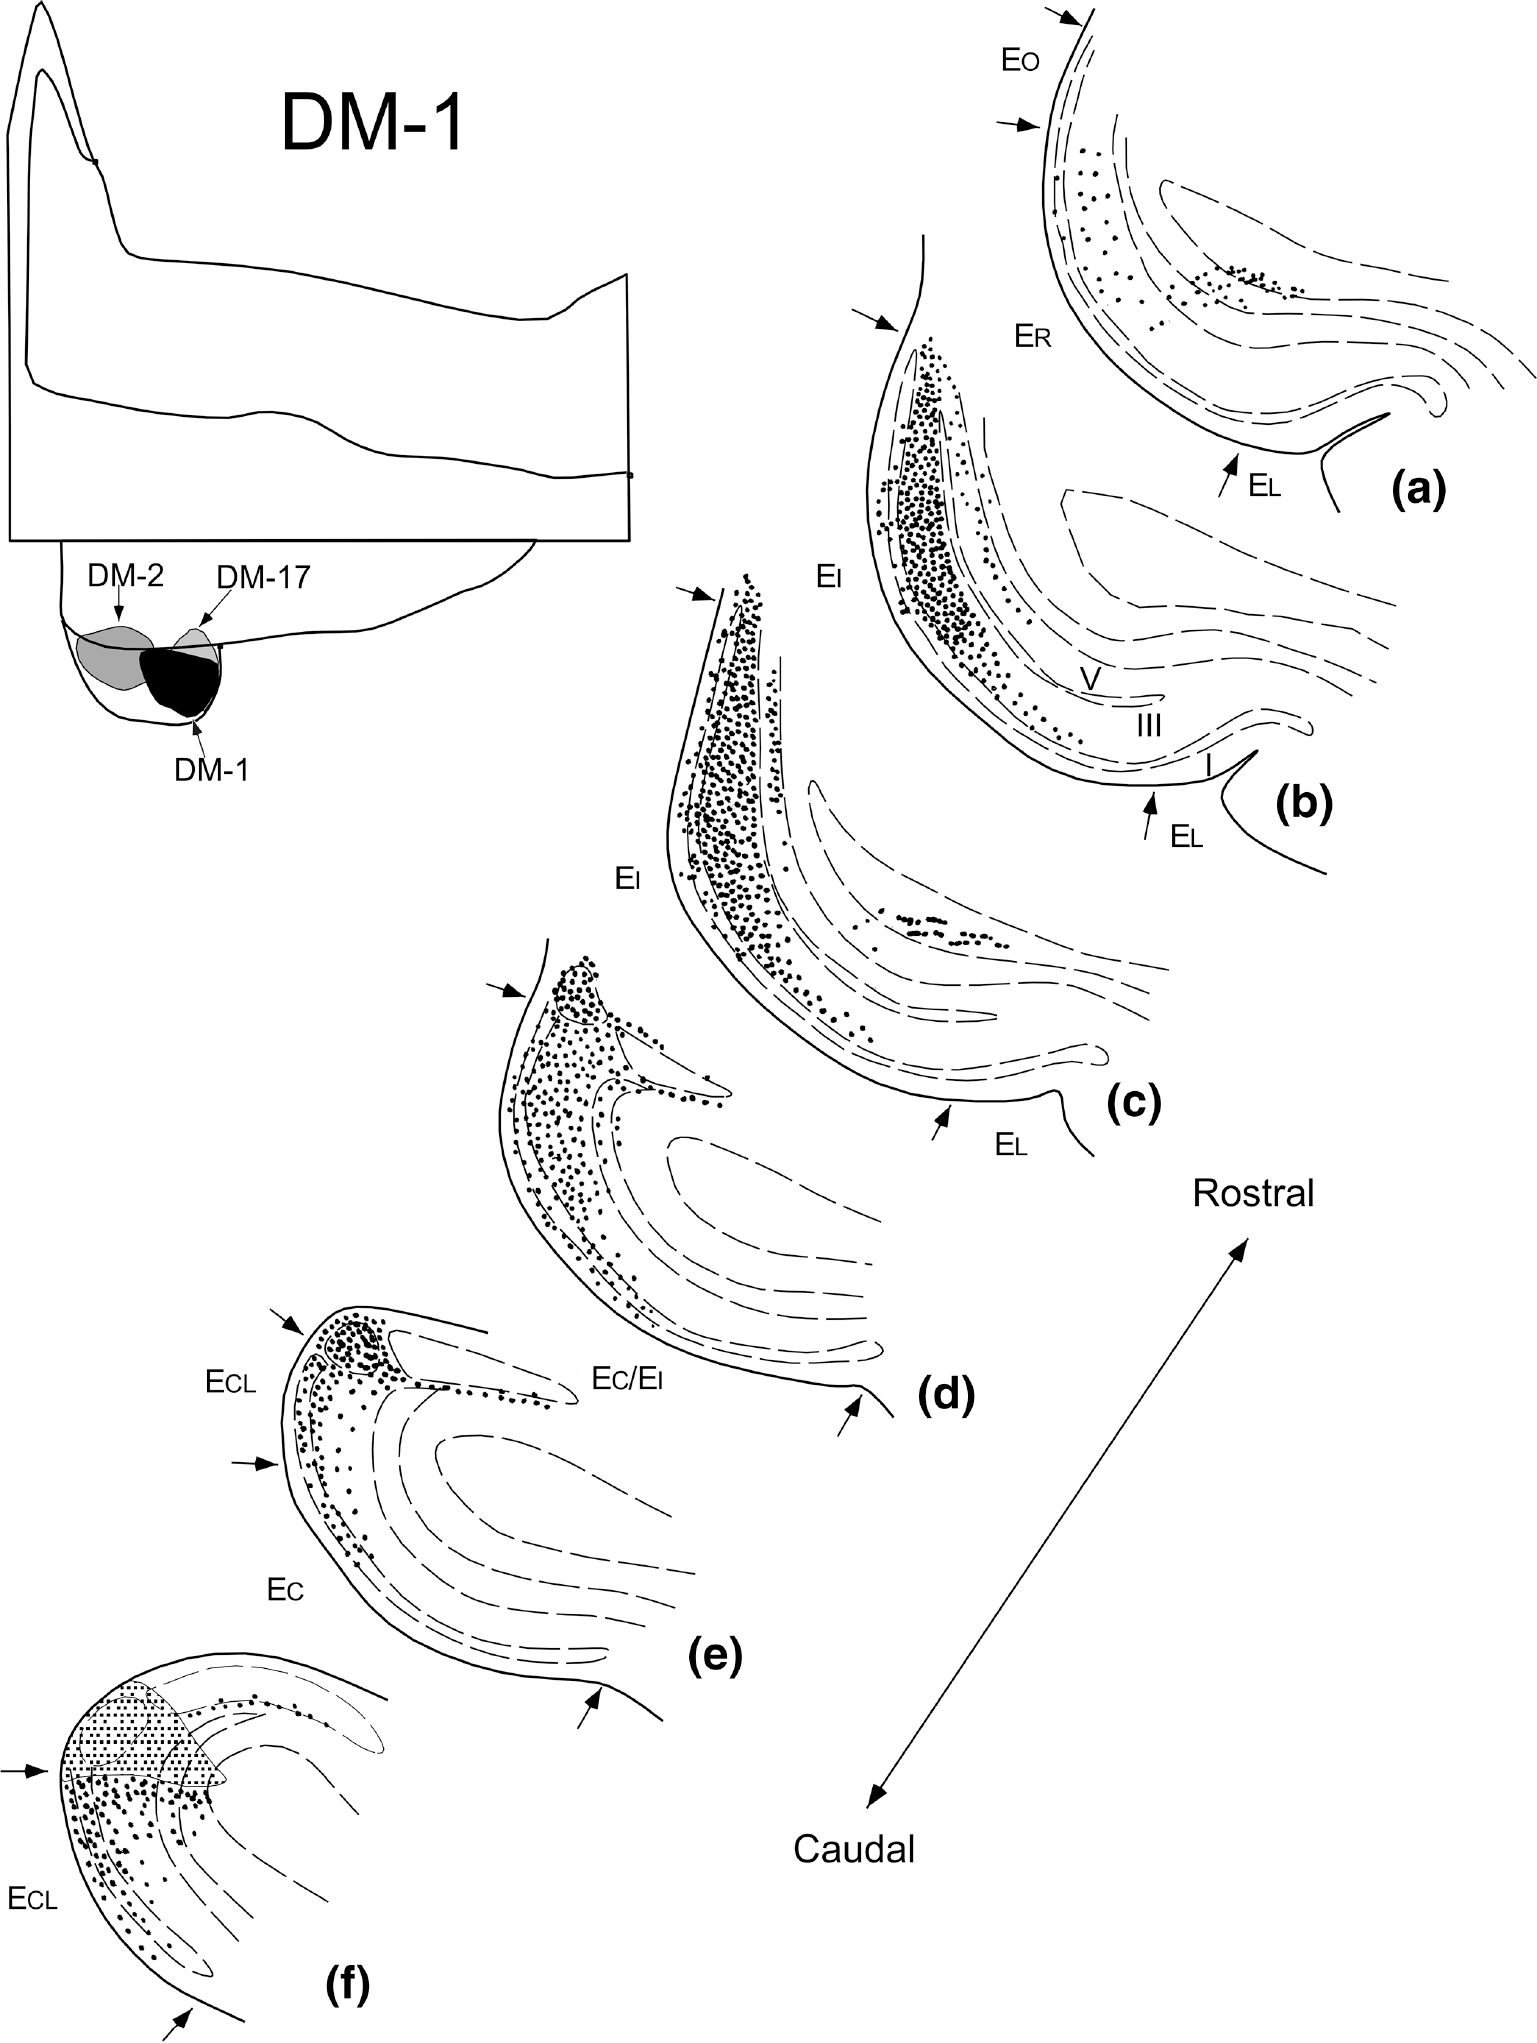
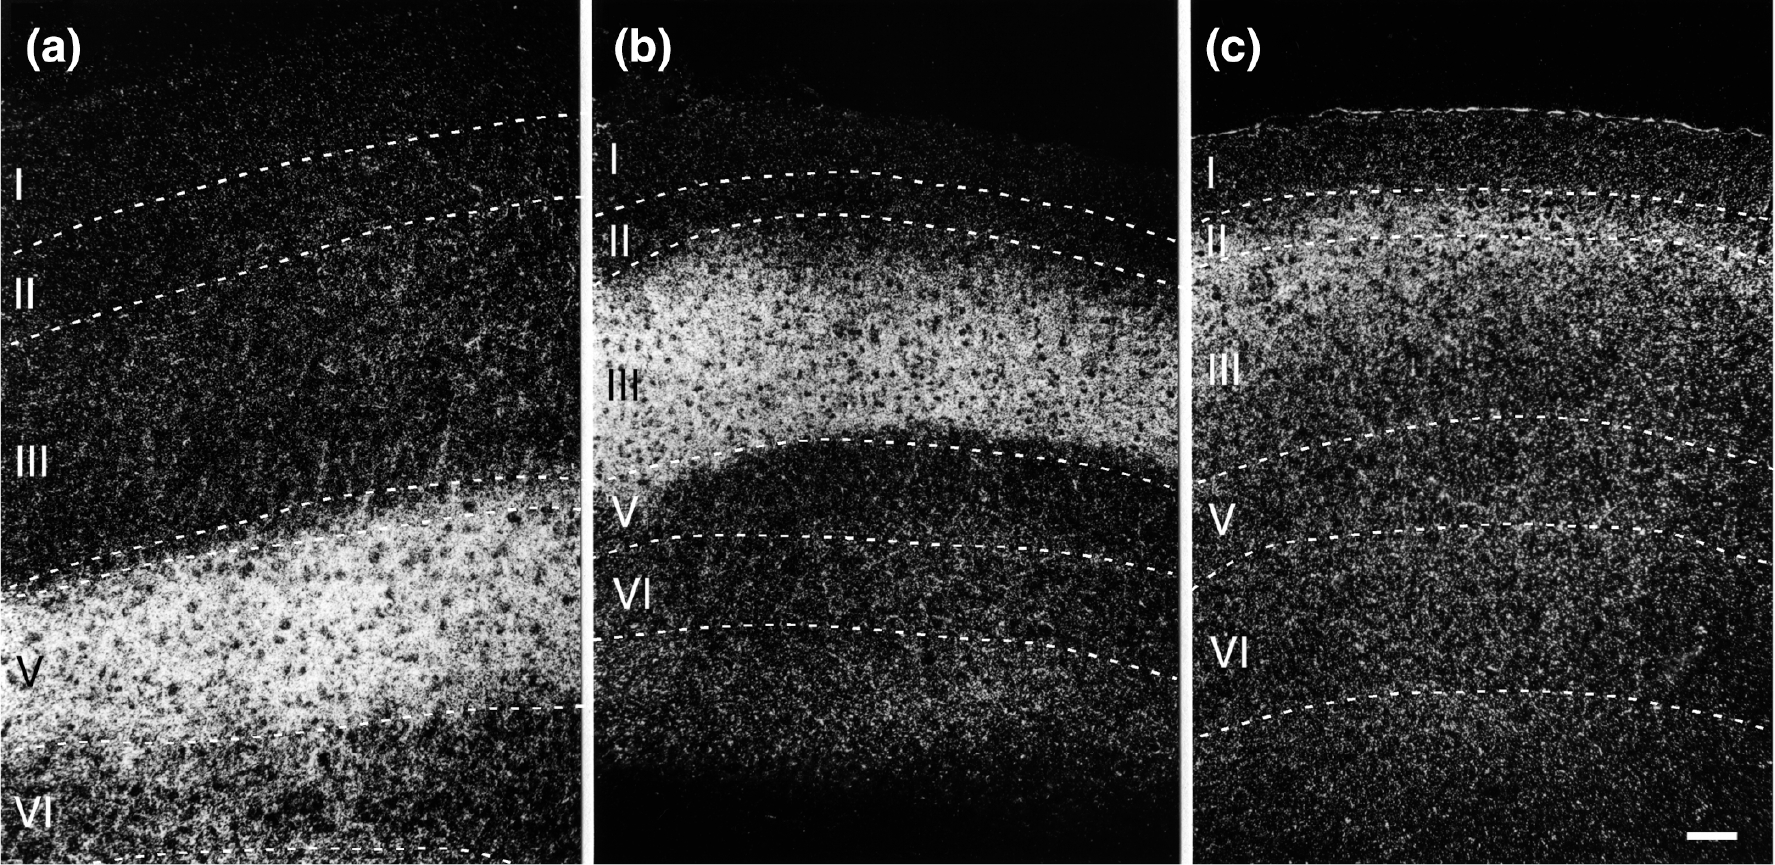
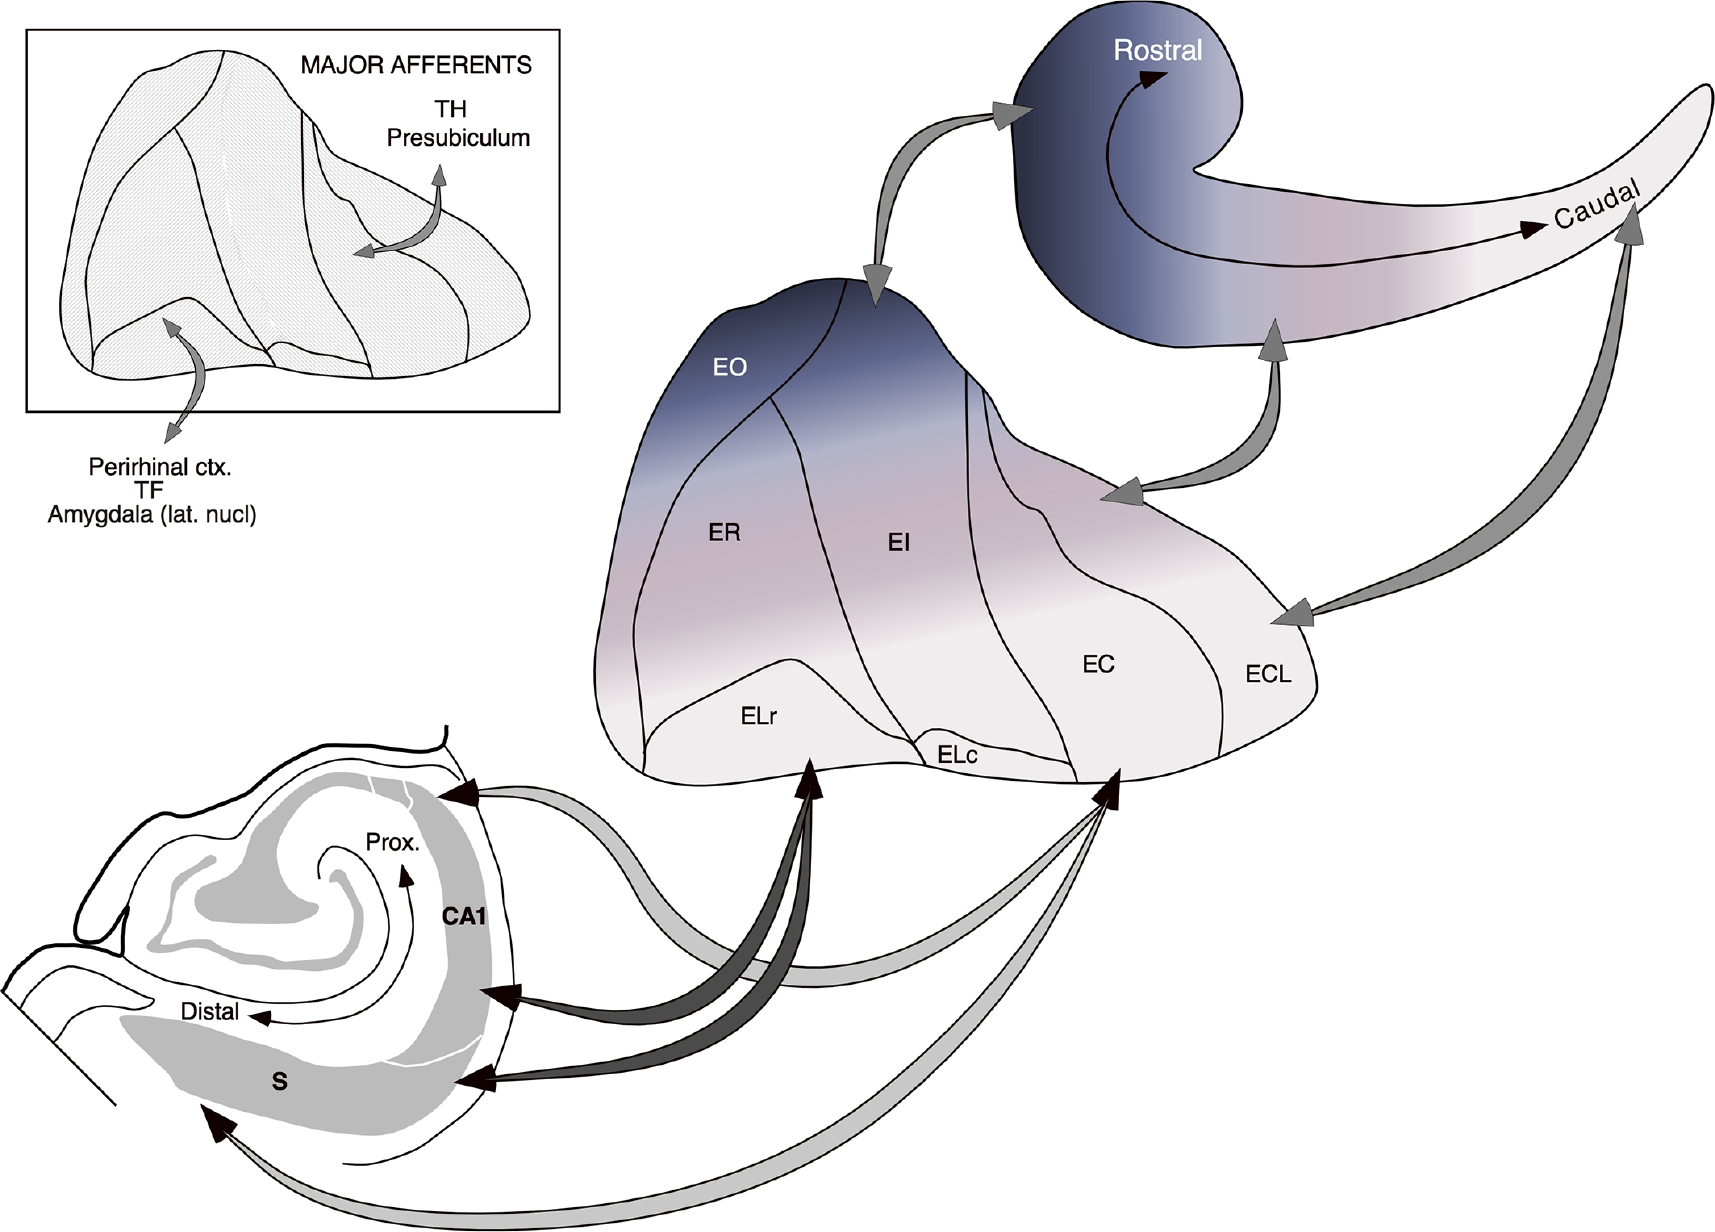
The organization of projections from the macaque monkey hippocampus, subiculum, presubiculum, and parasubiculum to the entorhinal cortex was analyzed using anterograde and retrograde tracing techniques. Projections exclusively originate in the CA1 field of the hippocampus and in the subiculum, presubiculum, and parasubiculum. The CA1 and subicular projections terminate most densely in Layers V and VI of the entorhinal cortex, with sparser innervation of the deep portion of Layers III and II. Entorhinal projections from CA1 and the subiculum are topographically organized such that a rostrocaudal axis of origin is related to a medial-to-lateral axis of termination. A proximodistal axis of origin in CA1 and distoproximal axis in subiculum are related to a rostrocaudal axis of termination in the entorhinal cortex. The presubiculum sends a dense, bilateral projection to caudal parts of the entorhinal cortex. This projection terminates most densely in Layer III with sparser termination in Layers I, II, and V. The same parts of entorhinal cortex receive a dense projection from the parasubiculum. This projection terminates in Layers III and II. Both presubicular and parasubicular projections demonstrate the same longitudinal topographic organization as the projections from CA1 and the subiculum. These studies demonstrate that: (a) hippocampal and subicular inputs to the entorhinal cortex in the monkey are organized similar to those described in nonprimate species; (b) the topographic organization of the projections from the hippocampus and subicular areas matches that of the reciprocal projections from the entorhinal cortex to the hippocampus and the subicular areas.

Keywords: hippocampal formation; memory; nonhuman primate; subiculum, presubiculum, parasubiculum.


Conflict of interest statement

CONFLICT OF INTEREST

The authors do not report a conflict of interest.

Figures

FIGURE 1
FIGURE 1
An “unfolded” two-dimensional map of CA1, subiculum, presubiculum and parasubiculum (PaS). The border between the subiculum and the presubiculum was used to align the sections and the linear extent of each field was represented as a straight line perpendicular to this line. Four representative sections, from rostral (A 14.6) to caudal (A 3.6) are presented for orientation (Nissl-stained sections from approximately these levels are illustrated in Figure 2). In order to unfold the most rostral or uncal portion of CA1 and the subiculum, the length of the uncal portion of each field has been merged with that of the corresponding part in the body of the hippocampus from the same section. This eliminates the intervening portion of CA3 and CA2 from the illustration. The map is constructed from 34 representative sections that are distributed throughout the rostrocaudal extent of the hippocampal formation. More sections were used at extreme rostral and caudal levels where the hippocampal fields change more rapidly
FIGURE 2
FIGURE 2
Photomicrographs of four coronal Nissl-stained sections located at different rostrocaudal levels of the hippocampal formation. Sections are arranged from rostral (a) to caudal (d). The various boundaries between divisions of the hippocampal formation are indicated. The photomicrographs in Panels a–d approximately correspond to the levels of the four sections indicated in Figure 1 (A14.6, 13.4, 7.6, and 3.6 respectively). Scale bar equals 1 mm
FIGURE 3
FIGURE 3
Unfolded two-dimensional map of the entorhinal cortex illustrating the locations and extents of retrograde tracer injections (see Table 1 for a summary of the tracers that were used) [Color figure can be viewed at wileyonlinelibrary.com]
FIGURE 4
FIGURE 4
The distribution of retrogradely labeled neurons in two cases with injections in medial parts of EC. a–d, four coronal sections, taken from different levels along the rostrocaudal axis from an injection in rostromedial parts of EI (IM-4). e–h, four coronal sections, taken from different levels along the rostrocaudal axis from an injection caudomedially in EI (M-4–86). Note the presence of labeled neurons in CA1 and subiculum, only in rostral levels (a,b and e,f respectively; see also Figure 6 for the full representation along the rostrocaudal axis). Labeled neurons in case IM-4 are mainly present distally in CA1and in the adjacent proximal subiculum (a–c), whereas in case of the more caudal injection (M-4–86), labeled neurons are mainly present in proximal CA1 and distal subiculum (e,f). Note the presence of labeling in the pre- and parasubiculum only in case M-4–86 (e,f) [Color figure can be viewed at wileyonlinelibrary.com]
FIGURE 5
FIGURE 5
The distribution of retrogradely labeled neurons in two cases with injections in lateral parts of EC. a–d, four coronal sections, taken from different levels along the rostrocaudal axis from an injection rostrolaterally involving the border region between ER and EI (M11–90 DY). e–h, four coronal sections, taken from different levels along the rostrocaudal axis from an injection caudolaterally in EC, with some perirhinal involvement (M-8–90). Note the presence of labeled neurons in CA1 and subiculum along the longitudinal extents but also compare with the full lengths presented in the unfolded maps in Figure 6. The latter figure shows that the most lateral of the two injections (M-8–90) does result in retrogradely labeled neurons at even more caudal levels than shown in Panel h. Labeled neurons in case M-11–90 DY are mainly present distally in CA1and in the adjacent proximal subiculum (c,d), whereas in the case of the more caudal injection (M-8–90), labeled neurons are also present in proximal CA1 and distal subiculum (e,f). Note the presence of labeling in pre- and parasubiculum only in case M-8–90 (g,h) [Color figure can be viewed at wileyonlinelibrary.com]
FIGURE 6
FIGURE 6
The results from 4 representative experiments with retrograde tracer injections located in different areas of the entorhinal cortex (top) were selected to demonstrate the topography of CA1/subicular projections to the entorhinal cortex. Schematic representations of the distribution and density of retrogradely labeled cells are illustrated on the unfolded maps of CA1 and the subiculum at the bottom of the illustration. The highest densities of retrogradely labeled cells are represented by black shading, intermediate densities by dark grey shading and low densities by light grey shading. White indicates regions in which no labeled cells were found. Cell counts were summed across sections that represented 5% of the total rostrocaudal extent of the hippocampus and across one half of the transverse extent of CA1 and the subiculum in each section (see text for further details)
FIGURE 7
FIGURE 7
Unfolded two-dimensional map of CA1 and the subiculum that illustrates the locations and extents of representative anterograde tracer injections along the rostrocaudal and transverse (proximodistal) axes. All injections were of 3H-amino acids except for M-21–91, M-5–89, and M-30–92 which were PHA-L injections (see Table 1 for further details) [Color figure can be viewed at wileyonlinelibrary.com]
FIGURE 8
FIGURE 8
Unfolded two dimensional maps of the entorhinal cortex which illustrate the distribution and relative densities of anterograde labeling following nine representative injections of CA1 or the subiculum. The injection sites are shown in Figure 7. On each map, the density of anterogradely labeled fibers and terminals has been qualitatively represented as either high (dark shading) or moderate to low (light shading). White indicates regions where few if any anterogradely transported tracer was observed. The position of each of the nine maps in the illustration corresponds to the relative positions of the injection sites. The maps at left represent injections into the rostral CA1/subiculum and those at right represent injections at caudal levels of the CA1/subiculum. The middle row of maps represents injections located at about mid rostrocaudal levels. For rostrocaudal comparisons, a–c should be compared with d–f and with g–j. Note that a rostral-to-caudal shift of the injection site results in a medial-to-lateral shift of the terminal field. The unfolded maps in the central, boxed area provide a clear comparison of the distribution of labeling following injections that differ in their transverse locations (d-f respectively; see also Figure 9). Injections of either the proximal CA1 (d) or the distal subiculum (f) lead to labeling in the caudal portion of the entorhinal cortex whereas an injection located on the CA1/subiculum border (e) leads to labeling more rostrally in the entorhinal cortex
FIGURE 9
FIGURE 9
Comparison of the distribution of labeled fibers and terminals in the entorhinal cortex resulting from PHA-L injections located either proximally or distally in the CA1 field of the hippocampus. The line drawings of coronal sections at the top illustrate the size and location of the PHA-L injections. The distributions and relative densities of anterogradely transported label from each of these injections is represented on the unfolded two-dimensional maps of the entorhinal cortex located at the bottom of the illustration. A shift of the injection site from proximal CA1 (M-5–89; left side) to distal CA1 (M-30–92; right side) results in a corresponding shift of the terminal field in the entorhinal cortex from caudal to rostral. Since these injections are at the same rostrocaudal level of CA1, there is no change in the position of the terminal field along the lateral to medial axis of the entorhinal cortex
FIGURE 10
FIGURE 10
Coronal sections of the hippocampal formation showing three representative anterograde injection sites. (a) PHA-L injection in proximal CA1 (case M-5–89; see also Figure 9). (b) PHA-L injection (Gallyas counterstained) in distal CA1 (M-30–92; see also Figure 9). (c) Tritiated amino acid injection (Nissl counterstained) in the presubiculum (case MF9; see also Figure 12). Scale bar equals 1 mm [Color figure can be viewed at wileyonlinelibrary.com]
FIGURE 11
FIGURE 11
Darkfield photomicrographs of PHA-L labeling in the entorhinal cortex resulting from the injections in CA1 illustrated in Figure 9. (a) Labeling in the rostral entorhinal cortex following an injection in the distal portion of CA1 (case M-30–92); (b) Labeling in the caudal entorhinal cortex following a PHA-L injection located in the proximal portion of CA1 (case M-5–89). Scale bar equals 2 mm
FIGURE 12
FIGURE 12
Illustration of the topographic organization of presubicular projections to the entorhinal cortex. The locations and extents of entorhinal retrograde tracer injections that resulted in labeled cells in the presubiculum are indicated with different shading/color patterns on an unfolded two dimensional entorhinal map (top). Injections (located in rostral levels of the entorhinal cortex) that did not produce retrograde labeling in the presubiculum are indicated by outlines only (compare with Figure 3). Schematic representations (bottom) of the distributions and densities of retrogradely labeled cells in the presubiculum following three representative injections in the entorhinal cortex. The three entorhinal injections are located at approximately the same rostrocaudal level but differ with respect to their lateromedial position (see upper panel for locations of injections indicated by the shading/color patterns). The highest densities of retrogradely labeled cells were represented by black shading, intermediate densities by dark grey shading and low densities by light grey shading. White indicates regions in which no labeled cells were found. Cell counts were summed across sections that represented 10% of the total rostrocaudal extent of the presubiculum. Insets are two representative coronal sections taken at approximately the same rostrocaudal level (indicated by the color-coded arrows) showing the differential distribution of retrogradely labeled neurons in distal versus proximal presubiculum associated with a medial versus lateral position of the injection site (case M-4–86 vs. case IM-7) [Color figure can be viewed at wileyonlinelibrary.com]
FIGURE 13
FIGURE 13
Unfolded two-dimensional maps of the entorhinal cortex that demonstrate the distribution and relative densities of anterograde labeling following 3H-amino acid injections at four different positions along the rostrocaudal axis of the presubiculum. The density of anterograde labeling in the entorhinal cortex is represented qualitatively as either high (dark shading) or low to moderate (light shading). White represents areas with little or no anterogradely transported label. The locations of presubicular injection sites are represented on an unfolded map (bottom)
FIGURE 14
FIGURE 14
Illustration of the extent and laminar organization of presubicular projections to the entorhinal cortex. This illustration represents data from experiment DM-16 in which three injections of 3H-amino acids involved the caudal two-thirds of the presubiculum (inset and also see Figure 13 for location of injection site). The unfolded map at top left shows the overall distribution of labeled fibers and terminals within the entorhinal cortex. The terminal labeling is confined to caudal portions of the entorhinal cortex. The line drawings at the right show representative coronal sections arranged from rostral (a) to caudal (f) through the entorhinal cortex (the approximate locations of these sections are indicated with the corresponding letters on the unfolded map). The density of labeled fibers and terminals is represented on the coronal sections as dots and small line segments. Dashed lines represent layers of the entorhinal cortex (c)
FIGURE 15
FIGURE 15
Illustration of the extent and laminar organization of parasubicular projections to the entorhinal cortex. This illustration represents data from experiment DM-1 in which an injection of 3H-amino acids involved the caudal half of the parasubiculum. The unfolded map at the top left shows the location of parasubicular injections analyzed for this study. The line drawings at the right show representative coronal sections arranged from rostral (a) to caudal (f) through the entorhinal cortex. The density of labeled fibers and terminals is represented on the coronal sections as dots and small line segments. Dashed lines represent layers of the entorhinal cortex (b). The injection site is illustrated as a shaded area in Panel f
FIGURE 16
FIGURE 16
Darkfield photomicrographs illustrating the laminar organization of anterograde labeling in the ipsilateral entorhinal cortex following 3H-amino acid injections in the subiculum (a; case M-5–84), the presubiculum (b; case DM-16), and the parasubiculum (c; case DM-17). The pattern of dense labeling in Layer V resulting from subicular injections (a) is similar to that produced following CA1 injections (see Figure 11). The labeling resulting from injections in the presubiculum (b) is most dense in Layer III. Injections in the parasubiculum produce dense labeling in Layers II and III of the entorhinal cortex (c). Scale bar equals 100 μm
FIGURE 17
FIGURE 17
Summary diagram illustrating the major topographic features of entorhinal-hippocampal interconnectivity. The mediolateral organization of entorhinal-hippocampal interconnections is portrayed by the arrows running from the unfolded map of the entorhinal cortex located in the middle of the illustration toward the schematic hippocampus at top right. A rostrocaudally oriented band of entorhinal cortex located medially (blue shading) projects to rostral levels of the hippocampus and progressively more laterally situated bands of the entorhinal cortex (magenta to lighter shading) project to more caudal levels of the hippocampus. The relationship between the transverse (proximodistal) location of cells in CA1 and the subiculum and rostrocaudal levels of the entorhinal cortex is illustrated by the arrows extending toward the coronal section of the hippocampus/subiculum at lower left. Cells located at the border of the CA1 and subiculum receive inputs from and contribute inputs to the rostral portion of the entorhinal cortex. Cells located proximally in CA1 and distally in the subiculum receive inputs from and contribute inputs to caudal portions of the entorhinal cortex. The inset at top left indicates that inputs to the entorhinal cortex from the amygdala, the perirhinal cortex and area TF are preferentially directed to rostral levels, whereas inputs from the presubiculum and area TH are directed preferentially to caudal levels of the entorhinal cortex [Color figure can be viewed at wileyonlinelibrary.com]

Similar articles

Cited by

References

    1. Amaral DG, Dolorfo C, & Alvarez-Royo P (1991). Organization of CA1 projections to the subiculum: a PHA-L analysis in the rat. Hippocampus, 1(4), 415–435. 10.1002/hipo.450010410 - DOI - PubMed
    1. Amaral DG, Insausti R, & Cowan WM (1984). The commissural connections of the monkey hippocampal formation. Journal of Comparative Neurology, 224(3), 307–336. 10.1002/cne.902240302 - DOI - PubMed
    1. Amaral DG, Insausti R, & Cowan WM (1987). The entorhinal cortex of the monkey: I. Cytoarchitectonic organization. Journal of Comparative Neurology, 264(3), 326–355. 10.1002/cne.902640305 - DOI - PubMed
    1. Amaral DG, Kondo H, & Lavenex P (2014). An analysis of entorhinal cortex projections to the dentate gyrus, hippocampus, and subiculum of the neonatal macaque monkey. Journal of Comparative Neurology, 522(7), 1485–1505. 10.1002/cne.23469 - DOI - PMC - PubMed
    1. Amaral DG, & Price JL (1983). An air pressure system for the injection of tracer substances into the brain. Journal of Neuroscience Methods, 9 (1), 35–43. - PubMed

Publication types