. 2020 Jul 1;36(Suppl_1):i146-i153.
doi: 10.1093/bioinformatics/btaa446.

Distance indexing and seed clustering in sequence graphs

Affiliations

Distance indexing and seed clustering in sequence graphs

Xian Chang et al. Bioinformatics. .

Abstract

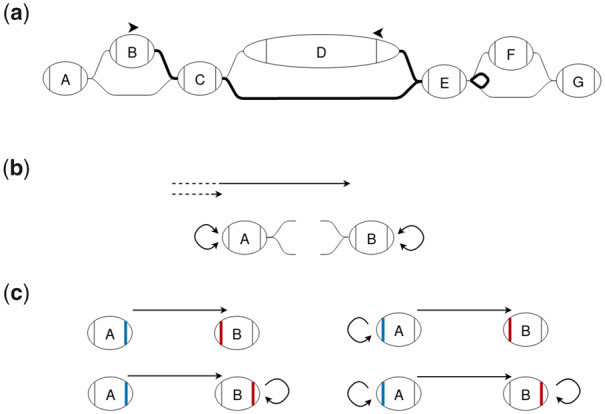
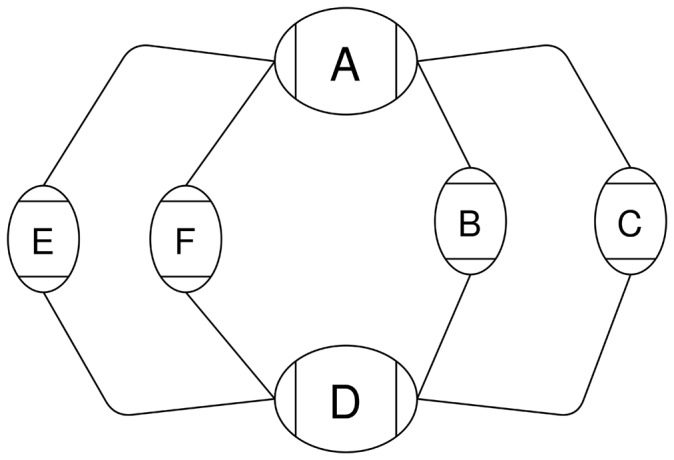
Motivation: Graph representations of genomes are capable of expressing more genetic variation and can therefore better represent a population than standard linear genomes. However, due to the greater complexity of genome graphs relative to linear genomes, some functions that are trivial on linear genomes become much more difficult in genome graphs. Calculating distance is one such function that is simple in a linear genome but complicated in a graph context. In read mapping algorithms such distance calculations are fundamental to determining if seed alignments could belong to the same mapping.

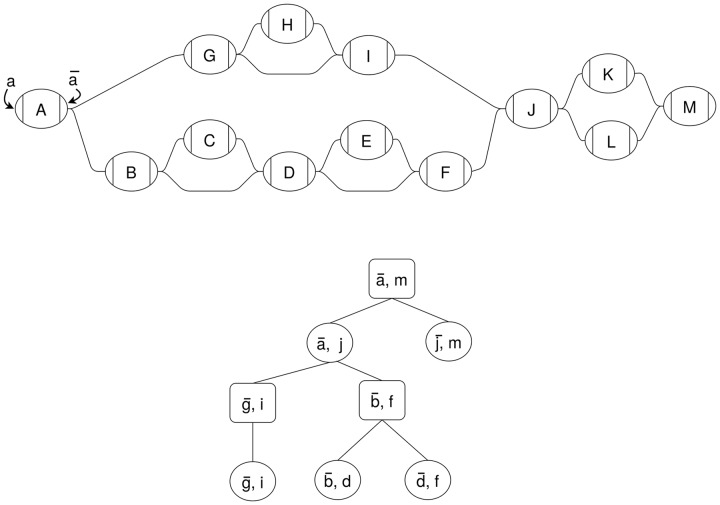
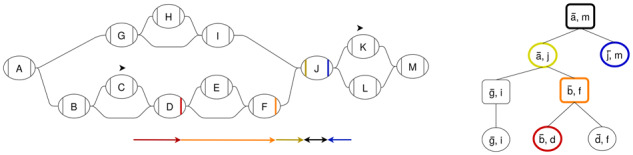
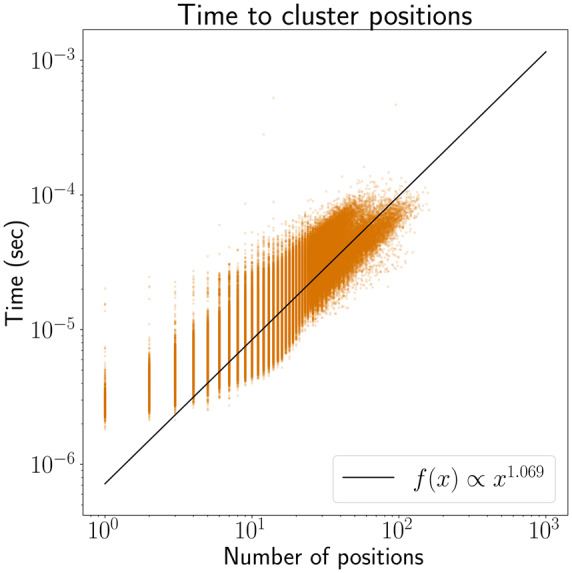
Results: We have developed an algorithm for quickly calculating the minimum distance between positions on a sequence graph using a minimum distance index. We have also developed an algorithm that uses the distance index to cluster seeds on a graph. We demonstrate that our implementations of these algorithms are efficient and practical to use for a new generation of mapping algorithms based upon genome graphs.

Availability and implementation: Our algorithms have been implemented as part of the vg toolkit and are available at https://github.com/vgteam/vg.


Figures

Fig. 1.
Fig. 1.
Example sequence graph (top) and its snarl tree (bottom). Chains in the sequence graph are represented as rectangular nodes in the snarl tree and snarls are represented as elliptical nodes
Fig. 2.
Fig. 2.
The minimum distance calculation from a position on C to a position on K can be broken up into the distances from each position to the ends of each of its ancestor structures in the snarl tree. Each colored arrow in the graph represents a distance query from a structure to a boundary node of its parent. The snarl tree node that each query occurs in is outlined with the same color. At the common ancestor of the positions, chain [a¯,m], the distance is calculated between two of the chain’s children, (a¯,j) and (j¯,m)
Fig. 3.
Fig. 3.
(a) The shortest path between two nodes in a chain can sometimes reverse direction in the chain. The edges on the shortest path between the positions on B and D are bolded. (b) A and B are boundary nodes of snarls in a chain. Distances stored in the chain index are shown in black. For each boundary node in the chain, the chain index stores the minimum distance from the start of the chain to the left side of that node as well as the loop distances for a forward and backward traversal. These loop distances are the minimum distance to leave a node, reverse direction in the chain and return to the same node side. (c) There are four possible minimum-distance paths between two nodes, connecting either node side of the two nodes. The lengths of these paths can be found using the distances stored in the chain index and the lengths of the nodes
Fig. 4.
Fig. 4.
A cyclic chain containing two snarls, (a¯,d¯) and (d, a)
Fig. 5.
Fig. 5.
The distToEndsOfParent calculation described in Table 1. (a) S and E are the boundary nodes of a structure that contains a child structure N. The minimum distances from some object in N to the ends of N shown as black arrows. (b) The minimum distances from each end of N to s¯ and e are found using the minimum distance index. (c) By adding the appropriate distances and taking the minimums, we can get the minimum distances to s and e¯
Fig. 6.
Fig. 6.
Clustering of positions (Xs) is done by traversing up the snarl tree and progressively agglomerating clusters. Positions are colored by the final clusters. (a) Each position starts out in a separate cluster on a node. Each cluster is annotated with its boundary distances: the minimum distances from any of its positions to the ends of the structure it is on. (b) For each snarl on the lowest level of the snarl tree, the clusters on the snarl’s children are agglomerated into new clusters on the snarl. The boundary distances are extended to the ends of the snarl. (c) For each chain on the next level of the snarl tree, the clusters on the chain’s snarls are agglomerated and the boundary distances are updated to reach the ends of the chain. This process is repeated on each level of the snarl tree up to the root
Fig. 7.
Fig. 7.
Run times for distance algorithms. Random pairs of positions were chosen from either within a read-length random walk (dark colors) or randomly from the graph (light colors)
Fig. 8.
Fig. 8.
Distance calculations on a graph with simulated structural variants. Read-length random walks were simulated near the junctions of structural variants. The distance between two random positions along each walk was calculated using the path-based method and our minimum distance algorithm and compared with the actual distance in the walk
Fig. 9.
Fig. 9.
Run time growth of our clustering algorithm. The regression line suggests that the run time of our algorithm is approximately linear in the number of positions in practice

References

    1. Akiba T. et al. (2013) Fast exact shortest-path distance queries on large networks by pruned landmark labeling. In Proceedings of the 2013 International Conference on Management of Data - SIGMOD’13, ACM Press, New York, NY, USA, p. 349.
    1. Dave V.S., Hasan M.A. (2015) TopCom: index for shortest distance query in directed graph In Q Chen. et al. (eds) Database and Expert Systems Applications, Lecture Notes in Computer Science, Springer International Publishing, Cham, pp. 471–480.
    1. Dijkstra E.W. (1959) A note on two problems in connexion with graphs. Numer. Math., 1, 269–271.
    1. Djidjev H.N. (1997) Efficient algorithms for shortest path queries in planar digraphs In: G. Gooset al. (eds) Graph-Theoretic Concepts in Computer Science. Vol. 1197, Springer, Berlin, Heidelberg, pp. 151–165.
    1. Garrison E. et al. (2018) Variation graph toolkit improves read mapping by representing genetic variation in the reference. Nat. Biotechnol., 36, 875–879. - PMC - PubMed

Publication types