. 2020 Jul 1;36(Suppl_1):i48-i56.
doi: 10.1093/bioinformatics/btaa443.

Unsupervised topological alignment for single-cell multi-omics integration

Affiliations

Unsupervised topological alignment for single-cell multi-omics integration

Kai Cao et al. Bioinformatics. .

Abstract

Motivation: Single-cell multi-omics data provide a comprehensive molecular view of cells. However, single-cell multi-omics datasets consist of unpaired cells measured with distinct unmatched features across modalities, making data integration challenging.

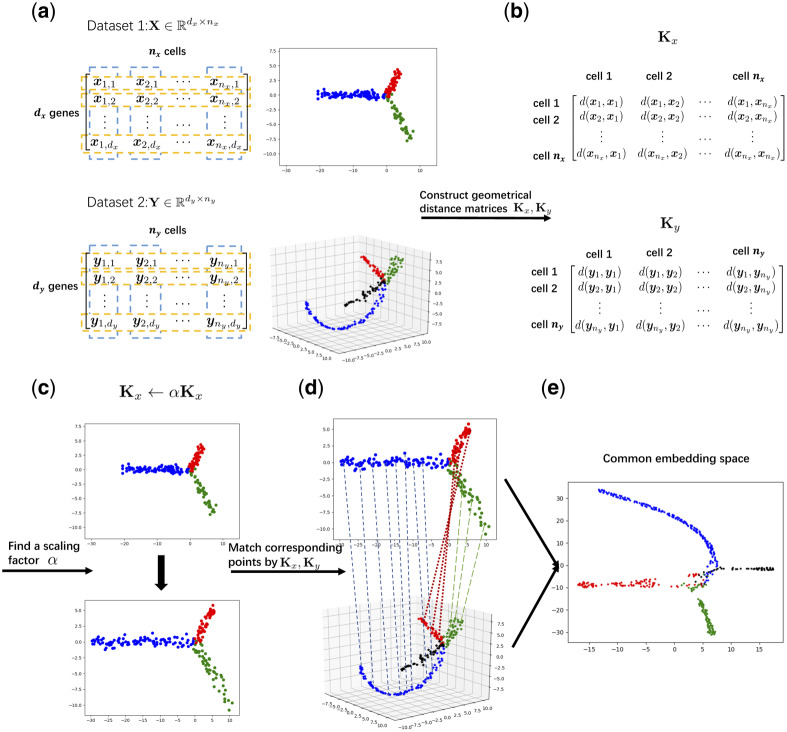
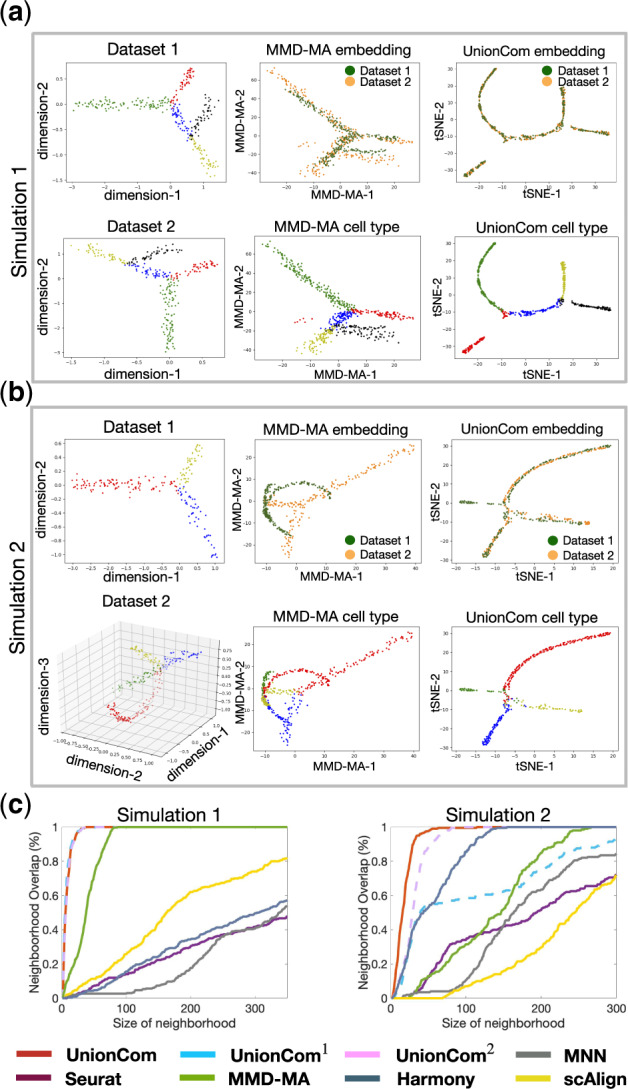
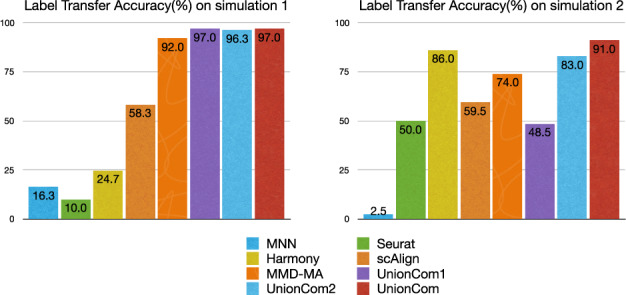
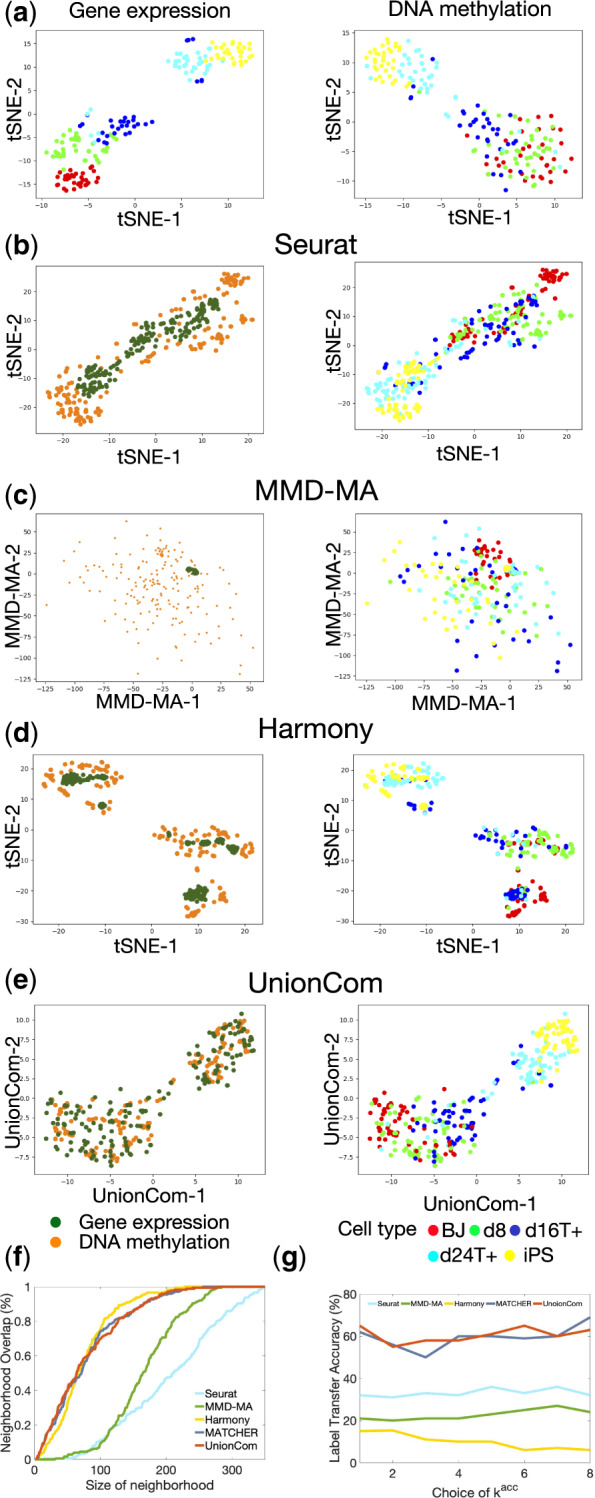
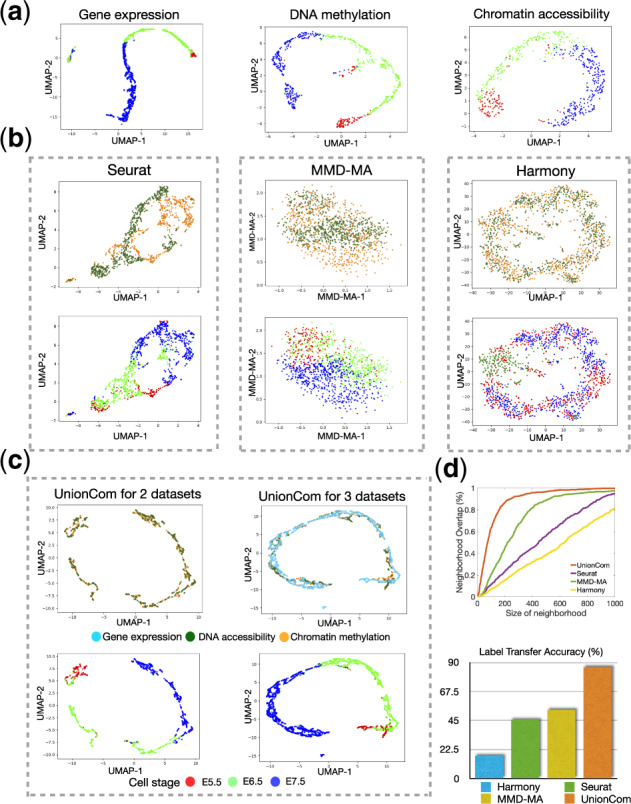
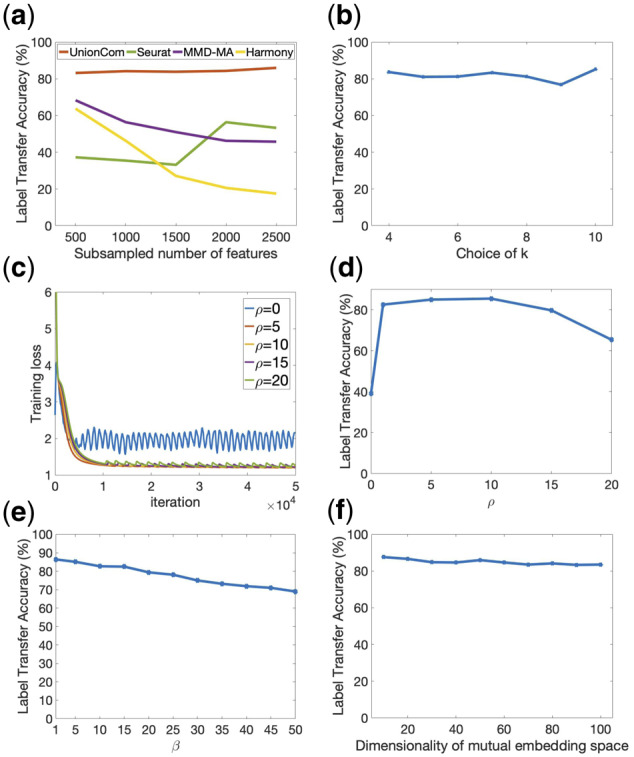
Results: In this study, we present a novel algorithm, termed UnionCom, for the unsupervised topological alignment of single-cell multi-omics integration. UnionCom does not require any correspondence information, either among cells or among features. It first embeds the intrinsic low-dimensional structure of each single-cell dataset into a distance matrix of cells within the same dataset and then aligns the cells across single-cell multi-omics datasets by matching the distance matrices via a matrix optimization method. Finally, it projects the distinct unmatched features across single-cell datasets into a common embedding space for feature comparability of the aligned cells. To match the complex non-linear geometrical distorted low-dimensional structures across datasets, UnionCom proposes and adjusts a global scaling parameter on distance matrices for aligning similar topological structures. It does not require one-to-one correspondence among cells across datasets, and it can accommodate samples with dataset-specific cell types. UnionCom outperforms state-of-the-art methods on both simulated and real single-cell multi-omics datasets. UnionCom is robust to parameter choices, as well as subsampling of features.

Availability and implementation: UnionCom software is available at https://github.com/caokai1073/UnionCom.

Supplementary information: Supplementary data are available at Bioinformatics online.


Figures

Fig. 1.
Fig. 1.
Schematic overview of UnionCom. (a) Given the input of single-cell multi-omics datasets (e.g. Datasets 1 and 2), which have similar embedded topological structures, UnionCom (b) embeds the intrinsic low-dimensional structure of each single-cell dataset into a geometrical distance matrix of cells within the same dataset; (c) rescales the global distortions on the topological structures across datasets by a global scaling parameter α; (d) aligns the cells across single-cell datasets by matching the geometrical distance matrices based on a matrix optimization method; and (e) finally projects the distinct unmatched features across modalities into a common embedding space for feature comparability of the aligned cells. It does not require one-to-one correspondence among cells across datasets, and it can accommodate samples with dataset-specific cell types (see the branch with black points in Dataset 2 for example)
Fig. 2.
Fig. 2.
Alignment of simulated datasets. (a) Simulation 1 and (b) Simulation 2: Visualizations of Dataset 1 (upper left panel) and Dataset 2 (lower left panel), separately using t-SNE before alignment; branches with points in the same colors are matched between datasets; visualization of the common embedding space of the two aligned datasets by MMD-MA (upper middle panel: points are colored according to their corresponding datasets; lower middle panel: points are colored according to their corresponding branches) and UnionCom (upper right panel: points are colored according to their corresponding datasets; lower right panel: points are colored according to their corresponding branches). The green branch of Dataset 2 of Simulation 2 (lower left panel of (b)) is a dataset-specific cell type, which has unique topological structure with branches of Dataset 2. (c) Averaged percentage of Neighborhood Overlap at different size of neighborhood (left panel: Simulation 1; right panel: Simulation 2)
Fig. 3.
Fig. 3.
The Label Transfer Accuracy (%) by 8 methods on the 2 simulation studies. UnionCom1: UnionCom using Euclidean distance instead of geodesic distance; UnionCom2: UnionCom with a fixed α=dy/dx
Fig. 4.
Fig. 4.
Alignment of sc-GEM omics datasets of gene expression and DNA methylation. (a) Visualizations of the gene expression and DNA methylation datasets separately using t-SNE before alignment. Visualizations of the common embedding space of the two aligned datasets by Seurat (b), MMD-MA (c), Harmony (d) and UnionCom (e), respectively [left panel: points (cells) are colored according to their corresponding datasets; right panel: points (cells) are colored according to their corresponding cell types]. (e) Averaged percentage of Neighborhood Overlap at different size of neighborhood. (f) Label Transfer Accuracy at different kacc of the kacc-nn classifier
Fig. 5.
Fig. 5.
Alignment of sc-NMT omics datasets of gene expression, DNA methylation, and chromatin accessibility. (a) Visualizations of the gene expression, DNA methylation and chromatin accessibility datasets separately using UMAP before alignment. (b) Visualizations of the common embedding space of the two aligned datasets of DNA methylation and chromatin accessibility by Seurat (left panel), MMD-MA (middle panel) and Harmony (right panel), respectively; (c) Visualizations of the common embedding space of two aligned datasets of DNA methylation and chromatin accessibility (left panel) and three aligned datasets of DNA methylation, chromatin accessibility and gene expression by UnionCom (right panel). Upper panel of (b and c): points (cells) are colored according to their corresponding datasets; Lower panel of (b and c): points (cells) are colored according to their corresponding time stages. (d) Averaged percentage of Neighborhood Overlap (upper panel) and Label Transfer Accuracy (lower panel) on the alignment of the two datasets of DNA methylation and chromatin accessibility
Fig. 6.
Fig. 6.
The robustness of UnionCom in both subsampling features of data and parameter choices on the two sc-NMT datasets of DNA methylation and chromatin accessibility. (a) Label Transfer Accuracy of UnionCom, Seurat, MMD-MA and Harmony when randomly sampling a subset of features without replacement from each of the DNA accessibility and chromatin methylation datasets separately before alignment. (b) Label Transfer Accuracy of UnionCom when choosing different k of the k-nn graph in Step A1 of UnionCom. (c) The convergence performance of UnionCom in training loss using different ρ for the penalty term in Equation (2); when ρ = 0, no penalty term is applied in Equation (2). (d) Label Transfer Accuracy of UnionCom when choosing different ρ. (e) Label Transfer Accuracy of UnionCom when choosing different tradeoff parameter β in Equation (3). (f) Label Transfer Accuracy of UnionCom when embedding the two datasets into a common space of different dimensionality of p in Step A3 of UnionCom

References

    1. Amodio M., Krishnaswamy S. (2018) MAGAN: aligning biological manifolds. In: Proceedings of the 35th International Conference on Machine Learning, pp. 215–223. ACM, Stockholm, Sweden.
    1. Becht E. et al. (2019) Dimensionality reduction for visualizing single-cell data using UMAP. Nat. Biotechnol., 37, 38–44. - PubMed
    1. Chen Z. et al. (2019) DensityPath: an algorithm to visualize and reconstruct cell state-transition path on density landscape for single-cell RNA sequencing data. Bioinformatics, 35, 2593–2601. - PubMed
    1. Cheow L.F. et al. (2016) Single-cell multimodal profiling reveals cellular epigenetic heterogeneity. Nat. Methods, 13, 833–836. - PubMed
    1. Clark S.J. et al. (2018) scNMT-seq enables joint profiling of chromatin accessibility DNA methylation and transcription in single cells. Nat. Commun., 9, 781. - PMC - PubMed

Publication types