

Boosting the accuracy of protein secondary structure prediction through nearest neighbor search and method hybridization
- PMID: 32657384
- PMCID: PMC7355242
- DOI: 10.1093/bioinformatics/btaa336
Boosting the accuracy of protein secondary structure prediction through nearest neighbor search and method hybridization
Abstract
Motivation: Protein secondary structure prediction is a fundamental precursor to many bioinformatics tasks. Nearly all state-of-the-art tools when computing their secondary structure prediction do not explicitly leverage the vast number of proteins whose structure is known. Leveraging this additional information in a so-called template-based method has the potential to significantly boost prediction accuracy.
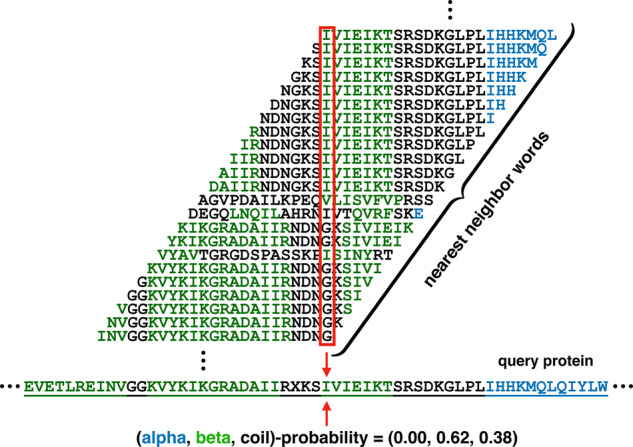
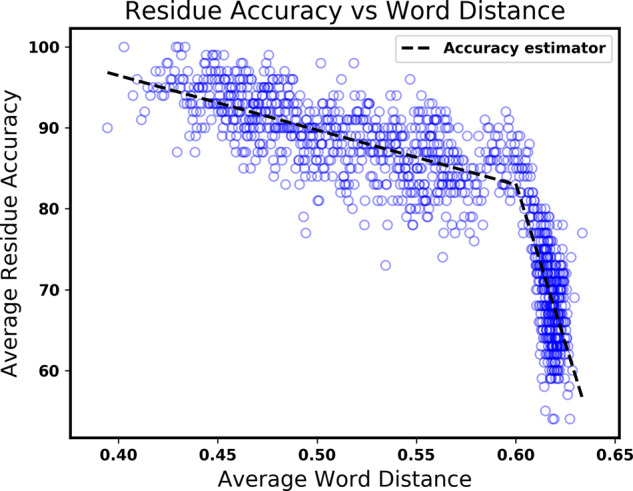
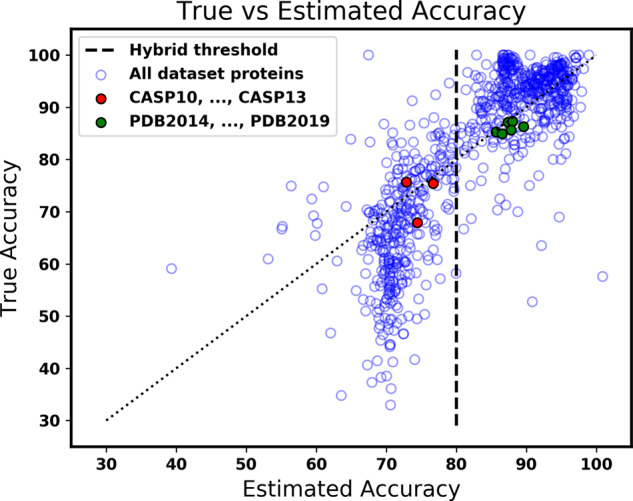
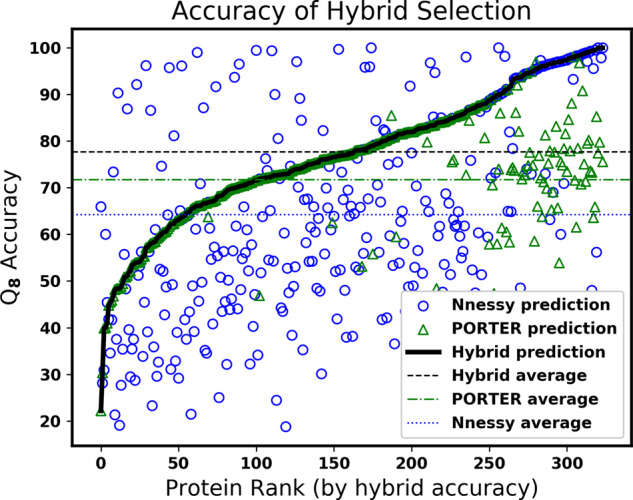
Method: We present a new hybrid approach to secondary structure prediction that gains the advantages of both template- and non-template-based methods. Our core template-based method is an algorithmic approach that uses metric-space nearest neighbor search over a template database of fixed-length amino acid words to determine estimated class-membership probabilities for each residue in the protein. These probabilities are then input to a dynamic programming algorithm that finds a physically valid maximum-likelihood prediction for the entire protein. Our hybrid approach exploits a novel accuracy estimator for our core method, which estimates the unknown true accuracy of its prediction, to discern when to switch between template- and non-template-based methods.
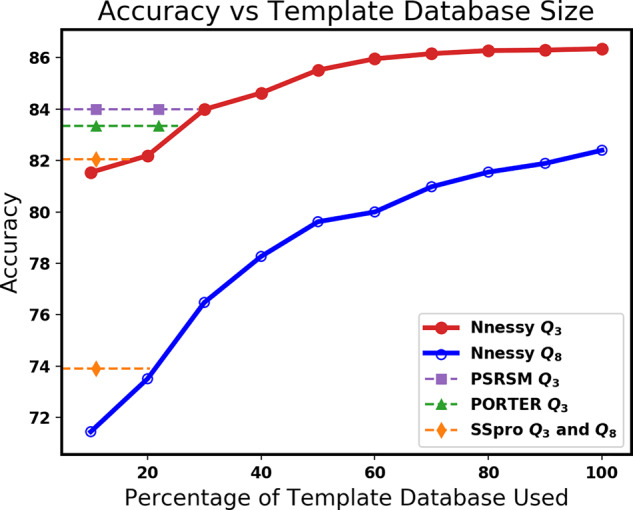
Results: On challenging CASP benchmarks, the resulting hybrid approach boosts the state-of-the-art Q8 accuracy by more than 2-10%, and Q3 accuracy by more than 1-3%, yielding the most accurate method currently available for both 3- and 8-state secondary structure prediction.
Availability and implementation: A preliminary implementation in a new tool we call Nnessy is available free for non-commercial use at http://nnessy.cs.arizona.edu.
© The Author(s) 2020. Published by Oxford University Press.
Figures
Similar articles
-
Protein secondary structure prediction using nearest-neighbor methods.J Mol Biol. 1993 Aug 20;232(4):1117-29. doi: 10.1006/jmbi.1993.1464. J Mol Biol. 1993. PMID: 8371270
-
Template-based C8-SCORPION: a protein 8-state secondary structure prediction method using structural information and context-based features.BMC Bioinformatics. 2014;15 Suppl 8(Suppl 8):S3. doi: 10.1186/1471-2105-15-S8-S3. Epub 2014 Jul 14. BMC Bioinformatics. 2014. PMID: 25080939 Free PMC article.
-
MUPRED: a tool for bridging the gap between template based methods and sequence profile based methods for protein secondary structure prediction.Proteins. 2007 Feb 15;66(3):664-70. doi: 10.1002/prot.21177. Proteins. 2007. PMID: 17109407
-
Protein secondary structure prediction based on the fuzzy support vector machine with the hyperplane optimization.Gene. 2018 Feb 5;642:74-83. doi: 10.1016/j.gene.2017.11.005. Epub 2017 Nov 14. Gene. 2018. PMID: 29104167
-
A decade of CASP: progress, bottlenecks and prognosis in protein structure prediction.Curr Opin Struct Biol. 2005 Jun;15(3):285-9. doi: 10.1016/j.sbi.2005.05.011. Curr Opin Struct Biol. 2005. PMID: 15939584 Review.
Cited by
-
GBDT_KgluSite: An improved computational prediction model for lysine glutarylation sites based on feature fusion and GBDT classifier.BMC Genomics. 2023 Dec 11;24(1):765. doi: 10.1186/s12864-023-09834-z. BMC Genomics. 2023. PMID: 38082413 Free PMC article.
-
Protein Secondary Structure Prediction With a Reductive Deep Learning Method.Front Bioeng Biotechnol. 2021 Jun 15;9:687426. doi: 10.3389/fbioe.2021.687426. eCollection 2021. Front Bioeng Biotechnol. 2021. PMID: 34211967 Free PMC article.
-
Recent Advances in Computational Prediction of Secondary and Supersecondary Structures from Protein Sequences.Methods Mol Biol. 2025;2870:1-19. doi: 10.1007/978-1-0716-4213-9_1. Methods Mol Biol. 2025. PMID: 39543027 Review.
-
Deep_KsuccSite: A novel deep learning method for the identification of lysine succinylation sites.Front Genet. 2022 Sep 29;13:1007618. doi: 10.3389/fgene.2022.1007618. eCollection 2022. Front Genet. 2022. PMID: 36246655 Free PMC article.
References
-
- Adamczak R. et al. (2004) Accurate prediction of solvent accessibility using neural networks-based regression. Proteins, 56, 753–767. - PubMed
-
- Beygelzimer A. et al. (2006) Cover trees for nearest neighbor. In Proceedings of the 23rd International Conference on Machine Learning (ICML). [CrossRef][10.1145/1143844.1143857]
-
- DeBlasio D., Kececioglu J. (2017) Parameter Advising for Multiple Sequence Alignment, Volume 26 of Computational Biology Series. Springer International. Cham, Switzerland.
Publication types
MeSH terms
Substances
LinkOut - more resources
Full Text Sources
Miscellaneous
