

Local externalization of phosphatidylserine mediates developmental synaptic pruning by microglia
- PMID: 32657463
- PMCID: PMC7429741
- DOI: 10.15252/embj.2020105380
Local externalization of phosphatidylserine mediates developmental synaptic pruning by microglia
Abstract
Neuronal circuit assembly requires the fine balance between synapse formation and elimination. Microglia, through the elimination of supernumerary synapses, have an established role in this process. While the microglial receptor TREM2 and the soluble complement proteins C1q and C3 are recognized as key players, the neuronal molecular components that specify synapses to be eliminated are still undefined. Here, we show that exposed phosphatidylserine (PS) represents a neuronal "eat-me" signal involved in microglial-mediated pruning. In hippocampal neuron and microglia co-cultures, synapse elimination can be partially prevented by blocking accessibility of exposed PS using Annexin V or through microglial loss of TREM2. In vivo, PS exposure at both hippocampal and retinogeniculate synapses and engulfment of PS-labeled material by microglia occurs during established developmental periods of microglial-mediated synapse elimination. Mice deficient in C1q, which fail to properly refine retinogeniculate connections, have elevated presynaptic PS exposure and reduced PS engulfment by microglia. These data provide mechanistic insight into microglial-mediated synapse pruning and identify a novel role of developmentally regulated neuronal PS exposure that is common among developing brain structures.
Keywords: C1q; TREM2; microglia; phosphatidylserine; synapse pruning.
© 2020 The Authors. Published under the terms of the CC BY NC ND 4.0 license.
Conflict of interest statement
B.S. serves on the Scientific Advisory Board of Annexon and is a minor shareholder of Annexon. The remaining authors declare no competing financial interests.
Figures
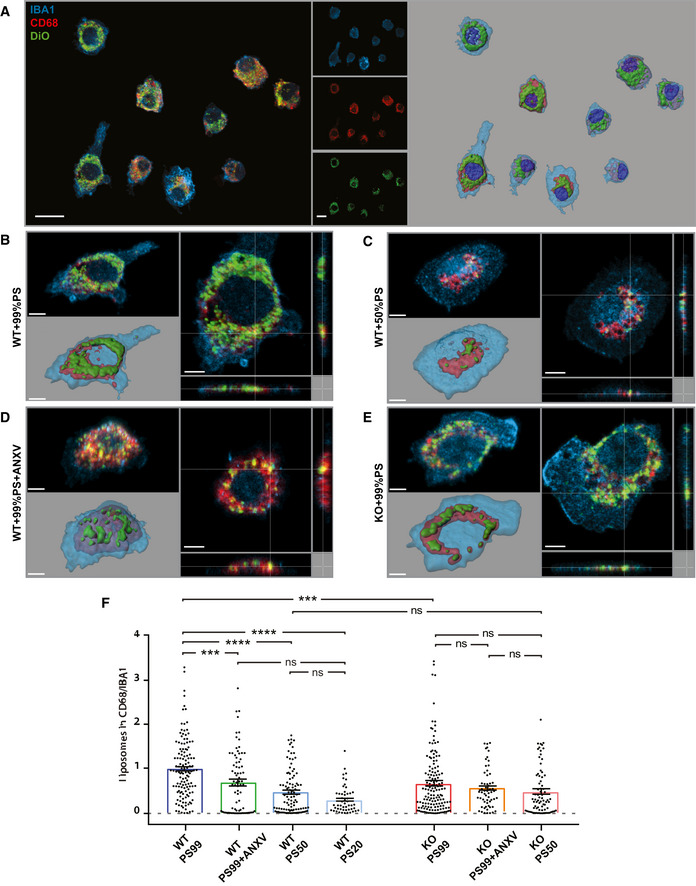
- A
Representative confocal images and 3D reconstruction of in vitro WT microglia fed with DiO‐labeled liposomes containing a controlled amount of phosphatidylserine (PS; 99, 50, 20%). Microglia were stained with Iba1 (blue) and lysosomes labeled with CD68 (red). Scale bar: 10 μm.
- B–E
Representative images showing (B) WT microglia fed with 99% PS or (C) 50% PS liposomes, (D) WT microglia pre‐treated with ANXV and fed with 99% PS liposomes, and (E) Trem2 −/− microglia fed with 99% PS liposomes.
- F
Histogram illustrating the quantification of the engulfed materials by microglia fed with liposomes (WT PS99: 1 ± 0.06, n = 129 cells analyzed; WT PS99 + ANXV: 0.70 ± 0.08, n = 76 cells analyzed; PS50: 0.49 ± 0.05, n = 99 cells analyzed; PS20: 0.31 ± 0.04, n = 50 cells analyzed; KO PS99: 0.68 ± 0.06, n = 146 cells analyzed; KO PS99 + ANXV: 0.57 ± 0.06, n = 76 cells analyzed; KO PS50: 0.48 ± 0.06, n = 77 cells analyzed). Bars represent mean ± SEM.
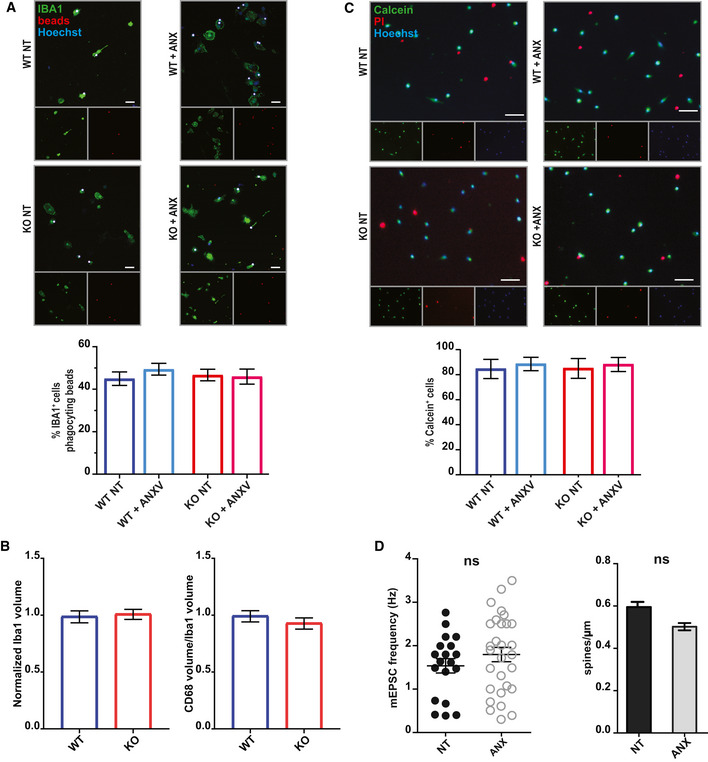
Analysis of in vitro microglial phagocytic activity following ANXV treatment. Phagocytosis was assessed by measuring microglial engulfment of fluorescent beads (3 μm; Spherotech). No significant difference was observed between untreated and treated microglia (WT NT: 44.95 ± 3.19; WT + ANXV: 49.39 ± 2.76; KO NT: 46.68 ± 2.73; KO + ANXV: 45.93 ± 3.54). Three independent experiments were performed; scale bar 10 μm.
Quantification of the cell volume (by Iba1 staining) and phagocytic compartment (by CD68 staining) reveals lack of differences between WT and Trem2−/− microglia (Iba1: 105 WT cells and 112 KO cells were analyzed. CD68: 98 WT cells and 128 KO cells were analyzed). Three independent experiments (N) were performed.
Analysis of microglial viability in vitro following ANXV treatment. Viability was determined using the live marker Calcein combined with propidium iodide (PI) to label dying cells. No significant difference was observed between untreated and treated microglia (WT NT: 84.54% ± 7.67; WT + ANXV: 88.5% ± 5.36; KO NT: 84.94% ± 7.93; KO + ANXV: 88.12 ± 5.63). Three independent experiments (N) were performed; scale bar 30 μm.
Analysis of mEPSC frequency and spine density in hippocampal neurons exposed to ANXV treatment shows the lack of significant differences between untreated and treated neurons for either parameter. Data reflect single‐cell measurements from three independent experiments (N). Unpaired t‐test was performed.
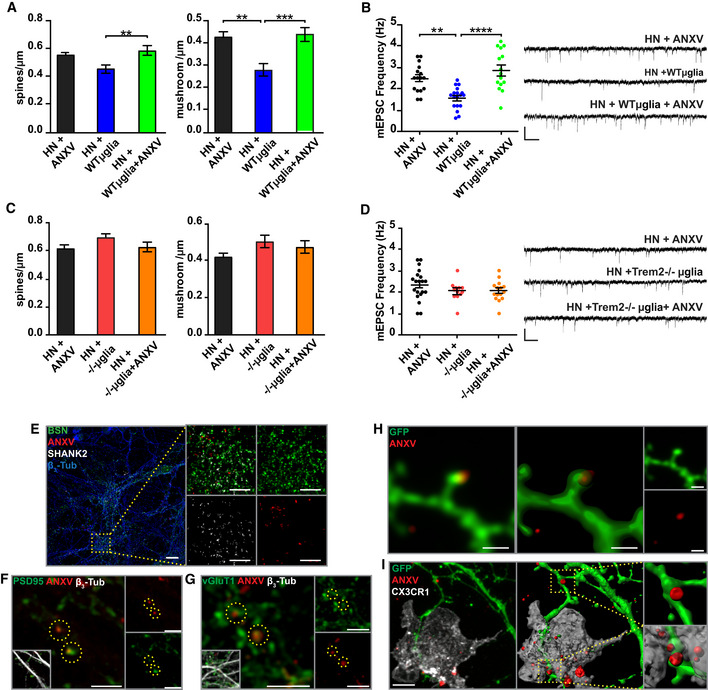
- A
Quantitative analysis of total and mushroom spines density in hippocampal neurons (HN) exposed to ANXV, HN co‐cultured with WT microglia, or HN exposed to ANXV and co‐cultured with WT microglia. HN + ANXV: spines/μm = 0.55 ± 0.03, mushroom/μm = 0.42 ± 0.03, number of examined dendrites: 47, n = 25 cells; HN + WT microglia: spines/μm = 0.45 ± 0.03, mushroom/μm = 0.28 ± 0.03, number of examined dendrites: 35, n = 19 cells; HN + WT microglia + ANXV: spines/μm = 0.58 ± 0.3, mushroom/μm = 0.44 ± 0.03, number of examined dendrites: 44, n = 18 cells.
- B
Histogram and representative traces of mEPSC whole‐cell recordings showing miniature event frequency in the same conditions described for (A). mEPSC frequency: HN + ANXV: 2.48 ± 0.16 n = 16 cells, HN + WT microglia: 1.58 ± 0.12, n = 18 cells, HN + WT microglia + ANXV: 2.86 ± 0.24, n = 15 cells. Scale bars, 10 pA and 250 ms.
- C
Quantitative analysis of total and mushroom spines density in HN exposed to ANXV, co‐cultured with Trem2 −/− microglia or HN co‐cultured with Trem2 −/− microglia and exposed to ANXV. No statistical differences were found among the different conditions. HN + ANXV: spines/μm = 0.62 ± 0.03, mushroom/μm = 0.42 ± 0.03, number of examined dendrites: 64, n = 8 cells; HN + −/−microglia: spines/μm = 0.70 ± 0.02, mushroom/μm = 0.50 ± 0.03, number of examined dendrites: 40, n = 8 cells; HN + −/−microglia + ANXV: spines/μm = 0.63 ± 0.3, mushroom/μm = 0.47 ± 0.03, number of examined dendrites: 17, n = 7 cells.
- D
Histogram and representative traces of mEPSC whole‐cell recordings showing miniature event frequency in the same conditions described for (C). No statistical differences were found among the different conditions. mEPSC frequency: HN + ANXV: 2.34 ± 0.16, n = 20 cells, HN + −/−microglia: 2.04 ± 0.13, n = 12 cells, HN + −/−microglia + ANXV: 2.05 ± 0.12 n = 15 cells. Scale bars, 10 pA and 250 ms.
- E
Representative confocal images of HN cultures labeled with ANXV and stained for the neuronal marker β3‐tubulin, the presynaptic marker Bassoon, and the postsynaptic marker Shank2. Scale bar: 5 μm
- F, G
Representative confocal images of HN labeled with ANXV and stained for PSD95 (F) and vGlut1 (G). Co‐localization between ANXV‐positive puncta and PSD95/vGlut1 markers is highlighted by yellow dashed circles. No preferential association of ANXV with pre‐ or postsynaptic markers was detected. Scale bar: (F) 5 μm (G) 2 μm.
- H
Representative confocal image of GFP‐expressing neurons labeled with ANXV. Note the presence of ANXV‐positive structures on the dendritic protrusion. Scale bar 1 μm.
- I
Representative confocal image of microglia co‐cultured with GFP‐expressing neurons previously exposed to ANXV. Note the presence of ANXV‐positive structures on dendritic protrusions in the process to be engulfed by microglia. Scale bar 6 μm.
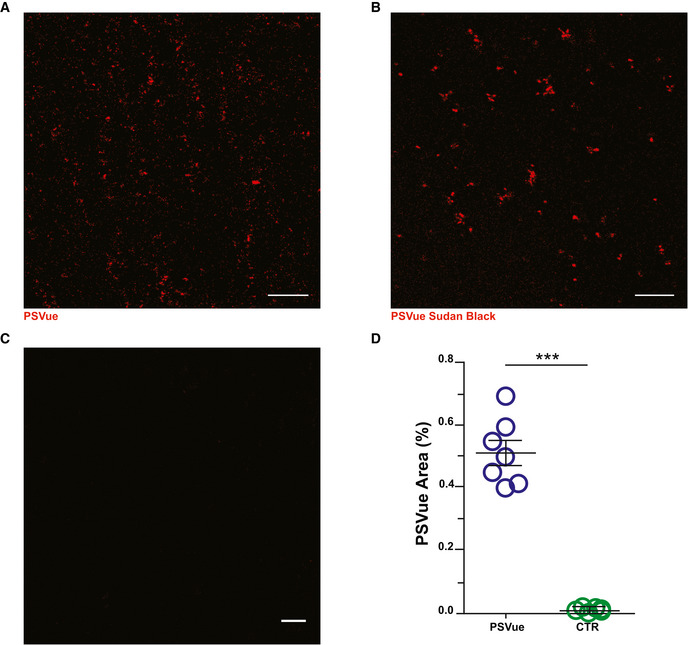
- A–C
Representative images of CA1 of WT P18 animals sacrificed 3 h after PSVue injection. (A) PsVue signal was tested by incubating slices with (B) Sudan Black. (C) The specificity of the signal was confirmed by comparing PsVue signal with slices stained with fluorophore only. Scale bar: 5 μm.
- D
Quantification of PSVue puncta in WT P10 animals compared with unlabeled control. WT PSVue: 0.5149 ± 0.04 vs. CTRL: 0.011 ± 0.002; WT PSVue: N = 4 animals n = 7 fields; CTRL: N = 3 animals n = 6 fields; ***P < 0.001, unpaired t‐test. Bars represent mean ± SEM.
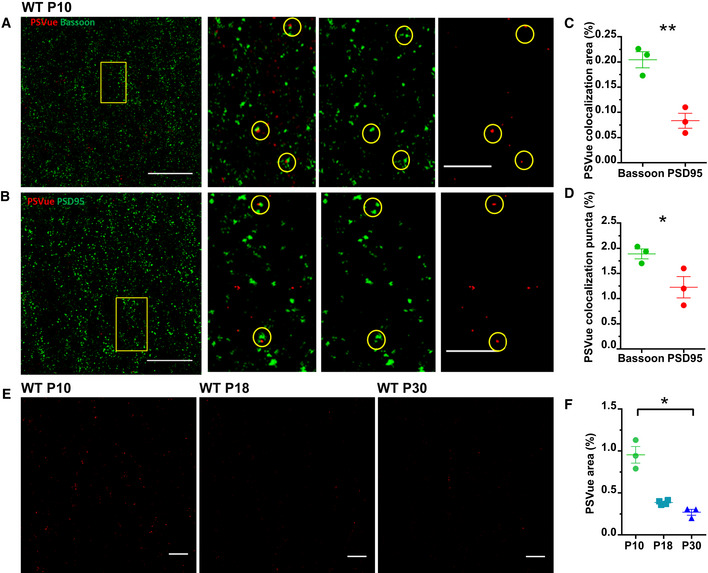
- A, B
Representative images of the CA1 region of WT P10 mouse brains stained for the presynaptic marker Bassoon (A) and the postsynaptic marker PSD95 (B). Mice were sacrificed 3 h after PSVue injection. Yellow boxes represent magnified image on the right. Co‐localization between ANXV‐positive puncta and Bassoon/PSD95 markers is highlighted by yellow dashed circles. Images taken at 63× magnification. Scale bar 5 μm.
- C, D
Quantification of PSVue co‐localization with either presynaptic (Bassoon) or postsynaptic (PSD95) markers in CA1 region of WT P10 animals following PSVue injection (3 h of treatment). PSVue + Bassoon co‐localized area: 0.204 ± 0.1 vs. PSVue + PSD95 co‐localized area: 0.083 ± 0.01; PSVue + Bassoon co‐localized puncta 1.89% ± 0.1 vs. PSVue + PSD95 co‐localized puncta 1.22% ± 0.16; P10 N = 3 animals *P < 0.05 and **P < 0,01, unpaired t‐test. Bars represent mean ± SEM.
- E
Representative images of the CA1 hippocampal region of WT P10, P18, and P30 animals sacrificed 3 h after PSVue injection. Images were acquired with a 63× magnification. Scale bar 5 μm.
- F
Quantification of PSVue signal in the CA1 hippocampal region of WT P10, P18, and P30 animals sacrificed 3 h after PSVue injection. PSvue area: P10 0.954% ± 0.09 vs. P18 0.386% ± 0.01 vs. P30: 0.271% ± 0.030; P10 N = 3 animals; P18 N = 4 animals, P30 N = 3 animals. *P < 0.05, one‐way ANOVA with Kruskal–Wallis test. Bars represent mean ± SEM.
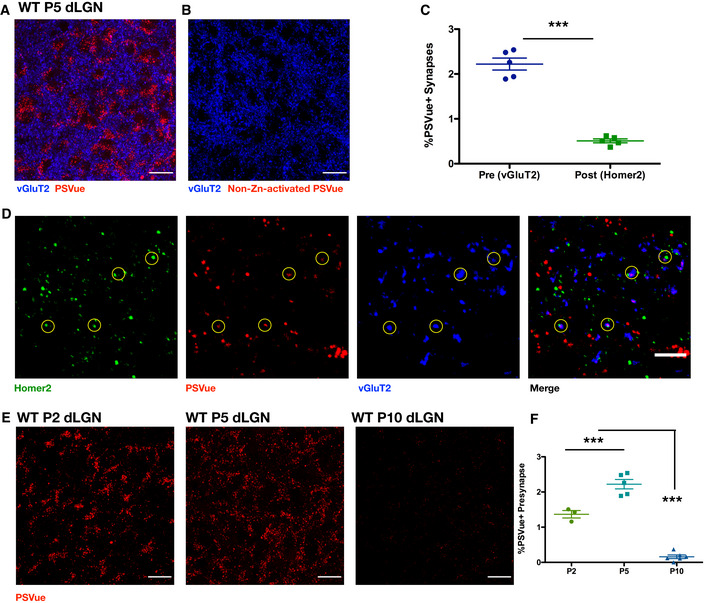
- A, B
Representative max intensity images of the dLGN following injection with either PSVue (A) or non‐zinc‐activated PSVue (B) in WT P4 C57/Bl6 mice 24 h prior. IHC for the presynaptic marker vGluT2 was performed. Images taken at 63× magnification; scale bar represents 15 μm.
- C
Quantification of PSVue co‐localization at synapses in the dLGN of WT P5 mice injected with PSVue 24 h prior. Data represent the mean per animal ± SEM; N = 5 PSVue + presynaptic: 2.22% ± 0.134 vs. PSVue + postsynaptic: 0.51% ± 0.043. ***P < 0.0001, paired t‐test.
- D
Representative images of presynaptic (vGluT2) and postsynaptic (Homer2) IHC performed in the dLGN of WT P5 animals following PSVue injection 24 h prior. Synapses were identified through co‐localization of pre‐ and postsynaptic markers in CellProfiler. Circles indicate synapses where PSVue co‐localization was observed. Images taken at 63× magnification; scale bar represents 5 μm.
- E
Representative max intensity images of the dLGN following injection with PSVue 24 h prior in WT P2, P5, and P10 C57/Bl6 mice. Images taken at 63× magnification; scale bar represents 15 μm.
- F
Quantification of PSVue co‐localization with vGluT2 at synapses in the dLGN of WT P2, P5, and P10 C57/Bl6 mice injected with PSVue 24 h prior. Data represent the mean per animal ± SEM; N = 3 (P2), N = 5 (P5), N = 6 (P10); P2: 1.36% ± 0.105 vs. P5: 2.22% ± 0.134 vs. P10: 0.16% ± 0.050. ***P < 0.0001, one‐way ANOVA with Tukey's multiple comparison test.
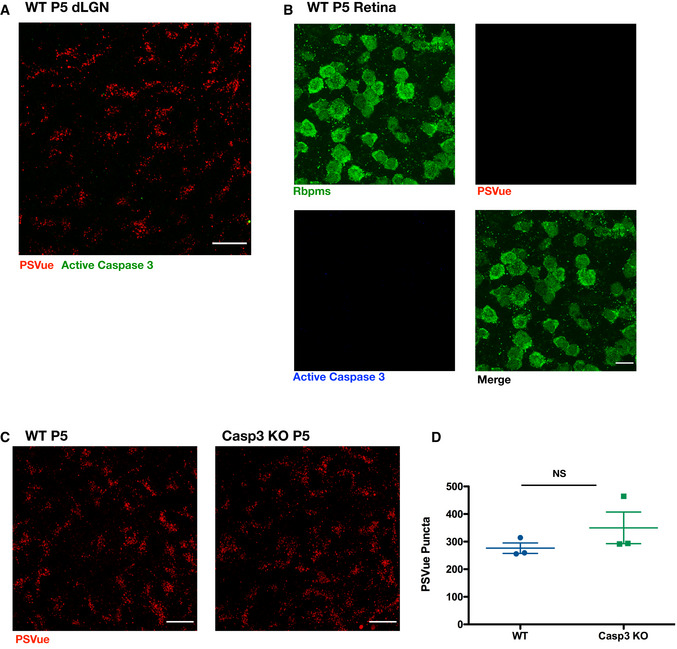
Representative max intensity image of the dLGN following injection with PSVue 24 h prior in WT P5 C57/Bl6 mice. IHC for active caspase 3 was performed. Images taken at 63× magnification; scale bar represents 15 μm.
Representative images of retinal whole mounts of WT P5 C57/Bl6 mice following injection with PSVue 24 h prior. IHC for the pan‐RGC marker Rpbms and active caspase 3 was performed. Images taken at 63× magnification; scale bar represents 15 μm.
Representative max intensity images of the dLGN following injection with PSVue 24 h prior in WT or caspase 3 knockout (KO) P5 littermates. Images taken at 63× magnification; scale bar represents 15 μm.
Quantification of PSVue in the dLGN of WT or caspase 3 KO P5 littermates injected with PSVue 24 h prior. Data represent the mean per animal ± SEM; N = 3; WT: 276.4 ± 19.01 vs. caspase 3 KO: 349.9 ± 57.29. P = 0.2904, unpaired t‐test.
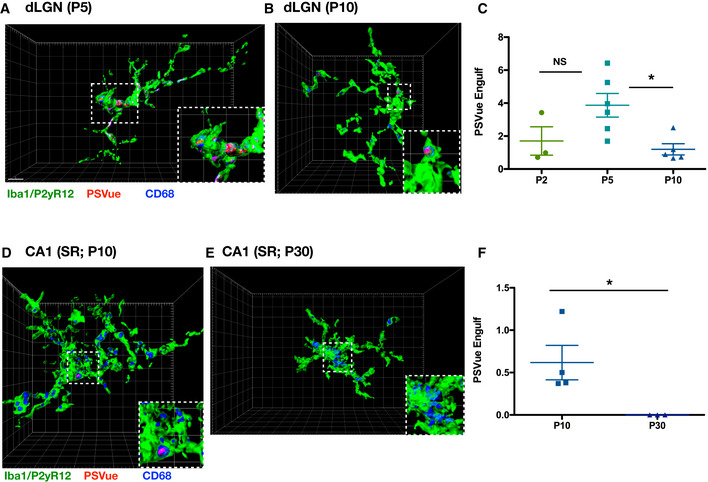
- A, B
Representative Imaris surface‐rendered images of microglia in the dLGN following injection with PSVue 24 h prior in WT P5 (A) and P10 (B) C57/Bl6 mice. Microglia are labeled by IHC with Iba1 and P2yR12, and lysosomes are labeled with CD68. Images taken at 63× magnification; scale bar represents 5 μm.
- C
Quantification of the volume of engulfed PSVue material in dLGN microglia analyzed from WT P2, P5, and P10 C57/Bl6 mice injected with PSVue 24 h prior. Data represent the mean of 15–20 microglia per animal ± SEM; N = 3 (P2), N = 6 (P5), N = 5 (P10); P2: 1.703% ± 0.861 vs. P5: 3.868% ± 0.715 vs. P10: 1.196% ± 0.340. *P = 0.0237 (P5 vs. P10), one‐way ANOVA with Tukey's multiple comparison test.
- D, E
Representative Imaris surface‐rendered images of microglia in the SR of CA1 following injection with PSVue 24 h prior in WT P10 (D) and P30 (E) C57/Bl6 mice. Microglia are labeled by IHC with Iba1 and P2yR12, and lysosomes are labeled with CD68. Images taken at 63× magnification.
- F
Quantification of the volume of engulfed PSVue material in CA1 microglia analyzed from WT P10 and P30 C57/Bl6 mice injected with PSVue 24 h prior. Data represent the mean of 15–20 microglia per animal ± SEM; N = 4 (P10), N = 3 (P30); P10: 0.617% ± 0.203 vs. P30: 1.17e−5% ± 3.33e−7. *P = 0.05, one‐way ANOVA with Tukey's multiple comparison test.
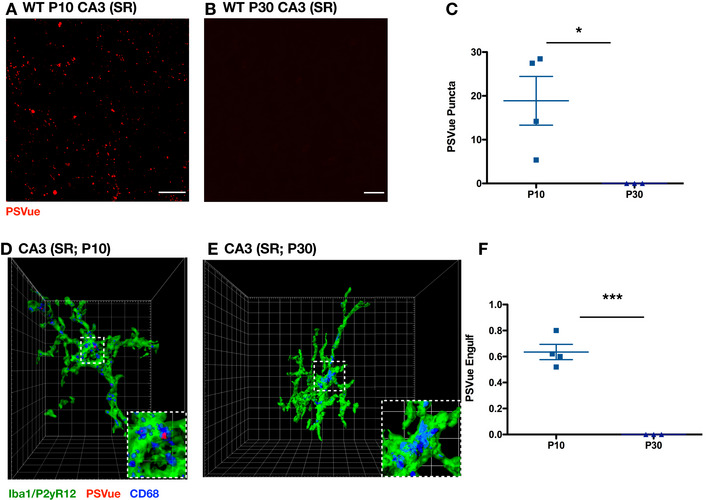
- A, B
Representative max intensity images of CA3 SR following injection with PSVue 24 h prior in WT P10 (A) and P30 (B) C57/Bl6 mice. Images taken at 63× magnification; scale bar represents 15 μm.
- C
Quantification of PSVue in CA3 SR of WT P10 and P30 C57/Bl6 mice injected with PSVue 24 h prior. Data represent the mean per animal ± SEM; N = 4 (P10), N = 3 (P30); P10: 18.88 ± 5.55 vs. P30: 1.50e−5 ± 8.386e−6. *P = 0.0349, unpaired t‐test.
- D, E
Representative Imaris surface‐rendered images of microglia in CA3 SR following injection with PSVue 24 h prior in WT P10 (D) and P30 (E) C57/Bl6 mice. Microglia are labeled by IHC with Iba1 and P2yR12, and lysosomes are labeled with CD68. Images taken at 63× magnification.
- F
Quantification of the volume of engulfed PSVue material in CA3 microglia analyzed from WT P10 and P30 C57/Bl6 mice injected with PSVue 24 h prior. Data represent the mean of 15–20 microglia per animal ± SEM; N = 4 (P10), N = 3 (P30); P10: 0.635% ± 0.059 vs. P30: 1.033e−5% ± 6.386e−6. ***P = 0.0003, unpaired t‐test.
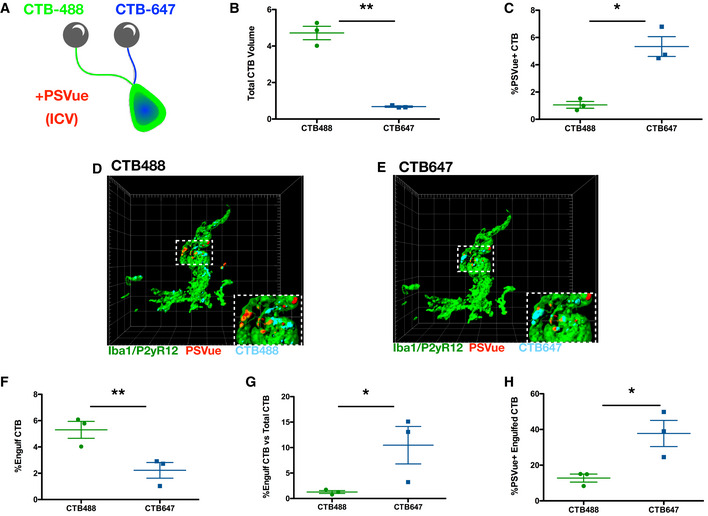
- A
Schematic of the experimental design for analysis of PSVue co‐localization onto retinal ganglion cell (RGC) inputs. Cholera toxin β‐subunit (CTB) conjugated to Alexa 488 or 647 was intraocularly injected into the contralateral or ipsilateral eyes of P4 WT mice, respectively. PSVue was then ICV‐injected, and animals were sacrificed 24 h later.
- B
Quantification of the total volume of CTB‐488 or CTB‐647 RGC inputs in the dLGN of P5 mice injected with PSVue 24 h prior. Data represent mean volume per animal. N = 3 animals ± SEM; CTB‐488: 4.717% ± 0.367 vs. CTB‐647: 0.68% ± 0.035. **P = 0.0079, paired t‐test.
- C
Quantification of the percentage of the volume of CTB‐488 or CTB‐647 RGC inputs that are co‐localized with PSVue. The volume of co‐localized signal was divided by the total volume of the inputs for either eye. N = 3 animals ± SEM; CTB‐488: 1.06% ± 0.247 vs. CTB‐647: 5.337% ± 0.73. *P = 0.0132, paired t‐test.
- D, E
Representative Imaris surface‐rendered images of a microglia showing engulfed PSVue material along with engulfed CTB‐488 (D) or CTB‐647 (E) in the dLGN following injection with PSVue 24 h prior in WT P5 mice. Microglia are labeled by IHC with Iba1 and P2yR12. Images taken at 63× magnification.
- F
Quantification of the volume of engulfed CTB‐488 or CTB‐647 material in dLGN microglia analyzed from WT P5 mice injected 24 h prior. Data represent the mean engulfment of either CTB‐488 or CTB‐647 from 15 to 20 microglia per animal ± SEM; N = 3, CTB‐488: 5.3% ± 0.641 vs. CTB‐647: 2.22% ± 0.597. **P = 0.0224, paired t‐test.
- G
Quantification of the volume of microglial engulfed CTB‐488 or CTB‐647 normalized to the total volume of contralateral or ipsilateral CTB. Data represent normalized CTB engulfment of CTB‐488 or CTB‐647 from 15 to 20 microglia per animal ± SEM; N = 3, CTB‐488: 1.27% ± 0.280 vs. CTB‐647: 11.33% ± 2.83. *P = 0.0132, paired t‐test.
- H
Quantification of the volume of co‐localized PSVue and CTB (488 vs. 647) engulfed by microglia normalized to the volume of engulfed CTB‐488 or CTB‐647. Data represent normalized PSVue/CTB engulfment of contralateral (488) vs. ipsilateral (647) from 15 to 20 microglia per animal ± SEM; N = 3, CTB‐488: 12.77% ± 2.231 vs. CTB‐647: 37.76% ± 07.331. *P = 0.0432, paired t‐test.
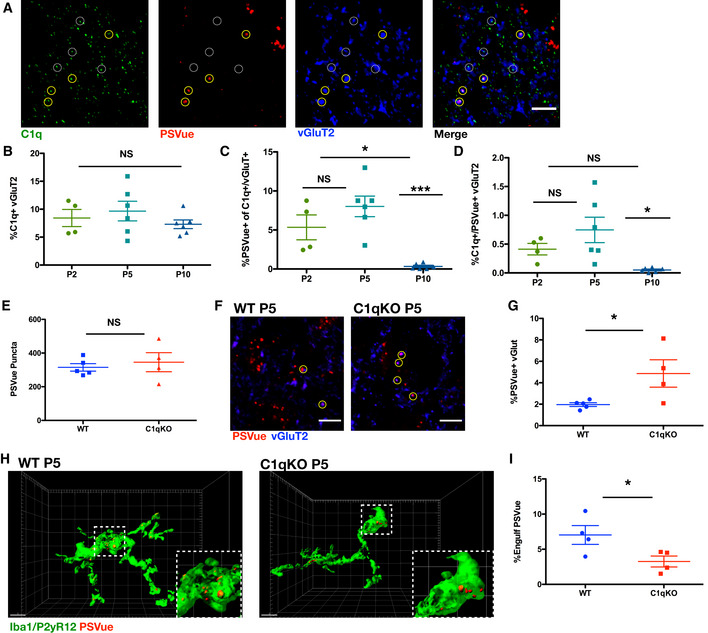
- A
Representative IHC images of C1q and vGluT2 in the dLGN of WT P5 animals following PSVue injection 24 h prior. Yellow circles indicate where PSVue co‐localization with C1q and vGluT2 was observed. Dashed white circles indicate vGluT2 and C1q co‐localization independent of PSVue labeling. Images taken at 63× magnification; scale bar represents 5 μm.
- B–D
Quantification performed in the dLGN of WT P2, P5, and P10 C57/Bl6 mice injected with PSVue 24 h prior of (B) vGluT2 co‐localization with C1q. Data were calculated by quantifying the percentage of C1q/vGluT2 puncta normalized to total vGluT2 inputs. Data represent the mean per animal ± SEM; N = 4 (P2), N = 6 (P5), N = 6 (P10); P2: 8.425% ± 1.527 vs. P5: 9.662% ± 1.756 vs. P10: 7.3% ± 0.774 NS. P > 0.05, one‐way ANOVA with Tukey's multiple comparison test. (C) Quantification of PSVue co‐localization with C1q and vGluT2 inputs. Data were calculated by quantifying the percentage of PSVue/C1q/vGluT2 puncta normalized to C1q/vGluT2 inputs. Data represent the mean per animal ± SEM; N = 4 (P2), N = 6 (P5), N = 6 (P10); P2: 5.34% ± 1.591 vs. P5: 8.023% ± 1.323 vs. P10: 0.33% ± 0.148. *P < 0.05 (P2 vs. P10) and ***P < 0.0001 (P5 vs. P10), one‐way ANOVA with Tukey's multiple comparison test. (D) Quantification of PSVue and C1q co‐localization with vGluT2. Data were calculated by quantifying the percentage of PSVue/C1q/vGluT2 puncta normalized to total vGluT2. Data represent the mean per animal ± SEM; N = 4 (P2), N = 6 (P5), N = 6 (P10); P2: 0.412% ± 0.099 vs. P5: 0.746% ± 0.221 vs. P10: 0.051% ± 0.015. *P = 0.015 (P5 vs. P10), one‐way ANOVA with Tukey's multiple comparison test.
- E
Quantification of PSVue in the dLGN of WT or C1qKO P5 littermates injected with PSVue 24 h prior. Data represent the mean per animal ± SEM; N = 5 (WT), N = 4 (C1qKO); WT: 315.0 ± 22.04 vs. C1qKO: 345.8 ± 56.47. P = 0.597, unpaired t‐test.
- F
Representative images of the dLGN of P5 WT or C1qKO littermates following injection with PSVue 24 h prior. IHC was performed for the presynaptic marker vGluT2. Yellow circles indicate where co‐localization between PSVue and vGluT2 was observed. Images taken at 63× magnification; scale bar represents 5 μm.
- G
Quantification of PSVue co‐localization with vGluT2 at synapses of P5 WT or C1qKO littermates following injection with PSVue 24 h prior. Data represent the mean per animal ± SEM; N = 5 (WT), N = 4 (C1qKO); WT: 1.962% ± 0.174 vs. C1qKO: 4.864% ± 1.277. *P = 0.0382, t‐test.
- H
Representative Imaris surface‐rendered images of microglia in the dLGN following injection with PSVue 24 h prior in P5 WT or C1qKO littermates. Microglia are labeled by IHC with Iba1 and P2yR12. Images taken at 63× magnification; scale bar represents 5 μm.
- I
Quantification of the volume of engulfed PSVue material in microglia of P5 WT or C1qKO littermates following injection with PSVue 24 h prior. Data represent the mean of 15–20 microglia per animal ± SEM; N = 4 (WT), N = 4 (C1qKO); WT: 6.978% ± 1.294 vs. C1qKO: 3.258% ± 0.775. *P = 0.0487, unpaired t‐test.
Comment in
-
Please eat (only part) of me: synaptic phosphatidylserine cues microglia to feast: Two new studies identify how a common apoptotic cell flag is used to sculpt neural circuits.EMBO J. 2020 Aug 17;39(16):e105924. doi: 10.15252/embj.2020105924. Epub 2020 Jul 23. EMBO J. 2020. PMID: 32705698 Free PMC article.
References
-
- Basilico B, Pagani F, Grimaldi A, Cortese B, Di Angelantonio S, Weinhard L, Gross C, Limatola C, Maggi L, Ragozzino D (2019) Microglia shape presynaptic properties at developing glutamatergic synapses. Glia 67: 53–67 - PubMed
-
- Baudry M, Massicotte G, Hauge S (1991) Phosphatidylserine increases the affinity of the AMPA/quisqualate receptor in rat brain membranes. Behav Neural Biol 55: 137–140 - PubMed
-
- Berg S, Kutra D, Kroeger T, Straehle CN, Kausler BX, Haubold C, Schiegg M, Ales J, Beier T, Rudy M et al (2019) ilastik: interactive machine learning for (bio)image analysis. Nat Methods 16: 1226–1232 - PubMed
-
- Brown GC, Neher JJ (2014) Microglial phagocytosis of live neurons. Nat Rev Neurosci 15: 209–216 - PubMed
Publication types
MeSH terms
Substances
Grants and funding
LinkOut - more resources
Full Text Sources
Other Literature Sources
Molecular Biology Databases
Miscellaneous
