. 2020 Jul 13:9:e55232.
doi: 10.7554/eLife.55232.

Umbilical cord blood-derived ILC1-like cells constitute a novel precursor for mature KIR+NKG2A- NK cells

Affiliations

Umbilical cord blood-derived ILC1-like cells constitute a novel precursor for mature KIR+NKG2A- NK cells

Sabrina Bianca Bennstein et al. Elife. .

Abstract

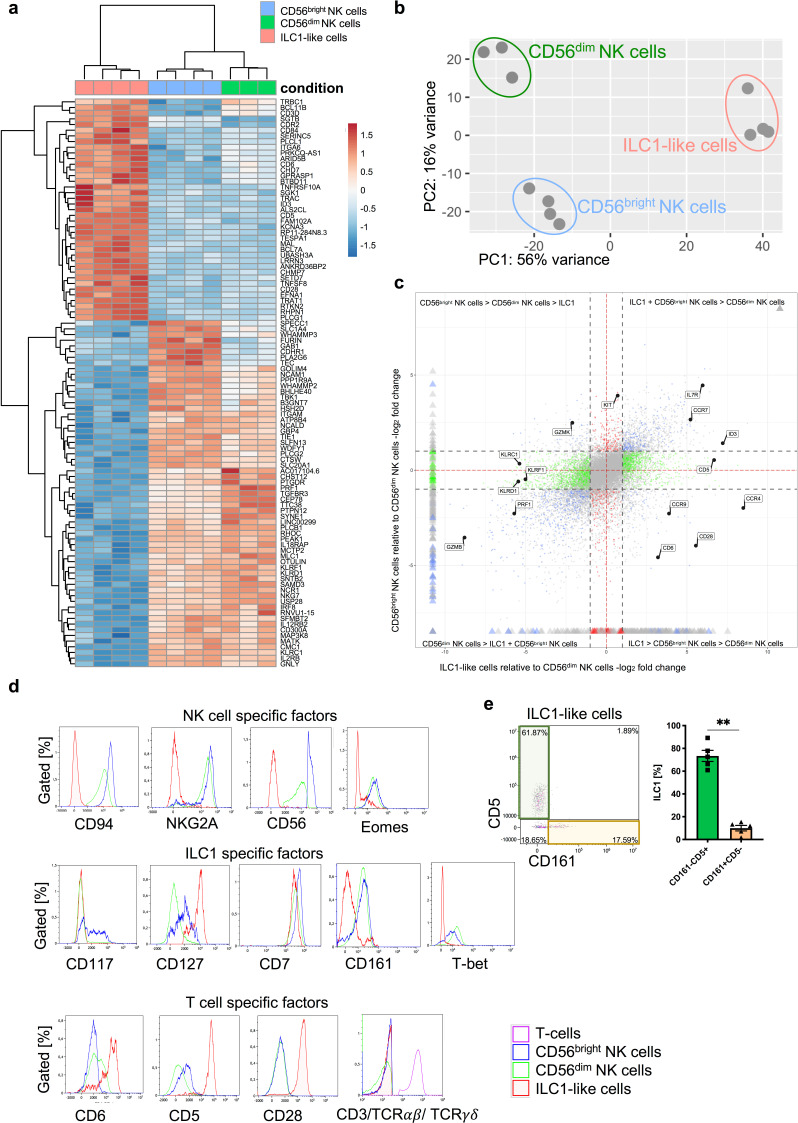
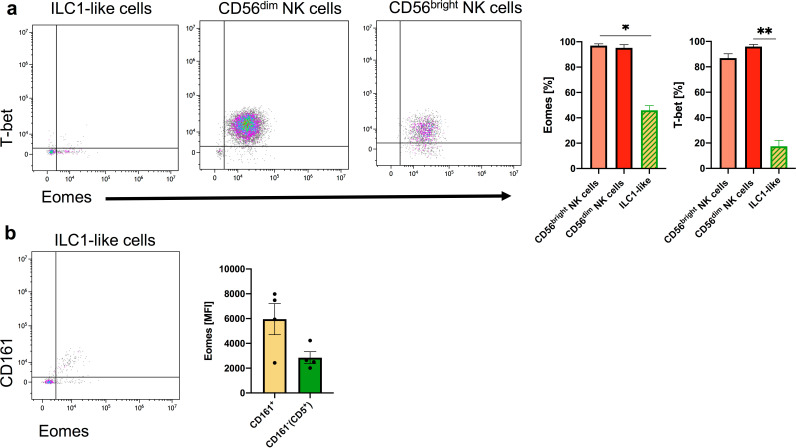
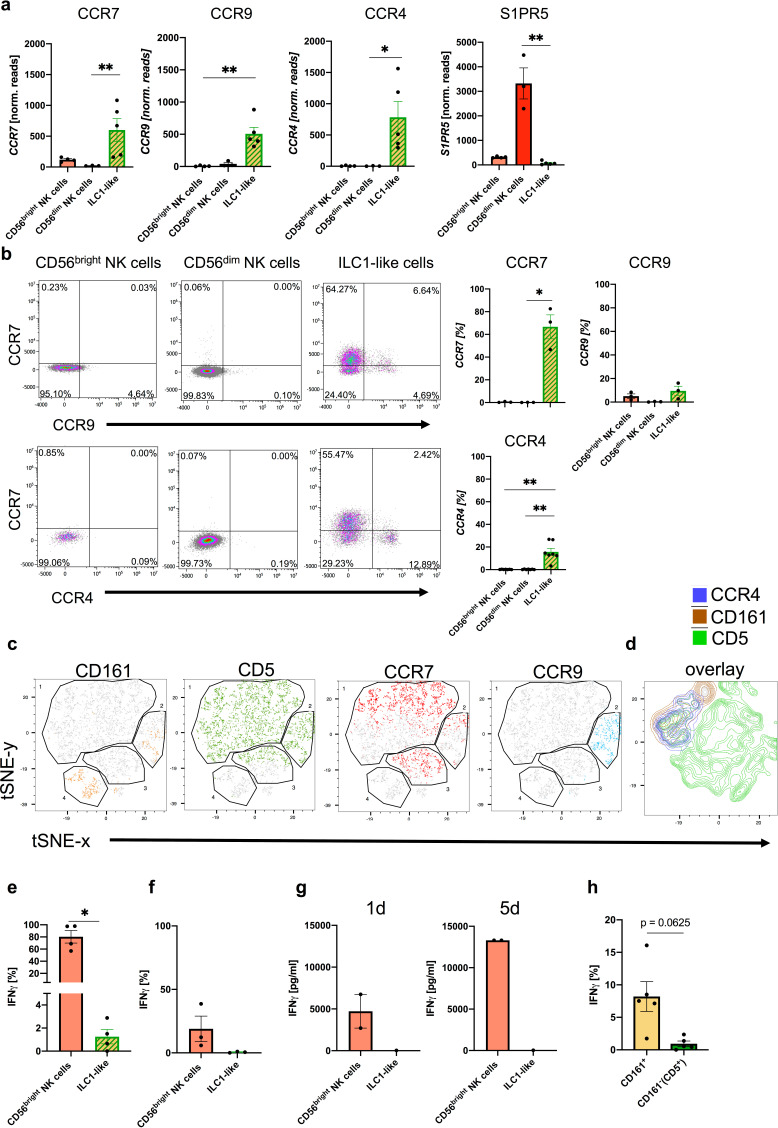
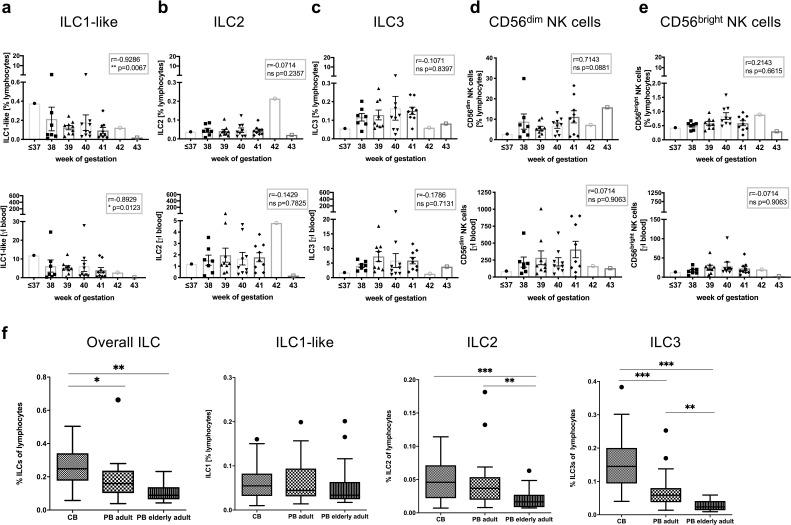
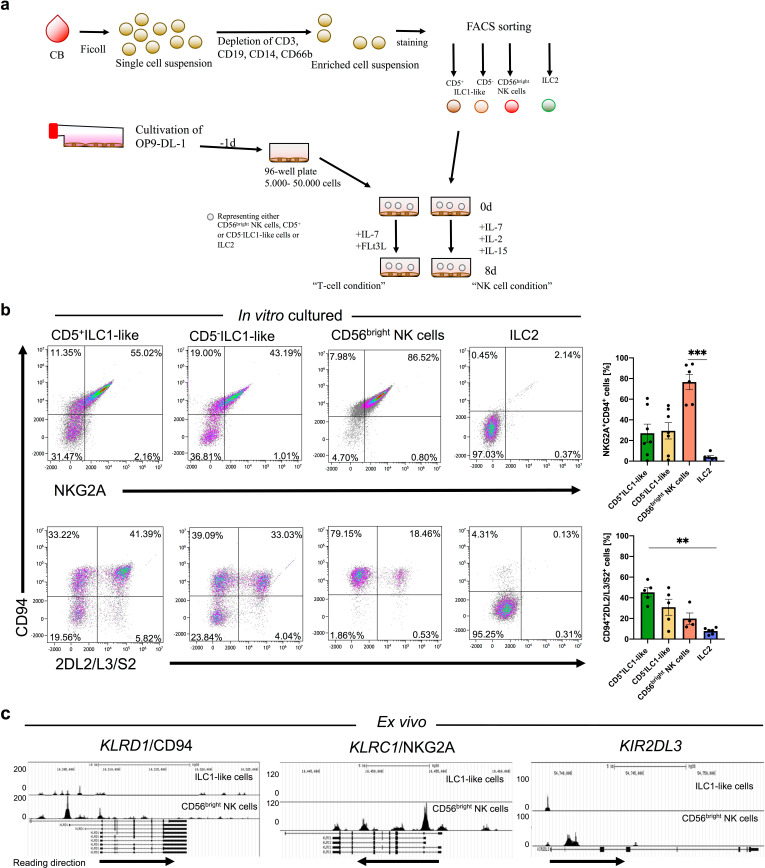
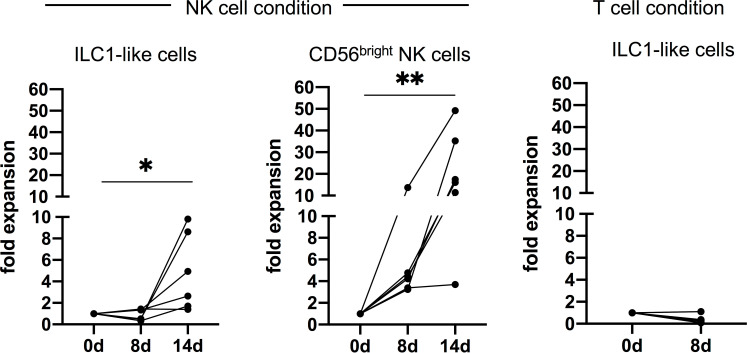
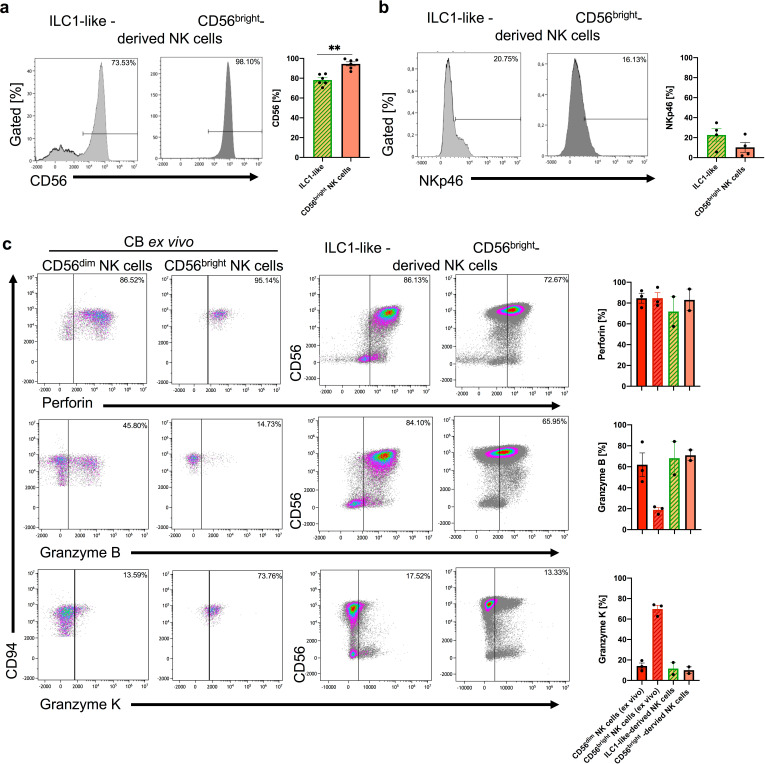
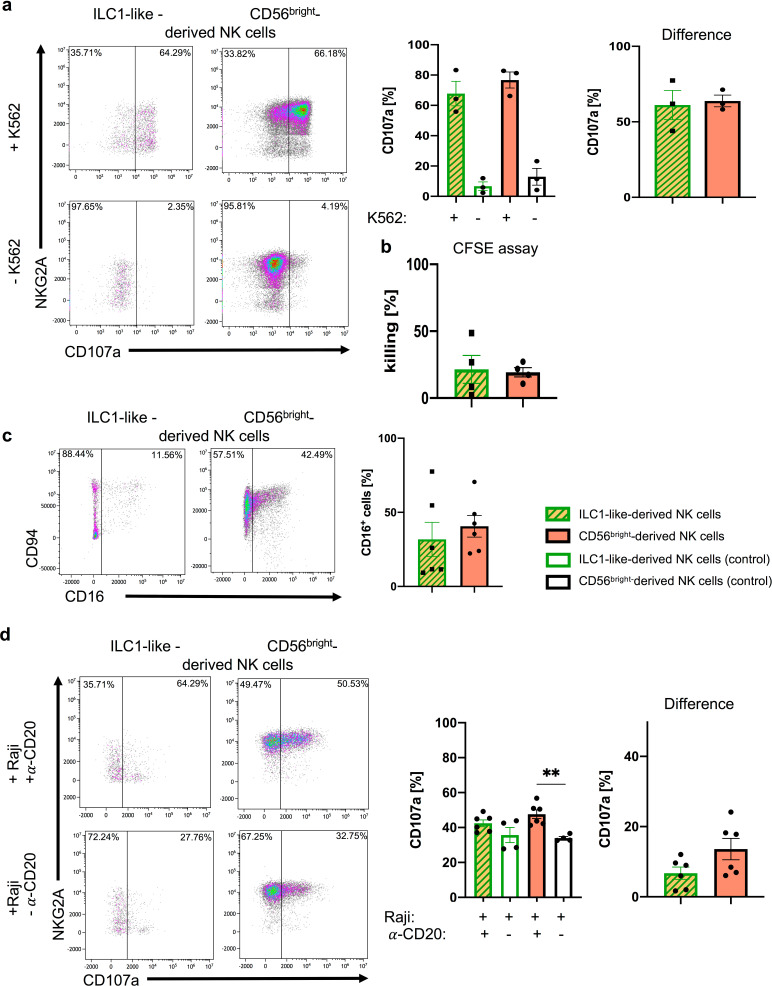
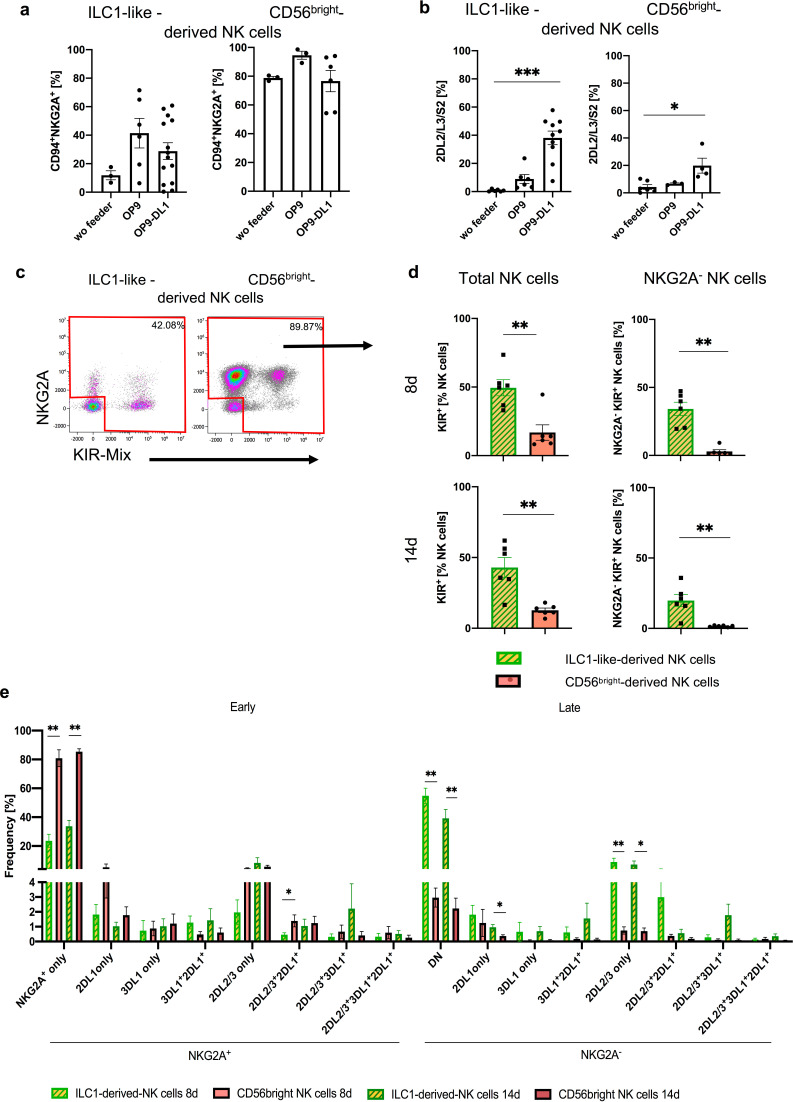
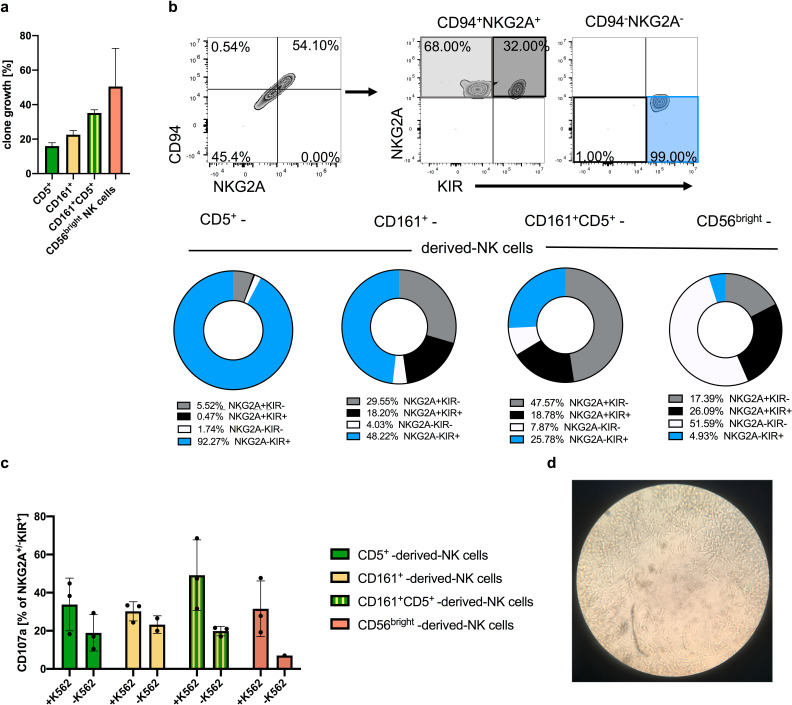
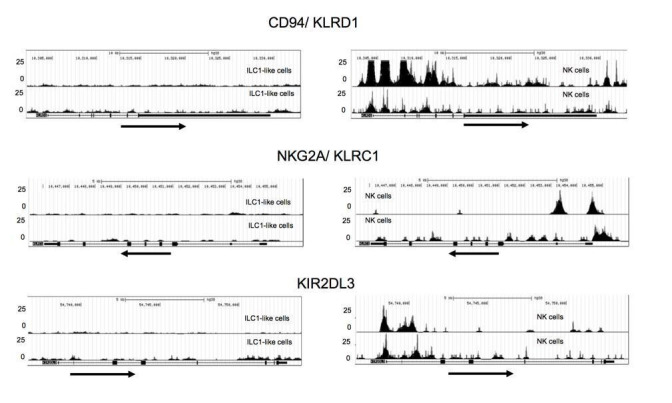
Despite their identification several years ago, molecular identity and developmental relation between human ILC1 and NK cells, comprising group 1 ILCs, is still elusive. To unravel their connection, thorough transcriptional, epigenetic, and functional characterization was performed from umbilical cord blood (CB). Unexpectedly, ILC1-like cells lacked Tbet expression and failed to produce IFNγ. Moreover, in contrast to previously described ILC1 subsets they could be efficiently differentiated into NK cells. These were characterized by highly diversified KIR repertoires including late stage NKG2A-KIR+ effector cells that are commonly not generated from previously known NK cell progenitor sources. This property was dependent on stroma cell-derived Notch ligands. The frequency of the novel ILC1-like NK cell progenitor (NKP) significantly declined in CB from early to late gestational age. The study supports a model in which circulating fetal ILC1-like NKPs travel to secondary lymphoid tissues to initiate the formation of diversified NK cell repertoires after birth.

Keywords: ILC1; Innate lymphoid cells; KIR; NK cells; human; immunology; inflammation; neonatal.


Conflict of interest statement

SB, SW, AM, NS, AN, KR, GK, LW, MU No competing interests declared

Figures

Figure 1.
Figure 1.. ILC1-like cells have a unique gene signature distinct from NK cells.
(a) CB mononuclear cells (MNCs) were enriched prior to sorting via biotin-labelled antibodies (anti-CD3/CD19/CD14/CD66b) and sorted for ILC1-like cells, CD56dim, and CD56bright NK cells (see Figure 1—figure supplement 1 for sorting strategy). RNA sequencing was done on the Illumina platform. The heat map indicates the top 100 differentially expressed genes between ILC1-like cells and CD56bright NK cells including CD56dim NK cells. (b) A two-dimensional principle component analyses based on the top 2000 differentially transcribed genes of CD56bright NK cells, CD56dim NK cells, and ILC1-like cells is shown. (c) A four-way plot with a cut off at a log2 fold change ±1 (dotted lines) and adjusted p-values of 0.05 showing differently expressed genes of CB CD56bright NK cells compared to CD56dim NK cells and ILC1-like cells. Blue dots represent genes with an adjusted p-value<0.05 with a fold change >1. Green dots represent genes with an adjusted p-value <0.05 with a fold change between >1 (x-axis) and <1 (y-axis). Grey dots represent genes with an adjusted p-value >0.05. Red dots represent genes with an adjusted p-value<0.05 with fold rates < 1 (x-axis) and >1 (y-axis). Selected genes differentially expressed between NK cells subsets and ILC1-like cells are highlighted. (d) CB MNCs (n = 3) gated on ILC1-like cells, CD56bright NK cells, and CD56dim NK cells, respectively were analyzed by flow cytometry for selected NK, T, and ILC markers. Representative histograms for NK cell-specific factors containing CD94, NKG2A, CD56, and EOMES (upper panel), ILC1-specific factors containing CD117, CD127, CD7, CD161, and TBET (middle panel), and T cell-specific factors CD6, CD5, CD28, as well as a Mix of CD3/TCRαβ/TCRγδ (bottom panel). (e) Representative dot plot of the expression of CD5 and CD161 within CB ILC1-like cells with representative quantification of CD5+ (green bar and box) and CD161+ (yellow bar and box), (n = 5). The height of the bar represents the mean ± SEM. Levels of significance were calculated with a non-parametric t test (Mann-Whitney), ** p-value <0.01. Data represent at least three different donors and experiments.
Figure 1—figure supplement 1.
Figure 1—figure supplement 1.. Exemplary gating strategy for ILC and NK cell sorting.
Before sorting, CB MNCs were depleted of unwanted cell populations (via biotinylated CD3, CD66b, CD14, CD19 antibodies). (a) Lymphocytes were identified using the forward (FSC-H) and side scatter (SSC-H). (b) Doublets were excluded using the width side scatter (SSC-W). (c) Lineage (Lin) positive cells were excluded using CD127 and lineage panel mix in FITC. (d) The Lin- cells were further divided into NK cells and ILCs via CD94 (for NK cells) and CD127 (for ILCs) expression. (e) CD94+ NK cells are further separated into CD56bright and CD56dim NK cells via their different expression levels of CD56. (f) ILCs are separated into ILC1 (CD117-CRTH2-), ILC2 (CD117-/+CRTH2+), and ILC3 (CD117+CRTH2-) using CD117 and CRTH2 expression. Antibodies included in the Lin panel: anti-CD3, anti-CD14, anti-CD19, anti-CD34, anti-CD20, anti-BDCA-2, anti-TCRαβ, anti-TCRγδ, anti-CD1a, anti-CD123, anti-CD66b, anti-CD235a, anti-FcɛR1α.
Figure 1—figure supplement 2.
Figure 1—figure supplement 2.. CD161+ILC1-like cells and CD5+ILC1-like cells differ in their CD28 and CD6 expression.
CB MNCs were stained, gated on ILC1-like cells, and further gated on CD161+ILC1-like cells and CD5+ILC1-like cells. Representative dot plots and quantification of (a) CD28 and (b) CD6 expression in CD5+ and CD161+ ILC1-like cells. (c) Comparative analysis of regions with open chromatin by ATACseq for CD5 and KLRB1 (CD161). For ATAC sequencing, 5000 CB-derived ILC1-like (top row) and NK cells (bottom row) were flow cytometrically sorted to >99% purity (n = 3). Arrows underneath the ATAC data indicate orientation and start of gene transcription. The heights of the bars represent the mean ± SEM. Levels of significance were calculated with an unpaired t test (Mann Whitney U), * p-value <0.05, ** p-value_<0.005. Data points represent at least three individual donors and experiments(a/b). Data represent three individual donor and two experiments (c).
Figure 1—figure supplement 3.
Figure 1—figure supplement 3.. ILC1-like cells phenotypically similar to T cells.
(a) Representative dot plots of CD4 and CD8 expression of ILC1-like cells, CD56bright, and CD56dim NK cells with quantification of CD4 (left) and CD8 (right) (n = 5). (b) Representative dot plots and quantification of extracellular (top) and intracellular (bottom) CD3δ expression for ILC1-like cells, CD56bright NK cells, CD56dim NK cells, and T cells (gated on lymphocytes and CD3+TCRαβ as well as TCRγδ+, n = 3). (c and d) Representative dot plots and quantification of CD2 on (c) ILC1-like cells, CD56bright NK cells, and CD56dim NK cells as well as (d) respective ILC1-like subsets (n = 3). (e) Normalized read counts of the variable T cell receptor region TRAV (top) and TRBV (bottom) of ILC1-like cells (n = 4). Heights of the bars represent mean ± SEM. Levels of significance were calculated with a One-Way ANOVA with a multiple comparison post-test (Kruskal-Wallis test), * p-value<0.05, ** p-value<0.01. Data represent at least three different donors.
Figure 1—figure supplement 4.
Figure 1—figure supplement 4.. Weak expression of EOMES and TBET in ILC1-like cells.
CB MNCs were stained and gated on ILC1-like cells, CD56bright NK cells, and CD56dim NK cells (see Figure 1—figure supplement 1). (a) Representative dot plots and quantification for the intranuclear expression of EOMES and TBET for CB ILC1-like cells, CD56bright NK cells, and CD56dim NK cells are shown (n = 4). (b) Representative dot plot for CD161 and EOMES expression of ILC1-like cells with quantification of the mean fluorescence intensity of (MFI) of EOMES on CD161+ILC1-like cells and CD161-ILC1-like cells. The heights of the bars represent the mean ± SEM. Levels of significance were calculated with a One-Way ANOVA with a multiple correction post-test (Kruskal-Wallis test). * p-value<0.05, ** p-value<0.01. Data represent at least three individual donors and experiments.
Figure 2.
Figure 2.. CD5+ and CD161+ ILC1-like subsets are distinguished by differential chemokine receptor expression and functionality.
(a) Expression of CCR7 (left corner), CCR9 (left middle), CCR4 (right middle), and S1PR5 (right corner) determined by RNA sequencing for CD56bright NK cells (n = 4), CD56dim NK cells (n = 3), and ILC1-like cells (n = 5). (b) Surface expression of chemokine receptors on CD56bright NK cells, CD56dim NK cells, and ILC1-like cells in ex vivo isolated MNC from CB. Representative dot plots and quantification of CCR7 and CCR9 (n = 3) or CCR7 and CCR4 (n = 7) is shown. (c and d) t-SNE plots for expression of CD161, CD5, CCR7, and CCR9 as well as an overlay of CD161, CD5, and CCR4 expression (rightmost panel) on ILC1-like cells (n = 3) calculated with 500 iterations (see Figure 1—figure supplement 1 for gating of ILC1-like cells). (e and f) Freshly isolated CB MNC were either stimulated with IL-12 (5 ng/ml) and IL-18 (50 ng/ml) overnight or with PMA/Ionomycin for 4 hr to measure intracellular expression (n = 5/3). (g) CB ILC1-like cells were sorted and stimulated with IL-12/IL-18. At day 1 and 5 supernatant was taken and analysed for IFNγ secretion (n = 1–2). (h) MNCs stimulated with IL-12/IL-18 were further gated on CD161- and CD161+ cells and IFNγ secretion was determined. The heights of the bars represent the mean ± SEM. Levels of significance were calculated with a One-Way ANOVA with a multiple correction post-test (Kruskal-Wallis test) (a and b), by a Mann-Whitney test (e–g) and Wilcoxon ranked test (h), * p-value<0.05, ** p-value<0.01, *** p-value<0.001. Data represent at least three different donors (a–f, h) as well as one to two donors (g) and two experiments.
Figure 3.
Figure 3.. Frequency and cell count of ILC1-like cells from CB inversely correlates with gestational age.
(a–e) Frequency (top panel) and cell count per μl blood (lower panel) of CB samples (n = 37) according to gestational age are shown from left to right for ILC1-like cells, ILC2, ILC3, CD56dim NK cells, and CD56bright NK cells. (f) Frequency of ILCs within lymphocytes from CB (n = 32), adult PB (n = 22, age 18–55 years), and elderly PB (n = 20, age 63–86) as Tukey box plots from left to right for total ILC (Lin-CD94-CD45+CD127+), ILC1-like cells (CD117-CRTH2-), ILC2 (CD117-/+CRTH2+), and ILC3 (CD117+CRTH2-). The heights of the bars represent the mean ± SEM. Levels of significance were calculated using a Spearman correlation (a–e) and a Kruskal-Wallis test with a Mann-Whitney U post-test and Bonferroni corrected p-values for multiple testing (f), * p-value<0.05, ** p-value<0.01, *** p-value<0.001. Data represent at least three different donors and experiments.
Figure 4.
Figure 4.. ILC1-like cells possess high NKP potential without previous epigenetic priming for NK cell receptor expression.
(a) Scheme of the experimental set-up. CB MNCS were freshly isolated, enriched using biotinylated antibodies (anti-CD3, CD14, CD19, CD66b), and sorted for CD5+ILC1-like cells, CD5-ILC1-like cells, CD56bright NK cells, and ILC2. One day prior to sorting, OP9-DL1 cells were plated in 96-well flat-bottom plates. Cells were either supplemented with IL-7 and FLt3L for the T cell condition or IL-2, IL-7, and IL-15 for the NK cell condition and cultured for 8 days with medium change at day 5. (b) Exemplary dot plots and quantification of CD94 expression together with either NKG2A or KIR2DL2/L3/S2 expression after 8 days of co-culture on OP9-DL1 from left to right for CD5+ILC1-like cells (n = 7), CD5-ILC1-like cells (n = 7), CD56bright NK cells (n = 5), and ILC2 (n = 6). (c) Comparative analysis of regions with open chromatin by ATAC sequencing for KLRD1 (CD94), KLRC1 (NKG2A), and KIR2DL3. For ATAC sequencing, 5000 CB-derived ILC1-like (top row) and NK cells (bottom row) were flow cytometrically sorted to >99% purity (n = 3). Arrows underneath the ATAC data indicate orientation and start of gene transcription. Heights of the bars represent mean ± SEM. Levels of significance were calculated with a One-Way ANOVA with a multiple comparison post-test (Kruskal-Wallis test), * p-value<0.05, ** p-value<0.01, *** p-value<0.001. Data represent at least three different donors and experiments (a–b). Data represent two experiments with three donors (c).
Figure 4—figure supplement 1.
Figure 4—figure supplement 1.. ILC-1-like cells proliferate in NK cell but not T cell conditions.
Expansion of ILC1-like cells (left) and CD56bright NK cells (middle) in NK cell conditions and expansion of ILC1-like cells in T cell conditions (right). Dots represent the individual fold change calculated by dividing the cell count at day 8 or 14 by the initial cell count (n = 6 for NK condition, n = 4 for T cell condition). * p-value<0.05, ** p-value<0.01. Data points represent at least three different donors and experiments.
Figure 4—figure supplement 2.
Figure 4—figure supplement 2.. ILC1-like-derived NK cells express essential NK cell characteristics: CD56, NKp46, Perforin, and Granzyme B.
Representative dot plots of CD117 and (a) CD56 as well as (b) NKp46 expression of ILC1-like- and CD56bright-derived NK cells at day 14 of culture with respective quantification of CD56 (n = 6) or NKp46 (n = 4). (c) Representative dot plots of intracellular staining for Perforin, Granzyme B, and Granzyme K against CD94 for ex vivo CB CD56dim NK cells and CD56bright NK cells (two dot plots, left hand side, n = 3) and against CD56 for in vitro generated ILC1-like- and CD56bright-derived NK cells with quantifications (two dot plots, right hand side, n = 2). The experiments were done in parallel for optimal comparison. The height of the bars represents the mean ± SEM. The results represent one (c), two (b) and three (a) individual experiments with two (data of b/c in vitro cultures), three (ex vivo CBs), and six (a) different donors.
Figure 5.
Figure 5.. ILC1-like NKPs develop into effector NK cells.
After 15 days of co-cultivation on OP9-DL1 stromal cells, NK cells derived from ILC1-like cells or CD56bright NK cells from CB were used in (a) granule mobilization (n = 3) and (b) cytotoxicity assays (n = 4) against the HLA-deficient cell line K562 at an effector/target ratio of 1:1. For CD107a quantification (a/d), analysis gates were set on cells expressing NKG2A and/or KIR. (a) Representative dot plots are shown for CD107a vs. NKG2A expression of NK cells derived from ILC1-like (left) or CD56bright NK cells (right) with K562 (top) and without K562 (bottom). Corresponding CD107a frequencies are shown as bar graphs with controls (left) and target-specific degranulation (right, calculated by subtracting spontaneous degranulation from degranulation with target cells) (n = 3). (c) Representative dot plots for CD94 and CD16 expression are shown for NK cells derived from ILC1-like cells (left) or CD56bright NK cells (right). Corresponding CD16 frequencies are shown as bar graphs (n = 6). (d) An ADCC assay was performed with CD20+ Raji cells and Rituximab (anti-CD20) in an effector target ratio of 1:1. Exemplary dot plots for NKG2A vs. CD107a expression is shown for ILC1-like-derived NK cells (left) and CD56bright-derived NK cells (right) cultured for 5 hr with Raji and Rituximab (top) or without Rituximab (bottom). Quantification of CD107a expression is shown for ILC1-like-derived NK cells and CD56bright-derived NK cells with controls (left) and target-specific degranulation (right, calculated by subtracting degranulation without Rituximab from degranulation with Rituximab) (n = 4–6). Height of bars represent mean ± SEM. Levels of significance were calculated with a non-parametric two-tailed t test (Mann Whitney) and a One-Way ANOVA. Data points represent at least three different donors from at least two independent experiments (a–c) and one experiment with two different donors (d).
Figure 6.
Figure 6.. Differentiation of ILC1-like NKP lead to formation of complex NK cell repertoires via NOTCH signaling.
CB-derived ILC1-like cells and CD56bright NK cells were flow cytometrically sorted and subsequently cultured for 8 days on OP9, OP9-DL1, or without feeder cells (a, b) or cultured on OP9-DL1 for 8 and 14 days (c–e). (a) Frequency of CD94+NKG2A+ (n = 3–13) and (b) KIR2DL2/L3/S2+ NK cells (n = 3–9). (c) Representative dot plots for NKG2A and KIR (comprising antibodies against KIR2DL2/L3/S2, KIR2DL1/S1/S3/S5, and KIR3DL1) of ILC1-like-derived NK cells (left hand side) and CD56bright-derived NK cells (right hand side). (d) Frequency of total KIR+ (left hand side) and KIR+NKG2A- (right hand side) NK cells derived from ILC1-like cells and CD56bright NK cells, respectively (n = 6) on day 8 (top) and day 14 (bottom). (e) Dissection of NK cell repertoire diversity of NK cells derived from ILC1-like cells and CD56bright NK cells, respectively by combinatorial analysis of the major inhibitory receptors KIR2DL1, KIR2DL2, KIR2DL3, KIR3DL1, and NKG2A at day 8 and 14 (n = 5–6, one donor missing KIR3DL1). DN refers to NKG2A-KIR- NK cells. Color coding: ILC1-like-derived NK cells (day 8: light green and yellow, day 14: dark green with yellow) and CD56bright-derived NK cells (day 8, light red, day 14 dark red). Height of the bars represent mean ± SEM. Levels of significance were calculated with a One-Way ANOVA with a multiple comparison post-test (Kruskal-Wallis test) (a, b) and an unpaired t test (Mann Whitney U) comparing both populations at the same time point. Data represent at least three independent experiments with each dot representing an individual donor (see Figure 6—figure supplement 1 for individual KIR/NKG2A expression), * p-value<0.05, ** p-value<0.01, *** p-value<0.001.
Figure 6—figure supplement 1.
Figure 6—figure supplement 1.. Individual NK cell receptor repertoires after 8 and 14 days of co-culture on OP9-DL1.
(a–d) Individual NK cell receptor repertoires encompassing NKG2A, KIR2DL1, KIR2DL2, KIR2DL3, and KIR3DL1 receptors after 8 and 14 days of OP9-DL1 co-culture, respectively from ILC1-like- and CD56bright-derived NK cells for the same 6 CB donors shown in Figure 7 and Figure 4—figure supplement 1. Of note, CB donor 1 does not have an 3DL1 allele. Data points represent individual donors from at least three experiments.
Figure 6—figure supplement 2.
Figure 6—figure supplement 2.. ILC1-like cells from PB have NKP potential.
Bulk sorted PB ILC1-like cells and CD56bright NK cells were cultured for 14d on OP9-DL1 in similar conditions as used for CB (see Figure 5A). (a) Expansion of NK cells differentiated from PB-derived ILC1-like cells and CD56bright NK cells, respectively. Exemplary density plots and frequencies of expanded NK cells are shown for (b) CD94 and NKG2A and (c) NKG2A and KIR2DL2/L3/S2, derived from PB ILC1-like cells and PB CD56bright NK cells, respectively. (d) Pie charts displaying the combinatorial expression of NKG2A and KIR2DL2/L3/S2 with the respective frequencies indicated below. The heights of the bars represent the mean ± SEM. Levels of significance were calculated by a Mann- Whitney test, (n = 4). * p-value<0.05. Data represent four different donors from two individual experiments.
Figure 7.
Figure 7.. Clonal analyses of ILC1-like cells reveal high frequency of NKPs developing into cytotoxic KIR+NKG2A- NK cells.
Single cells from the four ILC1-like subsets CD5+, CD161+, and CD161+CD5+ were flow cytometrically deposited in 96 well plates for clonal differentiation cultures on OP9-DL1 stroma cells. (a) Efficiency of clone growth at day 14. (b) Exemplary gating strategy for in vitro differentiated clones at day 28: CD94+NKG2A+ cells as well as CD94-NKG2A- cells were further divided on the basis of their respective NKG2A and KIR expression (upper panel). Pie charts and corresponding frequency of clones for the four different subsets (bottom panel): NKG2A+KIR- (grey), NKG2A+KIR+ (black), NKG2A-KIR- (white), and NKG2A-KIR+(blue) (n = 20 for all ILC1-like subsets, n = 4 for CD56bright NK cells). (c) Quantification of CD107a cytotoxic mobilization assay with K562 cells in an effector/target ratio of 1:1 from single cell cultures (n = 3). (d) Representative microscopic picture from single cell culture exhibiting erasure of feeder cells by developing NK cells in the central region of the well. The heights of the bars represent the mean ± SEM. Levels of significance were calculated with a One-Way ANOVA with a multiple correction post-test (Kruskal-Wallis test). Data were generated from 288 CD5+ and CD161+ cells each, 177 CD5+CD161+ cells, and 12 CD56bright NK cells sorted from a single donor.
Author response image 1.
Author response image 1.. Additional ATACseq data.
Comparative analysis of regions with open chromatin by ATAC sequencing for KLRD1 (CD94), KLRC1 (NKG2A), and KIR2DL3. For ATAC sequencing, 5000 ILC1-like (left) and NK cells (right) were flow cytometrically sorted to >99% purity. Arrows underneath the ATAC data indicate orientation and start of gene transcription.

References

    1. Adey A, Morrison HG, Asan, Xun X, Kitzman JO, Turner EH, Stackhouse B, MacKenzie AP, Caruccio NC, Zhang X, Shendure J. Rapid, low-input, low-bias construction of shotgun fragment libraries by high-density in vitro transposition. Genome Biology. 2010;11:R119. doi: 10.1186/gb-2010-11-12-r119. - DOI - PMC - PubMed
    1. Bernink JH, Peters CP, Munneke M, te Velde AA, Meijer SL, Weijer K, Hreggvidsdottir HS, Heinsbroek SE, Legrand N, Buskens CJ, Bemelman WA, Mjösberg JM, Spits H. Human type 1 innate lymphoid cells accumulate in inflamed mucosal tissues. Nature Immunology. 2013;14:221–229. doi: 10.1038/ni.2534. - DOI - PubMed
    1. Bianca Bennstein S, Riccarda Manser A, Weinhold S, Scherenschlich N, Uhrberg M. Omip‐055: characterization of human innate lymphoid cells from neonatal and peripheral blood. Cytometry Part A. 2019;95:427–430. doi: 10.1002/cyto.a.23741. - DOI - PubMed
    1. Björklund ÅK, Forkel M, Picelli S, Konya V, Theorell J, Friberg D, Sandberg R, Mjösberg J. The heterogeneity of human CD127(+) innate lymphoid cells revealed by single-cell RNA sequencing. Nature Immunology. 2016;17:451–460. doi: 10.1038/ni.3368. - DOI - PubMed
    1. Cella M, Gamini R, Sécca C, Collins PL, Zhao S, Peng V, Robinette ML, Schettini J, Zaitsev K, Gordon W, Bando JK, Yomogida K, Cortez V, Fronick C, Fulton R, Lin LL, Gilfillan S, Flavell RA, Shan L, Artyomov MN, Bowman M, Oltz EM, Jelinsky SA, Colonna M. Subsets of ILC3-ILC1-like cells generate a diversity spectrum of innate lymphoid cells in human mucosal tissues. Nature Immunology. 2019;20:980–991. doi: 10.1038/s41590-019-0425-y. - DOI - PMC - PubMed

Publication types