. 2020 Oct 5;217(10):e20200359.
doi: 10.1084/jem.20200359.

FcRn is a CD32a coreceptor that determines susceptibility to IgG immune complex-driven autoimmunity

Affiliations

FcRn is a CD32a coreceptor that determines susceptibility to IgG immune complex-driven autoimmunity

Jonathan J Hubbard et al. J Exp Med. .

Abstract

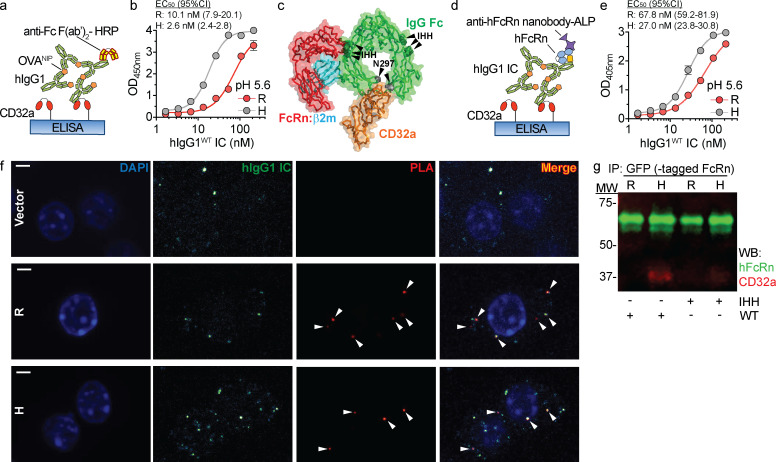
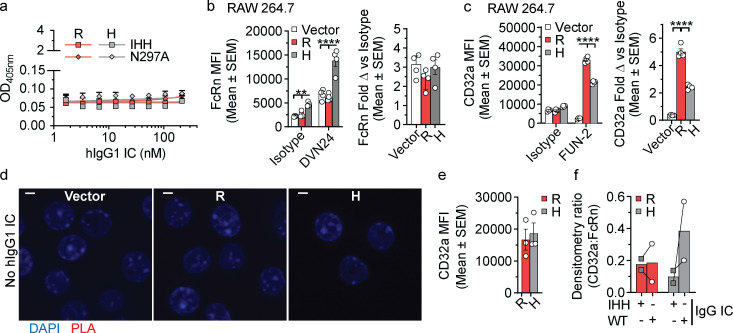
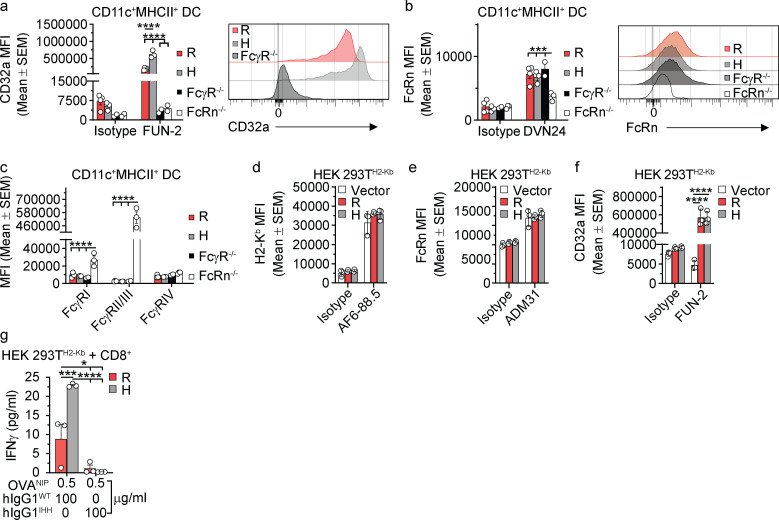
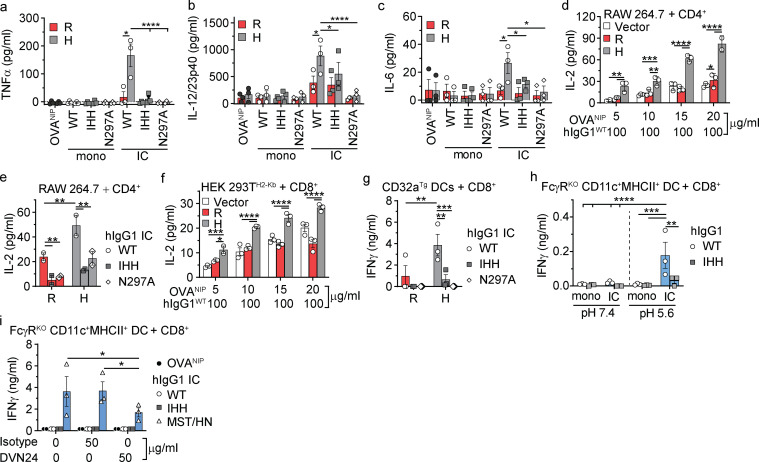
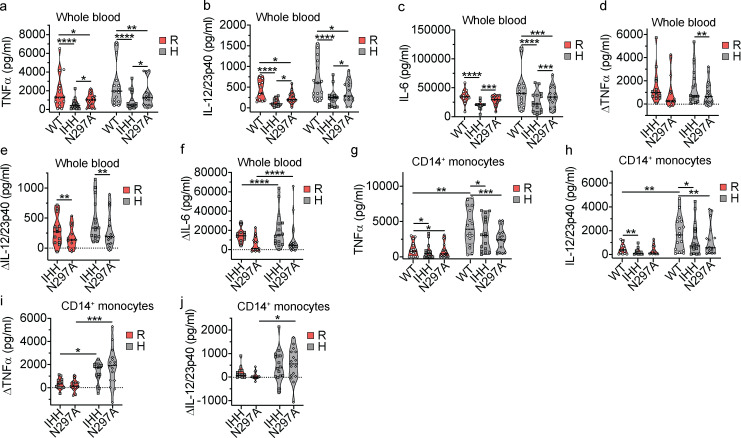
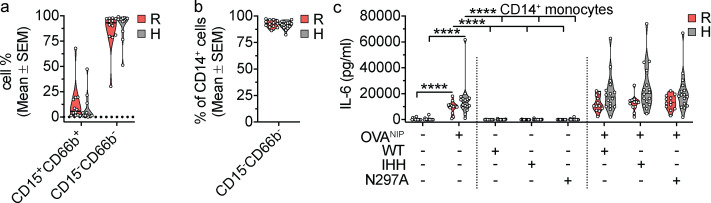
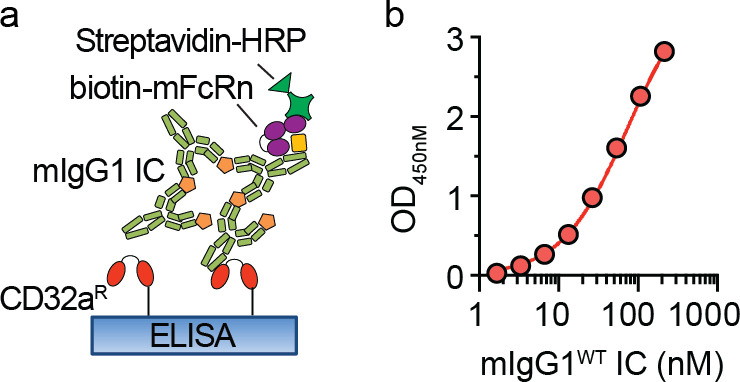
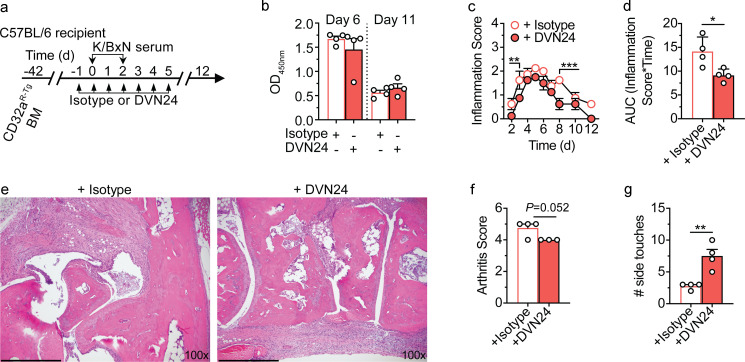
IgG immune complexes (ICs) promote autoimmunity through binding fragment crystallizable (Fc) γ-receptors (FcγRs). Of these, the highly prevalent FcγRIIa (CD32a) histidine (H)-131 variant (CD32aH) is strongly linked to human autoimmune diseases through unclear mechanisms. We show that, relative to the CD32a arginine (R)-131 (CD32aR) variant, CD32aH more avidly bound human (h) IgG1 IC and formed a ternary complex with the neonatal Fc receptor (FcRn) under acidic conditions. In primary human and mouse cells, both CD32a variants required FcRn to induce innate and adaptive immune responses to hIgG1 ICs, which were augmented in the setting of CD32aH. Conversely, FcRn induced responses to IgG IC independently of classical FcγR, but optimal responses required FcRn and FcγR. Finally, FcRn blockade decreased inflammation in a rheumatoid arthritis model without reducing circulating autoantibody levels, providing support for FcRn's direct role in IgG IC-associated inflammation. Thus, CD32a and FcRn coregulate IgG IC-mediated immunity in a manner favoring the CD32aH variant, providing a novel mechanism for its disease association.


Conflict of interest statement

Disclosures: J.J. Hubbard reported a patent to US2019/017880 pending. M. Pyzik reported a patent to PCT/US2019/017880 pending, "Brigham and Women's Hospital." T. Rath reported a patent to 61/984,652 licensed and a patent to 61/909,229 licensed. A.K. Gandhi reported a patent for therapeutic FcRn-based bispecific monoclonal antibodies pending (PCT/US2019/107880). D.C. Roopenian reported a patent to US20190135915A1 licensed, "Alexion Pharmaceuticals"; and served as consultant with equity interests in Syntimmune Inc., a company developing therapeutic agents to target FcRn. Syntimmune is now a wholly owned subsidiary of Alexion Pharmaceuticals, Inc., following its acquisition by Alexion in November 2018. I. Sandlie has served as a consultant with equity interests in Syntimmune Inc., a company developing therapeutic agents to target FcRn. Syntimmune is now a wholly owned subsidiary of Alexion Pharmaceuticals, Inc., following its acquisition by Alexion in November 2018. K. Baker reported a patent to 61/984,652 issued and a patent to 61/909,229 issued. R.S. Blumberg served as consultant with equity interests in Syntimmune Inc., a company developing therapeutic agents to target FcRn. Syntimmune is now a wholly owned subsidiary of Alexion Pharmaceuticals, Inc., following its acquisition by Alexion in November 2018. In addition, R.S. Blumberg has a pending patent PCT/US2019/017880 to “BWH" and two patents licensed to "Alexion" (US2017/002073 and US2017/0045528). No other disclosures were reported.

Figures

Figure 1.
Figure 1.
CD32aH exhibits increased bridging with IgG IC and FcRn under acidic conditions. (a) Schematic representation of ELISA of hIgG1 ICs binding to CD32a variants. Neutravidin-immobilized C-terminal biotinylated CD32aR or CD32aH variants were exposed to titrated concentrations of hIgG1 ICs at pH 5.6. hIgG1WT and all derived mutants were monoclonal mouse/human chimeric IgG1, composed of hIgG1 heavy chain associated with murine λ light chain, both with NIP specificity. Bound ICs were detected with anti-Fc HRP-conjugated F(ab′)2 fragments. (b) Log of hIgG1WT IC concentration (1.67–214.3 nM) versus OD mean values ± SEM of triplicate technical replicates fitted with nonlinear regression curves are shown (solid line; R2 = 0.99; EC50 compared by extra sum-of-squares F test; P < 0.0001), representative of three independent experiments. (c) FcRn–hIgG1 IC–CD32a ternary complex structural model based on the superposition of the FcRn–hIgG1 Fc (PDB 4N0U) and CD32aR–hIgG1 Fc (PDB 3RY6) crystal structures with root mean square deviation of 1.378 Å. The binding sites on IgG Fc (green) for FcRn (red) and CD32a (orange) are between ∼39 and 53 Å apart on the ipsilateral and contralateral Fc heavy chain, respectively. The hIgG1 Fc residues critical for binding to FcRn (IHH; green spheres) and CD32a (N297; gray spheres) are indicated by black arrowheads. (d) Schematic representation of ELISA setup used to detect hIgG1 IC bridging between FcRn and CD32a. CD32aR or CD32aH variants were immobilized and incubated with hIgG1WT ICs as described in panel a, followed by incubation with soluble hFcRn. hFcRn was detected with anti-hFcRn-ALP–conjugated nanobody. (e) Log of hIgG1 IC concentration (1.67–214.3 nM) versus OD mean values ± SEM of triplicate technical replicates fitted with nonlinear regression curves are shown (solid line; R2 = 0.99; EC50 compared by extra sum-of-squares F test; P < 0.0001), representative of three independent experiments. (f) Confocal microscopic images of PLA performed between CD32a and FcRn, using PLA probes targeting the cytoplasmic tails of CD32a and mFcRn, respectively, in CD32aR (R)–, CD32aH (H)–, or vector control (Vector) plasmid–transfected RAW 264.7 cells treated with fluorescent hIgG1WT ICs. Amplification of adequately proximate PLA probe oligonucleotides that enabled hybridization of fluorescent complementary oligos were visualized at 63× magnification under glycerol immersion and are indicated by white arrowheads. Representative images are shown of nuclei (blue), hIgG1 ICs (green), and PLA signals (red) and merged images (red and yellow). Scale bars = 3 µm. (g) Representative multiplex immunoblot showing coimmunoprecipitation of CD32aR or CD32aH variants (red) with hFcRn (green) after treatment with hIgG1WT or hIgG1IHH ICs. Data are representative of two (f and g) or three (b and e) independent experiments. H, CD32aH; MW, molecular weight; R, CD32aR; Vector, control vector; IP, immunoprecipitation; WB, Western blot.
Figure S1.
Figure S1.
Ternary complex (FcRn–hIgG1 IC–CD32a) formation requires hIgG1WT ICs. (a) Log of hIgG1IHH or hIgG1N297A IC concentration (1.67–214.3 nM) versus OD values, with nonlinear regression curves (solid line; R2 = 0.99). This ELISA was performed in triplicate, concomitantly with and using a setup identical to the experiment reported in Fig. 1, d and e, except for the use of hIgG1IHH and hIgG1N297A mutant ICs, which display specifically abrogated binding to FcRn or classical FcγR (CD32a in this instance), respectively. (b and c) FcRn (b) or CD32a (c) expression by RAW 264.7 cells stably transfected with CD32aR (R)-, CD32aH (H)-, or vector control (Vector) plasmids. To detect CD32a, FUN-2 clone was used. To detect mFcRn, mAb DVN24 was employed. Bar graphs display average mean fluorescence intensity (MFI) ± SEM of four technical replicates. Data are shown without (left) and with (right) normalization to isotype IgG2a control antibody staining. (d) Confocal microscopic merged images of PLA control experiments in CD32a variant– or control vector–transfected RAW 264.7 cells as in Fig. 1 f, but without hIgG1 IC treatment. Representative images are shown of nuclei (blue). Note the absence of red PLA signals in the absence of IgG ICs, in contrast to Fig. 1 f. Scale bars = 3 µm. (e) CD32a expression on transfected HEK 293GFP-hFcRn cells. Bar graphs display average MFI ± SEM of three technical replicates. (f) Cumulative CD32a/FcRn densitometry ratio of multiplex immunoblot shown in Fig. 1 g. Bar graphs show mean of two independent experiments; no statistical comparison was performed. Data are representative of two (d–f), or three (a–c) independent experiments. H, CD32aH; R = CD32aR; Vector, control vector. Statistical comparisons were performed via unpaired t test for two comparisons (e) or two-way ANOVA for three or more comparisons (a–c) followed by the two-stage linear step-up procedure of Benjamin, Krieger, and Yekutieli with FDR <0.05 (a–c). **, P < 0.01; ****, P < 0.0001.
Figure S2.
Figure S2.
Increased CD32aH-associated presentation and cross-presentation is codependent on FcRn and CD32a. (a–c) CD32a (a), mFcRn (b), and classical FcγR (c) surface expression by primary splenic CD11c+MCHII+ DCs from CD32aR-Tg (R; red), CD32aH-Tg (H; gray), FcγR−/− (black), and mFcRn−/− (white) mice (n = 3). Bar graphs representing the average MFI ± SEM, and representative histograms (right for a and b) are shown. The Fcgrt−/− mice (n = 3) served as negative and positive controls for mFcRn and classical FcγR staining, respectively. (d–f) H2-Kb (d), hFcRn (e), and CD32a (f) surface expression on CD32aR- or CD32aH- or vector control plasmid–transfected HEK 293TH2-Kb cells. For panels d–f, bar graphs display average MFI ± SEM in triplicate. (g) IFN-γ production by CD8+ OT-I T cells after 48 h of co-culture with HEK 293TH2-Kb cells expressing CD32aR or CD32aH and loaded with hIgG1WT ICs or hIgG1IHH ICs. Data are representative of two or three (a–g) independent experiments with individual points representing triplicate technical replicates. H, CD32aH; R, CD32aR; Vector, control vector. All data were analyzed by two-way ANOVA followed by the two-stage linear step-up procedure of Benjamin, Krieger, and Yekutieli with FDR controlled at <0.05. *, P < 0.05; ***, P < 0.001; ****, P < 0.0001.
Figure 2.
Figure 2.
FcRn regulates CD32a-induced responses to IgG IC. (a–c) Absolute TNF-α (a), IL-12/23p40 (b), and IL-6 (c) production by primary splenic CD11c+MHCII+ DCs from CD32aR-Tg (R) or CD32aH-Tg (H) mice after 24 h of exposure to antigen (OVANIP) alone (1 µg/ml) or 100 µg/ml anti-NIP hIgG1WT (WT), hIgG1IHH (IHH), or hIgG1N297A (N297A) in monomeric (mono) or OVANIP-IC form. Black-filled circles, OVANIP; white-filled circles, monomeric or hIgG1WT ICs; gray-filled squares, monomeric or hIgG1IHH ICs; white-filled diamonds, monomeric or hIgG1N297A ICs. (d and e) IL-2 production by MHCII-restricted, OVA-specific CD4+ T cells after 24 h of co-culture with CD32aR- or CD32aH- or vector control plasmid–transfected RAW 264.7 cells that were treated with hIgG1WT ICs prepared with increasing concentrations of OVANIP (d) or treated with hIgG1 ICs composed of hIgG1WT, hIgG1IHH, or hIgG1N297A mutants and 10 µg/ml OVANIP (e). (f) IL-2 production by OVA-specific CD8+ OT-I T cells after 48 h of co-culture with CD32aR- or CD32aH- or vector control plasmid–transfected HEK 293H2-Kb cells loaded with OVANIP-containing hIgG1WT ICs as in Fig. 1 d. (g) IFN-γ production by CD8+ OT-I T cells after 48 h of co-culture with primary CD11c+MHCII+ CD32aR-Tg or CD32aH-Tg DCs loaded with hIgG1WT ICs, hIgG1IHH ICs, or hIgG1N297A ICs. (h and i) IFN-γ production by CD8+ OT-I T cells co-cultured for 48 h with CD11c+MHCII+ FcγRKO DCs loaded with hIgG1WT ICs or hIgG1IHH ICs at pH 7.4 or pH 5.6 (h) or pretreated with an isotype IgG2a control antibody or anti-m/hFcRn mAb DVN24 for 30 min before treatment with OVANIP only, or hIgG1WT, hIgG1IHH, or hIgG1MST/HN ICs (white-filled triangles) at pH 7.4 (i). All data represent arithmetic mean ± SEM of duplicate or triplicate technical replicates from three independent experiments (a–c), or are representative of three independent experiments (d–i), with triplicate technical replicates shown. All data were analyzed by two-way ANOVA followed by the two-stage linear step-up procedure of Benjamin, Krieger, and Yekutieli with FDR controlled at <0.05. *, P < 0.05; **, P < 0.01; ***, P < 0.001; ****, P < 0.0001.
Figure 3.
Figure 3.
CD32aH expression confers higher FcRn-dependent innate immune responses to IgG1 IC in human leukocytes. (a–c) Absolute TNF-α (a), IL-12/23p40 (b), and IL-6 (c) cytokine production by human whole blood collected from healthy volunteer human subjects, homozygous for FCGR2AG/G (CD32aR = R; n = 13) or FCGR2AA/A (CD32aH = H; n = 16), after 24 h of stimulation with hIgG1WT ICs, hIgG1IHH ICs, or hIgG1N297A ICs. (d–f) Relative TNF-α (d), IL-12/23p40 (e), and IL-6 (f) cytokine production calculated as differences (Δ) between hIgG1WT IC- and either hIgG1IHH IC- or hIgG1N297A IC-treated whole blood, respectively. (g and h) Absolute TNF-α (g) and IL-12/23p40 (h) production by CD14+ monocytes isolated from whole blood from the same healthy human donors and treated as in panels a–c. (i and j) Relative TNF-α (i) and IL-12/23p40 (j) production differences (Δ) between hIgG1WT IC- and either hIgG1IHH IC- or hIgG1N297A IC-treated CD14+ monocytes, respectively, are shown for panels g and h. Individual points in panels a–j represent the mean of two technical replicates of cellular responses to hIgG1 IC stimulation for each individual donor on one occasion, and groups of values for each genotype and treatment condition are presented as violin plots, with dashes indicating group arithmetic means. White filled circles, hIgG1WT ICs; gray filled squares, hIgG1IHH ICs; white filled diamonds, hIgG1N297A ICs. Statistical analysis of absolute cytokine production (a–c, g, and h) in response to hIgG1WT ICs between R and H was performed by unpaired two-tailed Mann–Whitney test and by matched Friedman test for comparison of hIgG1WT ICs, hIgG1IHH ICs, and hIgG1N297A ICs within each genotype. The relative (Δ) cytokine production for panels d–f and i were compared by two-way ANOVA of loge-transformed values. All multiple comparison tests (a–i) underwent post-hoc analysis by the two-stage linear step-up procedure of Benjamin, Krieger, and Yekutieli with FDR controlled at <0.05. Change in CD14+ monocyte production of IL-12/23p40 (j) were non-Gaussian when transformed and therefore were compared by unpaired Mann–Whitney testing. *, P < 0.05; **, P < 0.01; ***, P < 0.001; ****, P < 0.0001.
Figure S3.
Figure S3.
Assessment of CD14+ monocyte phenotype and responses to OVANIP. (a) Frequency of live CD15+CD66b+ (granulocytes) and CD15CD66b (nongranulocytes) from healthy human volunteers homozygous for CD32aR or CD32aH, separated from heparinized whole blood by Mono-Poly density gradient, and enriched for CD14+ cells by immunomagnetic cell separation. (b) Frequency of live CD14+ cells (monocytes) within the CD15CD66b cell fraction. (c) Absolute IL-6 cytokine production by human CD14+ monocytes untreated or upon stimulation with OVANIP alone, monomeric hIgG1 controls, or OVANIP-containing hIgG1WT ICs, hIgG1IHH ICs, or hIgG1N297A ICs. Individual points represent the mean of two technical replicates of cellular responses to hIgG1 IC stimulation for each individual donor on one occasion, and groups of values for each genotype and treatment condition are presented as violin plots, with dashes indicating group arithmetic means of individual mean values. All IL-6 levels resulting from treatment with OVANIP and IgG ICs were significantly different at P< 0.0001, from all monomeric IgG control conditions (hIgG1WT, hIgG1IHH, or hIgG1N297A alone); significance (*) symbols indicating this were omitted to minimize clutter. All data (a–c) were analyzed by two-way ANOVA of loge-transformed mean values of duplicate technical replicates, followed by the two-stage linear step-up procedure of Benjamin, Krieger, and Yekutieli with FDR controlled at <0.05. ****, P < 0.0001.
Figure S4.
Figure S4.
CD32aR forms ternary complexes with mFcRn and mIgG1 IC. (a) Schematic representation of bridging ELISA with mIgG1 ICs, mFcRn, and CD32aR. His-tagged CD32aR was directly immobilized to the ELISA plate followed by titration of mIgG1 IC concentrations at pH 5.6, the binding of which was detected by addition of biotinylated mFcRn prebound to streptavidin-HRP. (b) Log of mIgG1 IC concentrations (1.67–214.3 nM) versus OD (mean ± SEM of triplicate technical replicates), with nonlinear regression fit shown (solid line) with R2 = 0.99. Data are representative of three independent experiments.
Figure 4.
Figure 4.
FcRn blockade can ameliorate IC-mediated arthritis without increasing IgG clearance. (a) Schematic representation of K/BxN model of rheumatoid arthritis in CD32aR-Tg bone marrow chimeric mice. 6-wk-old male C57BL/6 mice were lethally irradiated and injected with sex-matched CD32aR-Tg bone marrow (BM) cells. 6 wk later, BM chimeric CD32aR-Tg mice were treated with 0.2 mg isotype IgG2a antibody or DVN24 daily (n = 4/group) for 5 d and administered K/BxN serum twice to induce arthritis. The mice were then monitored for 12 d and evaluated for disease progression and severity. (b) ELISA measurements (mean ± SEM of triplicate technical replicates) of total anti-GPI mIgG levels in serum for each mouse on days 6 and 11 following the initial K/BxN serum transfer. (c–g) Cumulative arthritis inflammation scores (c), displayed as area under the inflammation–time curve (AUC; d; mean ± SEM of individual mouse AUC) and ankle joint histopathology (e; day 12 representative images; scale bars = 400 µm), with blinded histopathologic scoring of inflammation (f; mean ± SEM of least three consecutive sections) for individual animals, and mobility measured on day 7 (g) as the number of cylinder side touches of individual mice in 1 min. Individual data points represent individual animals. To minimize clutter, mean ± SEM are shown in the inflammation score panel (c). Data shown are representative of two independent experiments. Analysis was by unpaired t test (d, f, and g) or two-way ANOVA (b and c), with the two-stage linear step-up procedure of Benjamin, Krieger, and Yekutieli with FDR <0.05, as appropriate. *, P < 0.05; **, P < 0.01; ***, P < 0.001.

References

    1. Andersen J.T., Gonzalez-Pajuelo M., Foss S., Landsverk O.J.B., Pinto D., Szyroki A., de Haard H.J., Saunders M., Vanlandschoot P., and Sandlie I.. 2013. Selection of nanobodies that target human neonatal Fc receptor. Sci. Rep. 3:1118 10.1038/srep01118 - DOI - PMC - PubMed
    1. Baker K., Qiao S.W., Kuo T.T., Aveson V.G., Platzer B., Andersen J.T., Sandlie I., Chen Z., de Haar C., Lencer W.I., et al. . 2011. Neonatal Fc receptor for IgG (FcRn) regulates cross-presentation of IgG immune complexes by CD8-CD11b+ dendritic cells. Proc. Natl. Acad. Sci. USA. 108:9927–9932. 10.1073/pnas.1019037108 - DOI - PMC - PubMed
    1. Baker K., Rath T., Flak M.B., Arthur J.C., Chen Z., Glickman J.N., Zlobec I., Karamitopoulou E., Stachler M.D., Odze R.D., et al. . 2013. Neonatal Fc receptor expression in dendritic cells mediates protective immunity against colorectal cancer. Immunity. 39:1095–1107. 10.1016/j.immuni.2013.11.003 - DOI - PMC - PubMed
    1. Blumberg L.J., Humphries J.E., Jones S.D., Pearce L.B., Holgate R., Hearn A., Cheung J., Mahmood A., Del Tito B., Graydon J.S., et al. . 2019. Blocking FcRn in humans reduces circulating IgG levels and inhibits IgG immune complex-mediated immune responses. Sci. Adv. 5:x9586 10.1126/sciadv.aax9586 - DOI - PMC - PubMed
    1. Bonnerot C., Briken V., Brachet V., Lankar D., Cassard S., Jabri B., and Amigorena S.. 1998. syk protein tyrosine kinase regulates Fc receptor gamma-chain-mediated transport to lysosomes. EMBO J. 17:4606–4616. 10.1093/emboj/17.16.4606 - DOI - PMC - PubMed

Publication types