

Systematic review with meta-analysis of the accuracy of diagnostic tests for COVID-19
- PMID: 32659413
- PMCID: PMC7350782
- DOI: 10.1016/j.ajic.2020.07.011
Systematic review with meta-analysis of the accuracy of diagnostic tests for COVID-19
Abstract
Objective: To collate the evidence on the accuracy parameters of all available diagnostic methods for detecting SARS-CoV-2.
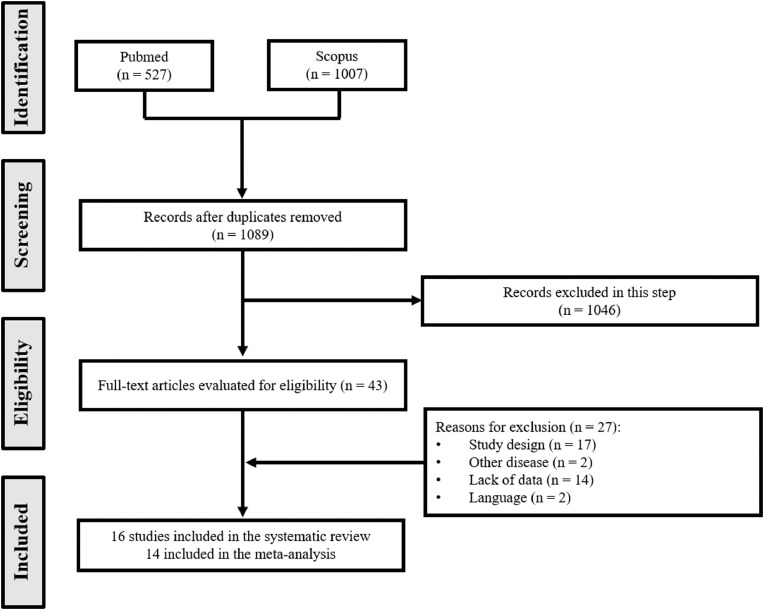
Methods: A systematic review with meta-analysis was performed. Searches were conducted in Pubmed and Scopus (April 2020). Studies reporting data on sensitivity or specificity of diagnostic tests for COVID-19 using any human biological sample were included.
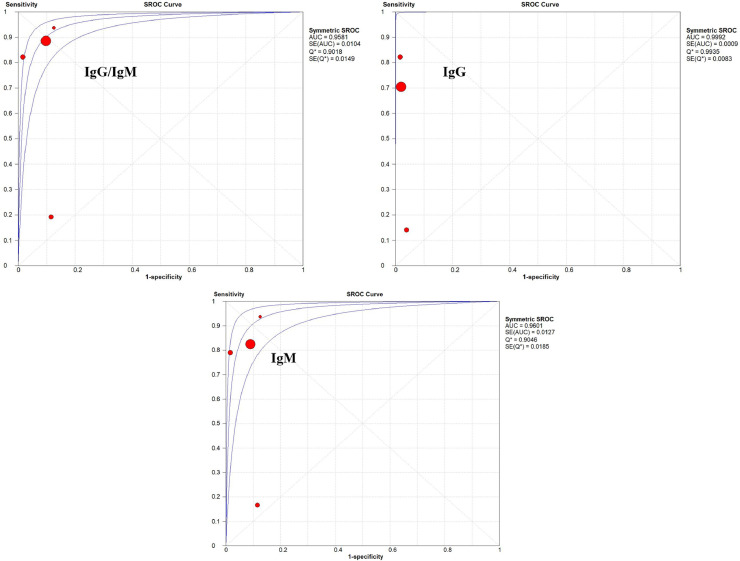
Results: Sixteen studies were evaluated. Meta-analysis showed that computed tomography has high sensitivity (91.9% [89.8%-93.7%]), but low specificity (25.1% [21.0%-29.5%]). The combination of IgM and IgG antibodies demonstrated promising results for both parameters (84.5% [82.2%-86.6%]; 91.6% [86.0%-95.4%], respectively). For RT-PCR tests, rectal stools/swab, urine, and plasma were less sensitive while sputum (97.2% [90.3%-99.7%]) presented higher sensitivity for detecting the virus.
Conclusions: RT-PCR remains the gold standard for the diagnosis of COVID-19 in sputum samples. However, the combination of different diagnostic tests is highly recommended to achieve adequate sensitivity and specificity.
Keywords: Coronavirus; Evidence; SARS-CoV-2; Sensitivity; Specificity.
Copyright © 2020 Association for Professionals in Infection Control and Epidemiology, Inc. Published by Elsevier Inc. All rights reserved.
Figures
References
-
- WHO . 2020. Coronavirus Disease (COVID-2019) Situation Reports.https://www.who.int/emergencies/diseases/novel-coronavirus-2019/situatio... Available at:
Publication types
MeSH terms
Substances
LinkOut - more resources
Full Text Sources
Other Literature Sources
Medical
Miscellaneous
